Altcoin
This page lists the latest Altcoin news and market analysis. Browse articles, expert insights, and updates in this category on JrKripto. Stay informed with in-depth coverage of cryptocurrency trends and developments.
News
Altcoin News
Altcoin News
Browse all Altcoin related articles and news. The latest news, analysis, and insights on Altcoin.
Ethereum Reserves Exceed $10 Billion: 64 Companies Listed
Ethereum's rise in the corporate world continues unabated. Ethereum reserves held by public companies, treasuries, DAOs, foundations, and long-term investors have officially surpassed $10 billion. This represents a 50-fold increase in just four months.In April, it was $200 million, and by July, it surpassed $10 billionAccording to Strategic Ethereum Reserve data, the reserve, which initially held just $200 million in ETH at the beginning of April, reached $3 billion by the end of June and $10.5 billion by the end of July. This increase was particularly driven by the adoption of Ethereum as a strategic asset by public companies. For example, BitMine Immersion Technologies increased its Ethereum reserve to 625,000 ETH, the value of these assets reaching approximately $2.35 billion. The company aims to own 5% of the entire ETH supply in the long term. Similarly, SharpLink currently holds approximately 438,200 ETH, worth $1.69 billion. The company's current unrealized profit from its Ethereum holdings has exceeded $400 million. According to the data, companies holding at least 100 ETH in their treasuries are as follows:1. Bitmine Immersion Tech2. SharpLink Gaming3. The Ether Machine4. Ethereum Foundation5. PulseChain Sac6. Coinbase7. Bit Digital8. Mantle9. Golem Foundation10. BTCS Inc.11. Gnosis DAO12. U.S. Government13. Lido DAO14. Ethereum Name Service15. Frax Finance16. Arbitrum DAO17. Status18. Optimism Foundation19. Zentry20. Request Network21. GameSquare Holdings22. ETH Strategy23. Onchain Foundation24. Intchains Group25. Aave DAO26. KR1 plc27. Kleros28. State of Michigan29. Nouns30. BrainDAO31. Gitcoin32. Axie Infinity33. Renzo Protocol34. Exodus35. Fluid36. Api3 DAO37. Sandclock38. BTC Digital Ltd39. UNCX Network40. Aavegotchi DAO41. Cartesi Foundation42. kpk43. Ready44. Ronin Network45. Harbinger Digital46. Obol47. SporkDAO48. Blockscape49. Botto50. RealmsDAO51. Bankless52. Abstract53. Royal Government of Bhutan54. StarHeroes55. Balancer56. Katana Foundation57. Ekubo Protocol58. Freysa59. The DeFi Collective60. DeFiGeek Community61. After School Club62. MetaLeX Labs63. Centaurus Energy Inc.64. Coinage MediaNew Major Player: The Ether MachineThe Ether Machine announced that it purchased 15,000 ETH to celebrate Ethereum's 10th anniversary, bringing its total reserves to 334,757 ETH. This amount exceeds the Ethereum Foundation's reserves. The company plans to go public on Nasdaq under the symbol ETHM in the last quarter of the year. It aims to raise a total of $1.6 billion.The Ether Machine co-founder Andrew Keys emphasized that Ethereum serves as a backbone for the new digital economy, stating that their mission to accumulate and support ETH is far greater than financial gain. The ETher Machine, which has been making huge purchases recently, took its place in the top 3. Startups Also in the RaceThe race to accumulate Ethereum isn't limited to large companies. BTCS Inc. announced its preparations for a $2 billion new ETH acquisition by filing with the U.S. Securities and Exchange Commission (SEC). Meanwhile, 180 Life Sciences (ATNF) is seeking funding to establish a $425 million ETH treasury and plans to change its name to "ETHZilla Corporation." Even the gaming industry is opening Ethereum reserves. The multiplayer blockchain-based game StarHeroes announced a reserve of 410 ETH. It was stated that this initiative is not limited to accumulating ETH but also aims to increase the utility and long-term value of the $STAR token. According to Standard Chartered analysts, corporate treasuries could hold 10% of the Ethereum supply in the future.

OMNI Comment and Price Analysis July 30, 2025
OMNI Technical Analysis Falling Trend Structure Analyzing the OMNI chart on a daily time frame, we see that the price retreated to the level at $3.28 and below it at first, and then it gained strong momentum and surged to the level at $8. As a result of this huge momentum, OMNI tested the upper end of the trend, yet it saw a sell-off there and pulled back to the range between the levels at $4.80–$4.90.The range between $4.82–$5.63 stands as a strong resistance zone, and for the time being, the $5.63 level in particular is about to be tested. If the price can close above this resistance level and hold above it, we could see renewed buyer interest. We have the strong support level at $3.28 below; if broken downwards, the price is likely to pull back to the range between the levels $2.70–$2.50. This area also contains the previously tested bottom dynamic.These analyses, not offering any kind of investment advice, focus on support and resistance levels considered to offer trading opportunities in the short and medium term according to the market conditions. However, traders are responsible for their own actions and risk management. Moreover, it is highly recommended to use stop loss (SL) during trades.

TOSHI Comment and Price Analysis July 30, 2025
TOSHI Technical Analysis Symmetrical Triangle Formation Analyzing the TOSHI chart on a daily time frame, we can see the clear symmetrical triangle pattern, and the price keeps contracting within this formation through higher lows and lower highs. It is currently trading close to the mid-border of the triangle formation at around $0.00055–$0.00056, which serves as both support and a potential reaction zone. The upper and lower convergence points of the triangle are classically considered potential breakout areas.We see that the upper border of the triangle formation is around the range of $0.00072–$0.00082, and it is hard to get a confirmation for an upward move unless this range is exceeded. The level at around $0.00112 could be a potential target if we can see price closings above this key range.We have the support level at $0.00050 below, and if it gets broken downwards, we can see a pullback towards the range between the levels at $0.00035–$0.00030.These analyses, not offering any kind of investment advice, focus on support and resistance levels considered to offer trading opportunities in the short and medium term according to the market conditions. However, traders are responsible for their own actions and risk management. Moreover, it is highly recommended to use stop loss (SL) during trades.

What is Nexo (NEXO)?
Do you have cryptocurrency but don't want to spend it? Imagine a platform that both earns interest and offers instant loans. Nexo (NEXO) meets this need. This innovative platform, launched in 2018 (yes, Nexo was launched in 2018), allows you to instantly convert your digital assets into cash using a crypto-collateralized loan system. It also helps you generate passive income with its crypto interest-earning feature. Users can quickly obtain loans using assets like BTC, ETH, and stablecoins as collateral through the Nexo lending platform, while still benefiting from the returns on these assets.In other words, Nexo is known as a crypto banking startup that allows you to obtain instant loans using cryptocurrencies as collateral and generate income from your assets. If you're looking for answers to questions like "What is Nexo?" or "What is Nexo Coin?", this guide will explore many details, from the platform's logic to its founding team, from its products and interest rates to its future. Nexo's Definition and OriginNexo is a crypto-collateralized lending platform that allows users to obtain instant cash loans by using cryptocurrencies such as Bitcoin, Ethereum, and Litecoin as collateral. The platform allows users to borrow against fiat currency (USD, EUR, etc.) or stablecoins using the digital assets deposited as collateral. This allows cryptocurrency holders to obtain cash liquidity without having to sell their assets.The most striking aspect of this system is that users do not need a credit score or bank procedures to obtain a loan. This means a decentralized and intermediary-free lending experience is provided. The Nexo lending platform assigns a credit limit to the user based on the value of the collateral, and users can access the loan within this limit at any time.Founded in 2018, this initiative was brought to life by a team with backgrounds in traditional finance. The co-founders' previous experience at Credissimo, a fintech company operating in Europe, provided significant technical and regulatory infrastructure for this project.Nexo not only provides loans but also offers users the opportunity to earn interest on their crypto assets. This means you can use your cryptocurrency as collateral to access loans, while simultaneously generating passive income. Thanks to this two-way service model, Nexo combines both borrowing and asset valuation needs under one roof.The NEXO token, the cornerstone of the platform, is at the heart of this system. By holding this token within the platform, users receive benefits such as discounted loan interest rates and increased interest earnings. Furthermore, for those who want to increase their loyalty levels, staking is also required. This provides a clear answer to the question of what the NEXO token does: it serves as both a utility and a rewarding tool. A sample account that demonstrates the many uses of NEXO. Users have access to the Nexo Card, stock trading, futures trading, borrowing, and earning. Nexo is considered one of the pioneers of the "bankless banking" vision in the cryptocurrency world. It offers a revolutionary alternative for crypto holders to both invest their assets and meet their immediate cash needs. The cumbersome procedures encountered in traditional systems, such as approval processes, credit score monitoring, and proof of income, are replaced by a user model that simply deposits crypto into their wallet and provides collateral. This is one of the main reasons why Nexo is preferred by millions of users around the world.Nexo's History: Key MilestonesTo truly understand a platform, we need to consider not only its offerings but also its origins and growth. Nexo's story begins not with ordinary beginnings, but with firm steps aimed at establishing a lasting presence in the crypto finance world. This project, which launched in 2018, has expanded not only its products but also its vision in the intervening years. Let's take a look at Nexo's journey and the significant developments it has experienced during each period. 2018: The Nexo platform launched, offering the first crypto-collateralized loan service (the Nexo launch date is known as 2018). The same year, the NEXO Token (NEXO) was launched, positioning itself at the heart of the ecosystem.2019: Nexo launched interest-bearing crypto accounts (Earn Interest), allowing users to earn passive income through assets like stablecoins and Bitcoin. During this period, the number of users increased by up to 850%.2020: Nexo began distributing a share of company profits (dividends) to NEXO token holders. For example, in August 2020, $6.1 million in dividends were distributed to token holders. That same year, the expansion of the "Earn on Crypto" feature increased interest rates, and the Nexo Loyalty Program was launched.2022: Nexo partnered with global payment giant Mastercard to announce its crypto-collateralized credit card product. This card enabled cryptocurrencies to be used in everyday life by providing collateral and spending opportunities for crypto assets. Furthermore, Nexo strengthened its enterprise-grade security and custody solutions by partnering with institutions such as Fidelity Digital Assets and Ledger Vault.2023–2024: The Nexo ecosystem expanded significantly. The Nexo Pro advanced trading platform, the Nexo Wallet (non-custodial wallet), a user-friendly storage solution, and the globally recognized Nexo Card were launched. In particular, the Nexo Card was launched in Europe as the first crypto-supported card integrated with Mastercard's infrastructure, allowing users to spend their assets without exchanging funds. By 2023, Nexo had become a platform serving over 1 million users in over 200 territories and managing over $4 billion in assets. NEXO Pro. Why is Nexo Valuable?When evaluating a platform, it's often more meaningful to approach it with questions like, "What does it offer, how does it work, and what does it offer the user?" From this perspective, Nexo offers lending, interest-earning, and token-based advantages. You can obtain loans by using your cryptocurrencies as collateral, and you can also earn interest by holding your assets in a Nexo account. Additionally, there's a loyalty system that varies based on the amount of NEXO tokens you hold, which affects your interest rates and loan costs. In other words, the platform operates on a model that combines several core functions. Let's examine these functions one by one:Crypto-Collateralized Instant LoansNexo allows users to instantly obtain loans by using their digital assets (BTC, ETH, etc.) as collateral. This allows users to meet their urgent cash needs with a crypto-collateralized loan; users can secure financing by using their crypto assets as collateral without selling them. Savings rates on the most popular cryptocurrencies Earning passive income from assetsThe platform offers interest income on stablecoins, Bitcoin, Ethereum, and many crypto assets. Users earn daily interest income on the digital assets they hold in their Nexo account. For example, Nexo offers annual interest rates of up to 10% on stablecoin deposits, depending on loyalty levels, and around 5–8% on mainstream cryptocurrencies like Bitcoin. (Nexo interest rates vary depending on asset type, market conditions, and loyalty levels.)Exclusive benefits for NEXO token holdersThe NEXO token, Nexo's native token, provides holders with various privileges within the platform. NEXO token holders can benefit from lower interest rates when taking out loans and receive bonus increases on interest income applied to other assets in their accounts. Additionally, in past years, a portion of platform profits has been distributed to NEXO token holders as dividends.The NEXO token is a central part of the Nexo ecosystem; it is not only an investment tool but also a structure that unlocks a system of benefits and rewards within the platform. Holding NEXO places you in tiers like Base, Silver, Gold, or Platinum within the Loyalty Program, which increases your interest rates, lowers loan interest rates, and earns bonuses like crypto cashback.The requirements for each tier are as follows:Base: You don't need to hold NEXO tokens.Silver: The amount of NEXO tokens in your account must be at least 1% of your total portfolio.Gold: The percentage of NEXO tokens must be at least 5% of your portfolio.Platinum: At least 10% of your portfolio must be NEXO tokens.This means users with higher loyalty levels benefit from benefits such as higher deposit interest rates, lower loan interest rates, and more free crypto withdrawals. For example, Platinum members can borrow at much lower rates than other users and maximize returns on savings products.Nexo later added a staking mechanism to this loyalty system; you can also earn interest directly by locking NEXO tokens on the platform. For example, when you reach the Platinum level, you can earn significantly higher interest income than other users and benefit from the lowest interest rates when taking out loans. Furthermore, the NEXO token also features dividend distribution; in past years, up to 30% of company profits have been distributed to token holders (this system continues today with an interest-based mechanism). In short, the NEXO token acts as an economic lever that makes the platform's services more advantageous.A product ecosystem that combines traditional and digital financeNexo brings together the worlds of traditional finance and the crypto world with innovative products like the Nexo Pro and Nexo Card. Nexo Pro caters to experienced investors by offering professional-grade trading tools and high liquidity, while the Nexo Card allows you to make purchases using your crypto-secured credit limit for daily expenses. This provides Nexo with a comprehensive ecosystem for using and managing crypto assets in the real world.A user who increases their loyalty level by staking the NEXO token not only earns more interest on their assets but also benefits from lower costs when taking out loans. As the chart above shows, as loyalty levels increase, so do free withdrawals and crypto cashback on spending. This multi-tiered rewards system is a key driver of user loyalty within the Nexo ecosystem (for example, Platinum members can earn up to 2% crypto cashback on Nexo Card spending). Nexo Card platform With the Nexo Card, you can spend with your crypto collateral at over 90 million MasterCard merchants, just like using a traditional credit card. One of the card's key advantages is that there's no minimum payment requirement on your outstanding balance and no interest accrues on unused credit limits. This means the interest you pay applies only to the amount of credit you actually use, and when your debt-to-collateral-to-value (LTV) ratio is below 20%, the interest rate can be as low as 0%. With these features, the Nexo Card stands out as a pioneering product that allows you to meet your daily financial needs without disrupting your crypto assets.The Future of Nexo (NEXO) CoinThe future of the NEXO coin will directly depend on the success of the Nexo platform and the overall trajectory of the crypto finance sector. With the withdrawal of many competing centralized crypto lending platforms (such as Celsius and BlockFi) from the market in 2022–2023, Nexo has become one of the key players remaining in the industry. The platform continues its growth with new product launches and global expansions, processing more than $1.5 billion in crypto loans in 2024 and distributing over $250 million in total interest income to its customers. Nexo's 2025 plans include creating new use cases for the NEXO token, updating its loyalty program, and listing the token on more crypto exchanges. As long as the company maintains its focus on regulatory compliance and transparency, the future of Nexo appears positive. However, given the volatile nature and regulatory dynamics of crypto markets, it's important for investors to proceed with caution and research.Who Founded Nexo?To answer the question of who Nexo is, the platform is backed by an experienced team of Bulgarian origin. The company was founded in 2018 by Antoni Trenchev, Kosta Kantchev, and Kalin Metodiev. The founding partners have strong backgrounds in financial law, fintech, and investment banking, bringing their experience from the European financial world to the crypto sector. For example, Antoni Trenchev served as a Member of the Bulgarian Parliament and is known for his work supporting the adoption of blockchain technologies. The Nexo team consists of professionals with over 30 years of traditional finance experience, and the company operates globally through operations in Zug (Switzerland) and London. Nexo takes a proactive approach to compliance (regulation), focusing on meeting legal requirements in various countries.Since its inception, Nexo has emphasized the principles of reliability and transparency. The team behind the platform has previously achieved success with traditional online lenders like Credissimo. This has enabled Nexo to establish a reliable credit infrastructure in the crypto sector. The company utilizes advanced custody solutions (e.g., Ledger Vault insurance) to secure customer assets and verifies its balance sheet health through regular independent audits. For example, Nexo, one of the first in the industry, announced the implementation of real-time proof-of-reserves through a major auditing firm, transparently demonstrating that the platform holds more assets than liabilities. Additionally, in 2023, Nexo successfully completed a SOC 2 Type 2 audit for system and data security, raising its compliance and security standards to the next level.Frequently Asked Questions (FAQ)Below are some frequently asked questions and answers about NEXO:What is Nexo and how does it work?: Nexo is a digital finance platform that offers instant cryptocurrency-backed loans and also earns interest on deposits. The platform works by allowing users to lock their cryptocurrencies as collateral and receive instant loans in return. Loans on Nexo offer flexible repayment terms; you can keep your loan open by paying only the interest as long as your collateral remains in your account, or you can repay the principal and pay off the debt at any time.What does NEXO token do?: The NEXO token is the native cryptocurrency of the Nexo ecosystem and functions as a key advantage. Users who hold this token receive numerous benefits on the platform: For example, NEXO holders can earn annual returns of up to 12%, start taking advantage of low crypto loan interest rates of 2.9%, and earn crypto cashback rewards of up to 2% on Nexo Card spending. The NEXO token also allows you to increase your loyalty level, allowing you to earn privileges like higher interest rates and free withdrawals on your other assets.How to get a loan with Nexo: Getting a crypto-backed loan on the Nexo platform is quite easy. First, you sign up to the platform and deposit supported cryptocurrencies like Bitcoin and Ethereum into your account. These deposited digital assets are used as collateral to calculate a credit limit; you can generally borrow up to 50% of your asset value (LTV ratio). The loan amount is instantly reflected in your account as fiat currency (e.g., USD, EUR) or stablecoin. Nexo loans have no installment or maturity requirements; you can keep your loan open by making interest-only payments or pay off the principal at any time. Furthermore, as long as you keep your LTV ratio low (for example, if your loan amount doesn't exceed 20% of your collateral), the interest rate can even be 0%. How to earn interest on Nexo?: To earn interest on the Nexo platform, simply deposit your cryptocurrency or stablecoin assets into your Earn account. For example, when you deposit a stablecoin like USD Coin (USDC), you can earn annual interest returns of up to 10–12%, depending on market conditions and your loyalty level. Popular cryptocurrencies like Bitcoin and Ethereum, on the other hand, have annual interest rates of 5–8%. At Nexo, interest returns are calculated daily and credited to your account daily. You can continue to earn compound returns by reinvesting these interest earnings, or you can withdraw and use the accumulated interest at any time.Is Nexo reliable and regulated?: Nexo is one of the most established crypto finance platforms in the industry and actively promotes security and legal compliance. The company meticulously implements KYC (know your customer) and AML (anti-money laundering) processes, ensuring users use the platform in compliance with regulations. Having completed licensing and registration processes in many countries, Nexo protects customer assets with insured custody services and verifies through independent audits that its reserves more than cover its obligations to customers. Furthermore, due to regulatory uncertainties in the US in 2022, Nexo terminated its services in that country and reached a $45 million settlement with the relevant authorities, demonstrating Nexo's commitment to meeting regulatory demands. Of course, as with any financial platform, users should act within their own risk tolerance; however, Nexo is generally recognized as a reliable platform in the industry.What are the benefits of staking NEXO tokens?: Holding (staking) your NEXO tokens on the Nexo platform offers multiple benefits. Firstly, you earn up to 12% annual interest on your NEXO balance, meaning you earn extra income even while your tokens are on the platform. Furthermore, as you hold more NEXO, you reach higher levels in the Loyalty Program, earning higher interest rates on your other assets and lower interest rates on loans. For example, a user who holds NEXO above a certain percentage can reach Platinum status, benefiting from maximum interest rate discounts and the highest cashback rates on the Nexo Card. Historically, NEXO holders have also received a share of Nexo's dividends, which can be seen as a long-term incentive for token ownership.For more information on crypto-enabled financial services and digital asset loans, check out our JR Kripto Guide series.

JPMorgan and Coinbase Partnership Announced: A New Era Begins in 2026 Era
US-based financial giant JPMorgan Chase and cryptocurrency exchange Coinbase have signed a groundbreaking partnership in the digital finance world. As part of this newly announced strategic partnership, users' Chase bank accounts will be directly linked to Coinbase crypto wallets. This connection is expected to be operational in 2026.Direct bank-to-wallet accessThe most striking aspect of the partnership is that, thanks to JPMorgan's secure API infrastructure, Chase customers will be able to directly link their bank accounts to their Coinbase wallets. This will allow users to conduct crypto transactions directly through their banking systems. JPMorgan and Coinbase emphasized that this integration will raise the bar in terms of both security and data privacy in financial transactions.Melissa Feldsher, Head of Payment and Credit Innovation at JPMorganChase, said, “This collaboration with Coinbase will give our customers greater control over their financial future. Thanks to the flexibility provided by our Ultimate Rewards program, users can now securely convert their points into crypto assets.” Credit card and reward points are being converted into cryptoThe two companies' collaboration isn't limited to bank connections. Another feature planned for launch in the fall of 2025 is the availability of Chase credit cards on Coinbase. This step paves the way for the greater integration of traditional financial instruments into the crypto world.Points from JPMorgan's popular "Chase Ultimate Rewards" loyalty program will also be transferred one-to-one to Coinbase accounts. This marks the first time a major credit card rewards program has been used to fund crypto wallets. 100 points can be converted into crypto, worth $1. These features are also planned to launch in 2026.Coinbase's Head of Consumer and Business Products, Max Branzburg, commented on the partnership: "This partnership with JPMorganChase is an important step in making crypto participation more accessible. Together, we are removing the barriers to adoption of blockchain-based financial services by providing consumers with more choice."Coinbase aims to build a more equitable and open financial system through the opportunities offered by the crypto economy. The platform, which currently offers services such as trading, storage, staking, spending, and global transfers to millions of users, also provides infrastructure for projects developing blockchain applications.Coinbase is a US-based platform that offers basic services for users looking to buy and sell cryptocurrencies. The app allows users to trade popular cryptocurrencies, store, and transfer assets. While known for operating in compliance with regulations, it has occasionally been criticized for high transaction fees or delays due to congestion. While it's a popular entry point into the crypto world, it's not a perfect fit for all users.
ENS Comment and Price Analysis July 30, 2025
ENS Technical AnalysisENS witnessed a strong upward momentum following the breakout of the downtrend channel within which it had been trading for a long time. The price swiftly surged to the level at $32.00 following the breakout; however, it is now going through a short-term correction period on account of the sell pressure occurring at this area.ENS is currently trading at around the level of $28.29, and we have the first key support range around the levels at $25.80 – $26.45 in case the downward correction continues. However, if this key support is lost, we should be following the range between the levels at $22.10 – $22.63, which represents a strong support line where previous price pressures have occurred, and buyers could re-enter the picture. ENS Current View Summary:• Price: $28.29, strong rally after downtrend breakout• First support zone: $25.80 – $26.45• Key support zone: $22.10 – $22.63• Resistance levels: $32.01 → $38.73 → $45.27These analyses, not offering any kind of investment advice, focus on support and resistance levels considered to offer trading opportunities in the short and medium term according to the market conditions. However, traders are responsible for their own actions and risk management. Moreover, it is highly recommended to use stop loss (SL) during trades.
TIA Comment and Price Analysis July 30, 2025
TIA Technical AnalysisLooking at the TIA chart, we can say that the downtrend pattern which has been active for a long period of time is still valid. Though the price drew near to this downtrend zone again with the help of the latest upward movement, it was rejected at the level of $2.11 and went into a correction.TIA is trading around the level at $1.878, and this level coincides with the short-term support line between the levels at $1.88 and $1.81. As long as this range is maintained, the price could be propelled upward. Moreover, if we see a break above the resistance level of $2.11, the price could rapidly surge to the target range between the levels at $2.36 and $2.45.On the other hand, we have a support zone between the levels at $1.60 and $1.43 to follow in case the downward pressure intensifies and the level of $1.81 gets broken. At this level, we expect that buyer interest will increase. Falling Trend Structure Summary:Price: $1.878Short-term support: $1.81Resistance area: $2.11Targets in case of an upside breakout: $2.36 → $2.45 → $2.78Support in case of a downside scenario: $1.60 → $1.43 → $1.31The downtrend in TIA has not yet been broken. A break above the $2.11 resistance level will provide clearer trend reversal signals. Otherwise, support areas should be closely monitored.These analyses, not offering any kind of investment advice, focus on support and resistance levels considered to offer trading opportunities in the short and medium term according to the market conditions. However, the user is responsible for their own actions and risk management. Moreover, it is highly recommended to use stop loss (SL) during trades.

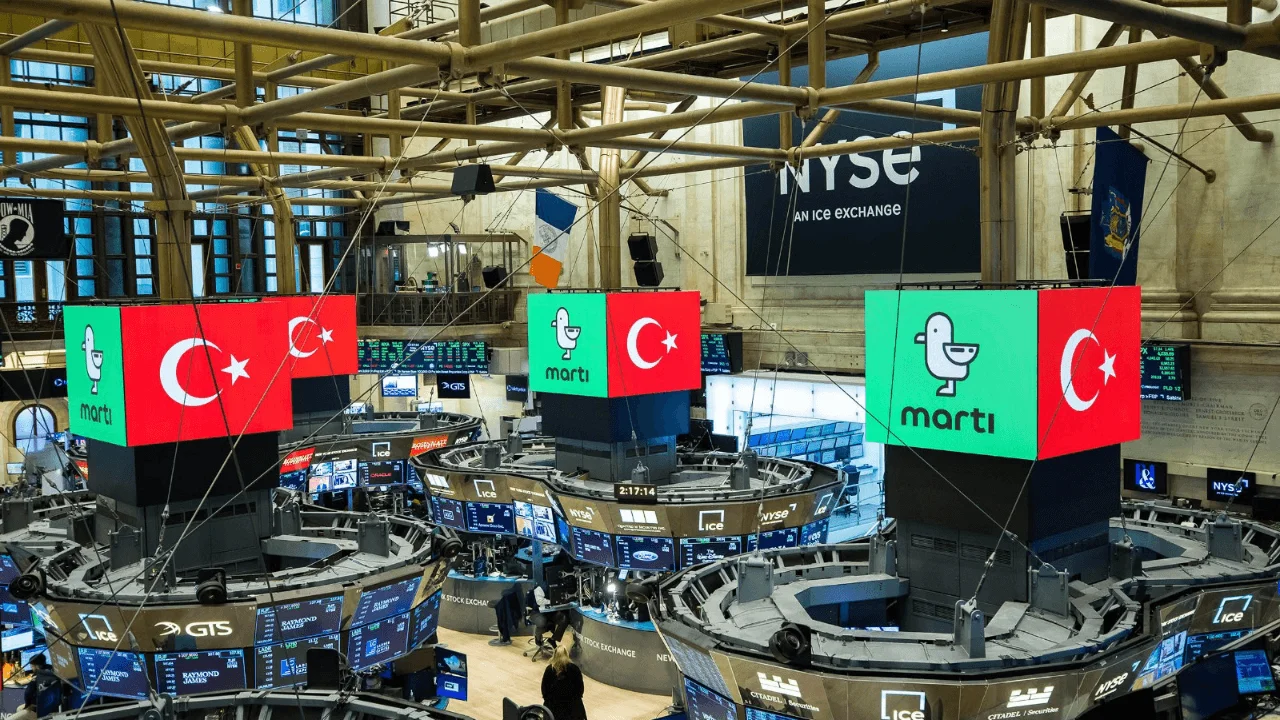
NYSE-Listed Martı Makes Crypto Treasury Move: Invest in Bitcoin, Altcoins Next
Martı Technologies (MRT), a Turkey-based mobility startup listed on the NYSE, has taken a significant step that challenges traditional treasury management approaches. The company announced that it will allocate 20% of its cash reserves to Bitcoin, integrating crypto assets into its corporate treasury strategy. With this move, Martı has become one of the companies that view crypto assets not only as a speculative tool but also as a long-term store of value and a shield against financial risks.Cryptocurrency investments could reach up to 50%The company announced that the crypto asset ratio could be increased to 50% over time. It was also stated that this potential increase may not be limited to Bitcoin; other leading crypto assets such as Ethereum and Solana could also be included in Martı's reserves in the future. All digital assets will be securely stored through platforms that provide institutional-grade custody services in compliance with regulations. Martı Founder and CEO Oğuz Alper Öktem summarizes the motivation behind this strategy:“Our decision to allocate capital to crypto assets demonstrates our belief that Bitcoin and other digital assets have proven their store of value alongside hard currencies and gold over the past few years. This strategy represents a prudent and long-term stance in the current economic environment, where we face inflationary pressures and currency risks.”The company emphasized that this move will not disrupt its current operations or business plans. It was stated that crypto asset purchases will be made from excess cash reserves and will not impact operational expenses. It also announced that future digital asset transactions will be announced transparently, in accordance with legal requirements.The company announced that it had reached 2.15 million passengers and 314,000 registered drivers as of June 3, 2025. This represents a 12.7% increase in passengers and an 8.3% increase in drivers in just two months. Martı's fleet consists of micromobility vehicles such as electric scooters, bicycles, and mopeds, operating in major cities across Turkey. The company plans to expand its presence from major cities like Ankara, Istanbul, Izmir, and Antalya to include Konya, Kayseri, Bursa, Mersin, Adana, and Kocaeli. With this expansion, Martı aims to increase its potential user base from 28.8 million to 42 million.Co-founder Cankut Durgun was appointed Chief Operating Officer as of June 12, 2025. Cenk Özeker, with over 25 years of experience, has also joined the new Chief Financial Officer.As a result, this move marks Martı Technologies' inclusion among publicly traded companies, joining giants like MicroStrategy, Tesla, and Blockchain, in incorporating crypto into their balance sheets.
LDO Comment and Price Analysis July 29, 2025
LDO/USDT Technical AnalysisLooking at the LDO chart, we can clearly see that a downtrend is obvious. The price tested the strong resistance range between the levels at $1.25 – $1.31, which work as both horizontal resistance and the upper border of the triangle pattern. Therefore, it should be considered as normal if the price sees some sell pressure here in terms of technical perspective. Falling Trend Theme LDO is currently trading at around the level of $1.047. The range between the levels at $0.90 and $0.95 seems to be the support area we should be following in the event of a continued pullback. This price range has worked as a significant demand area in the past, and it is highly possible that the price will move back towards the upper border of the triangle with the reaction it receives from here.If the price gains momentum from this support zone and goes up to break out of the triangle pattern, we should be following the resistance levels at $1.318, $1.464, and $1.959 respectively.In case of a downward scenario, we can say that closings below the level of $0.90 could activate the lower support levels at $0.78 → $0.70 → $0.611.These analyses, not offering any kind of investment advice, focus on support and resistance levels considered to offer trading opportunities in the short and medium term according to the market conditions. However, traders are responsible for their own actions and risk management. Moreover, it is highly recommended to use stop loss (SL) during trades.

FXS Comment and Price Analysis July 29, 2025
FXS Technical AnalysisThe Frax protocol has restructured its stablecoin system through a new architectural update called "North Star." This update aims to open the frxUSD stablecoin to broader institutional integrations. In particular, thanks to its decentralized reserve model and harmonized governance system, Frax aims to create a stronger foundation for new partnerships and regulation-friendly integrations. The impact of these developments becomes more meaningful when analyzed alongside the technical outlook.The descending channel pattern in action since 2022 catches our attention when we look at the chart on a daily time frame. The price is trading up and down between the lower and middle borders of this falling channel, with no clear directional confirmation yet. We see that FXS got its latest rejection at the upper border of the channel and then it retreated to the level where MA50 is located. There is a potential two-way possibility for the price: either it will go down and retest, or it will go up for a breakout, which could be more likely if we see increased volume, particularly during the price action near the upper border of the channel.There is also a great possibility for a sharper price action following the breakout, as this channel has been active for a long period of time—meaning that when the price breaks in one direction, a serious movement area may arise in terms of the continuity of the trend. Falling Wedge Structure Support and Resistance LevelsThe first major support area lies at the level of $3.20, which has been tested many times before but defended by buyers. However, if the price breaks downwards, then we will probably see a pullback to the level at $2.93.On the other hand, if the price can see closings above the level of $3.50, then we could witness a surge to the levels at $3.90 and $5.00, which will confirm the upward breakout of the formation. However, if the price closes below the level of $3.20, then it seems possible to test $2.93 followed by other lower support levels.These analyses, not offering any kind of investment advice, focus on support and resistance levels considered to offer trading opportunities in the short and medium term according to the market conditions. However, the user is responsible for their own actions and risk management. Moreover, it is highly recommended to use stop loss (SL) during trades.

EIGEN Comment and Price Analysis July 29, 2025
EIGEN Technical OutlookLooking at the EIGEN chart, we can see a clear contracting triangle pattern, and the price is nearing the end of it. We should be alert about a possible breakout.The level at $1.22, where both the formation's support and horizontal support areas intersect, is the lower border of the triangle formation; therefore, this level is a key area, and if the price finds a buyer after testing this area, the possibility of an upward breakout increases.According to the triangle formation, the upper resistance is around the level at $1.60, which, if broken, could propel the price as long as the triangle’s height. In this case, medium-term price targets for EIGEN could be the levels at $1.80 and $2.50.The price levels at $1.09 and $0.96 should be followed as support areas in case of a pullback. Narrowing Triangle Structure Summary:• Price: $1.298, trading within a contracting triangle formation.• Triangle bottom support: $1.22• Triangle top resistance: $1.60• Targets for an upward breakout: $1.80 → $2.53• Support for a downward breakout: $1.09 → $0.969In triangle structures, the direction of the breakout typically results in a strong move. Therefore, the direction of the breakout from the formation should be carefully monitored.These analyses, not offering any kind of investment advice, focus on support and resistance levels considered to offer trading opportunities in the short and medium term according to the market conditions. However, traders are responsible for their own actions and risk management. Moreover, it is highly recommended to use stop loss (SL) during trades.
CETUS Comment and Price Analysis July 29, 2025
CETUS Technical OutlookCETUS has been trading within the descending triangle formation for a long time, and we can see that it is gradually approaching the upper zone. Looking at the chart, it is obvious that there is a narrowing area, and CETUS is trading around the level at $0.12.The first resistance level will be around the level at $0.155 if the price can break out of this narrowing pattern. Breaking through this zone suggests the price could gain momentum. The range between the levels at $0.194–$0.241 seems to be a major resistance zone. Especially the level at around $0.24 could be the first target level after the breakout.In the event that the downward sell pressure continues, the first support level will be $0.118, followed by $0.108. If the price drops below this level, the lower horizontal support area of the triangle at $0.077 appears to be the major support area. CETUS Current View Summary:The price is trading at around $0.1271, within the narrowing area.In case of a breakout, the first target is $0.1557, followed by $0.1941 → $0.2419Short-term price target is $0.24In case of downward pressure, support levels are $0.1186 → $0.1088 → $0.0858 → $0.0777These analyses, not offering any kind of investment advice, focus on support and resistance levels considered to offer trading opportunities in the short and medium term according to the market conditions. However, traders are responsible for their own actions and risk management. Moreover, it is highly recommended to use stop loss (SL) during trades.

ACH Comment and Price Analysis July 29, 2025
ACH Weekly Technical AnalysisACH has been trading within an ascending channel pattern for a long time. And this channel is getting narrower; the price is trading around the level at $0.0242.We can clearly see that the price has pulled back to the support level at around $0.0179 in recent weeks and bounced from there. The level at $0.0199 will act as intermediate support in the short term, while the level around $0.0270 will act as the main resistance on the upside.We have the upper border of the channel and the resistance level located around the range between the levels at $0.0366 – $0.0408. If the price surpasses this range, it is expected that the price should technically go up as long as the channel’s length, which makes the level of $0.0570 a potential target in the mid to long term.In case of a downward scenario, the formation will become invalid if the price drops below the level at $0.0179, and then a correction might continue until the support level at around $0.0128. The Channel Rising in the Weekly Chart Summary:Price: $0.0242, ACH is trading within an ascending channel.Support levels: $0.0199 → $0.0179Resistance areas: $0.0270 → $0.0366 – $0.0408Possible target in case of an upward breakout: $0.0570In case of a drop, a correction until the level at $0.0128 is possibleThese analyses, not offering any kind of investment advice, focus on support and resistance levels considered to offer trading opportunities in the short and medium term according to the market conditions. However, traders are responsible for their own actions and risk management. Moreover, it is highly recommended to use stop loss (SL) during trades.

Chinese E-Commerce Giant Applies for Two Different Cryptocurrencies
Chinese e-commerce giant JD.com is preparing to take a significant step into the digital asset world. Ahead of new stablecoin regulations in Hong Kong, which will take effect on August 1st, the company has filed trademark applications for two crypto assets, "JCOIN" and "JOYCOIN." This move is being interpreted as a sign that JD.com is preparing to launch its own fiat-backed stablecoin.The applications, submitted by JD.com's fintech subsidiary, JD Coinlink Technology, reveal that the stablecoins will be pegged 1:1 to the Hong Kong dollar (HKD) on a public blockchain. According to a statement by JD.com President Richard Liu Qiangdong, the company aims to obtain stablecoin licenses not only locally but also globally, achieving a cost advantage of up to 90% in cross-border payment transactions. Liu said, "We hope the JD stablecoin will become a universal payment method worldwide." Stablecoin announcement on JD Coinlink website According to information on JD Coinlink's official website, this new digital asset aims to become one of the leading stablecoins widely available to individuals and institutions. The company also emphasized that the stablecoin has not yet been launched and that users should be wary of fraudulent projects.This development follows its participation in the stablecoin pilot program (sandbox) launched by the Hong Kong Monetary Authority (HKMA) last year. JD Coinlink participated in this program alongside prominent institutions such as Standard Chartered Hong Kong, Animoca Brands, and Hong Kong Telecommunications. Following the sandbox process, the company officially announced its plans to launch a stablecoin.Stablecoin Law to be Enacted in Hong KongHowever, JD.com's stablecoin move is part of its strategy to prepare for the new regulatory environment. The Hong Kong Stablecoin Ordinance, which will come into effect on August 1, will only allow licensed projects to operate. HKMA CEO Eddie Yue stated that approximately 50 companies have applied for licenses to date, but most will be eliminated due to inadequate planning and risk management.Under the new law, offering or promoting unlicensed fiat-backed stablecoins will be illegal. Violators face up to six months in prison and a fine of approximately $6,300. These strict regulations are intended to prevent speculative transactions and ensure financial security in the digital asset market.While the HKMA has not yet officially announced a licensed stablecoin company, JD Coinlink's applications demonstrate its ambition to be an early mover in the stablecoin market. Industry figures suggest that Hong Kong could become a global hub for stablecoin innovation in this new era.

SEC Postpones Trump's Bitcoin ETF Until September: INJ and SOL ETF Applications on the Table
The U.S. Securities and Exchange Commission (SEC) has postponed its decision on the Truth Social Bitcoin ETF, filed in June by Trump Media & Technology Group. This ETF, offered by the company, which operates the Truth Social platform, aims to offer investors direct exposure to Bitcoin through a publicly traded fund structure.In a statement, the SEC stated that it needed more time to evaluate the proposed ETF and announced that the review period has been extended until September 18th. The agency's official statement read, "The Commission has determined that a longer period is appropriate to consider the proposed rule change and the issues it raises."The Truth Social Bitcoin ETF is just one of many noteworthy crypto products recently being offered to the U.S. market. However, the primary reason this fund stands out is its direct connection to former U.S. President Donald Trump. Trump frequently posts on Truth Social and has not been shy about publicly expressing his interest in digital assets. Besides the Truth Social Bitcoin ETF, other Trump-linked crypto ventures are also showing a notable increase. Various meme coin projects bearing Trump's name are gaining market share, while World Liberty Financial, a DeFi project allegedly backed by figures close to the Trump family, is also making headlines.The SEC's cautious approach continues: Applications also received for INJ and SOLThe SEC's cautious approach to ETF applications is noteworthy. The commission is meticulously reviewing ETF applications related not only to Bitcoin but also to leading tokens like Ethereum and Solana. The regulator prioritizes investor protection while fostering innovation. This balancing act often leads to lengthy decision-making processes. On the same day, Cboe BZX also filed a formal application with the SEC for the Canary Staked INJ ETF, which will track Injective's native token, INJ. Canary Capital Group, the ETF sponsor, first introduced the product earlier this month. On the same day, an application was also submitted for the Solana ETF, developed in partnership with Invesco and Galaxy.
