
ARKM/USDT Technical Analysis
On the ARKM chart, we see the price moving within an ascending channel. The channel structure is quite organized, and the price reacts strongly to both horizontal support and resistance zones, as well as the channel boundaries.
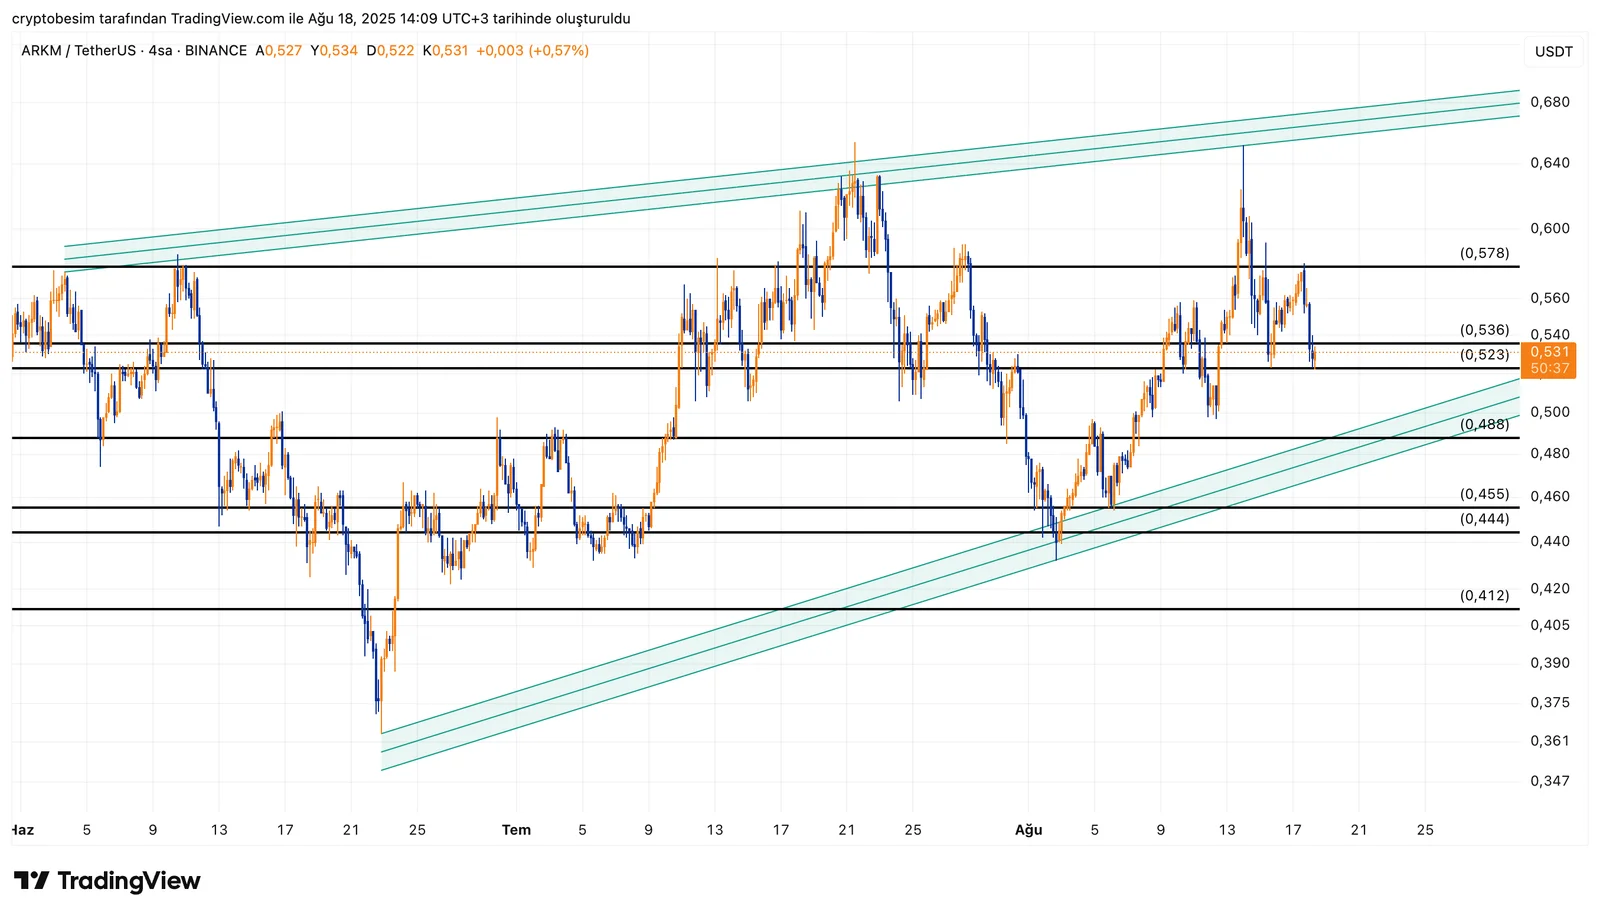
Currently, the price is trading between $0.52 and $0.53. This area represents a critical short-term support level. If it manages to hold above this level, the potential for a rally towards the $0.57 resistance level will increase. The $0.57 area is the most significant short-term resistance level. If it can sustain above this level, the price can be expected to initiate a strong and volatile move towards the upper band of the channel. The upper band of the channel corresponds to the average $0.70 area.
In a downside scenario, if the $0.52 support level is broken, the price is likely to initially retreat to the $0.48 area. In a deeper correction, the $0.45 and $0.41 levels stand out as support levels. However, sustaining below $0.41 could weaken the bullish scenario.
The overall structure is positive within the ascending channel. A sharp and volatile move is likely after the channel breakout. The direction of the breakout should be closely monitored.
These analyses do not constitute investment advice and focus on support and resistance levels that may present potential trading opportunities in the short and medium term, depending on market conditions. However, the responsibility for executing trades and managing risk lies entirely with the user. It is also strongly recommended to use stop-loss orders for any trades mentioned.


