
BNB Technical Outlook
On the daily chart, BNB is moving within an ascending channel. The overall structure appears positive, with the prevailing trend pointing upward.
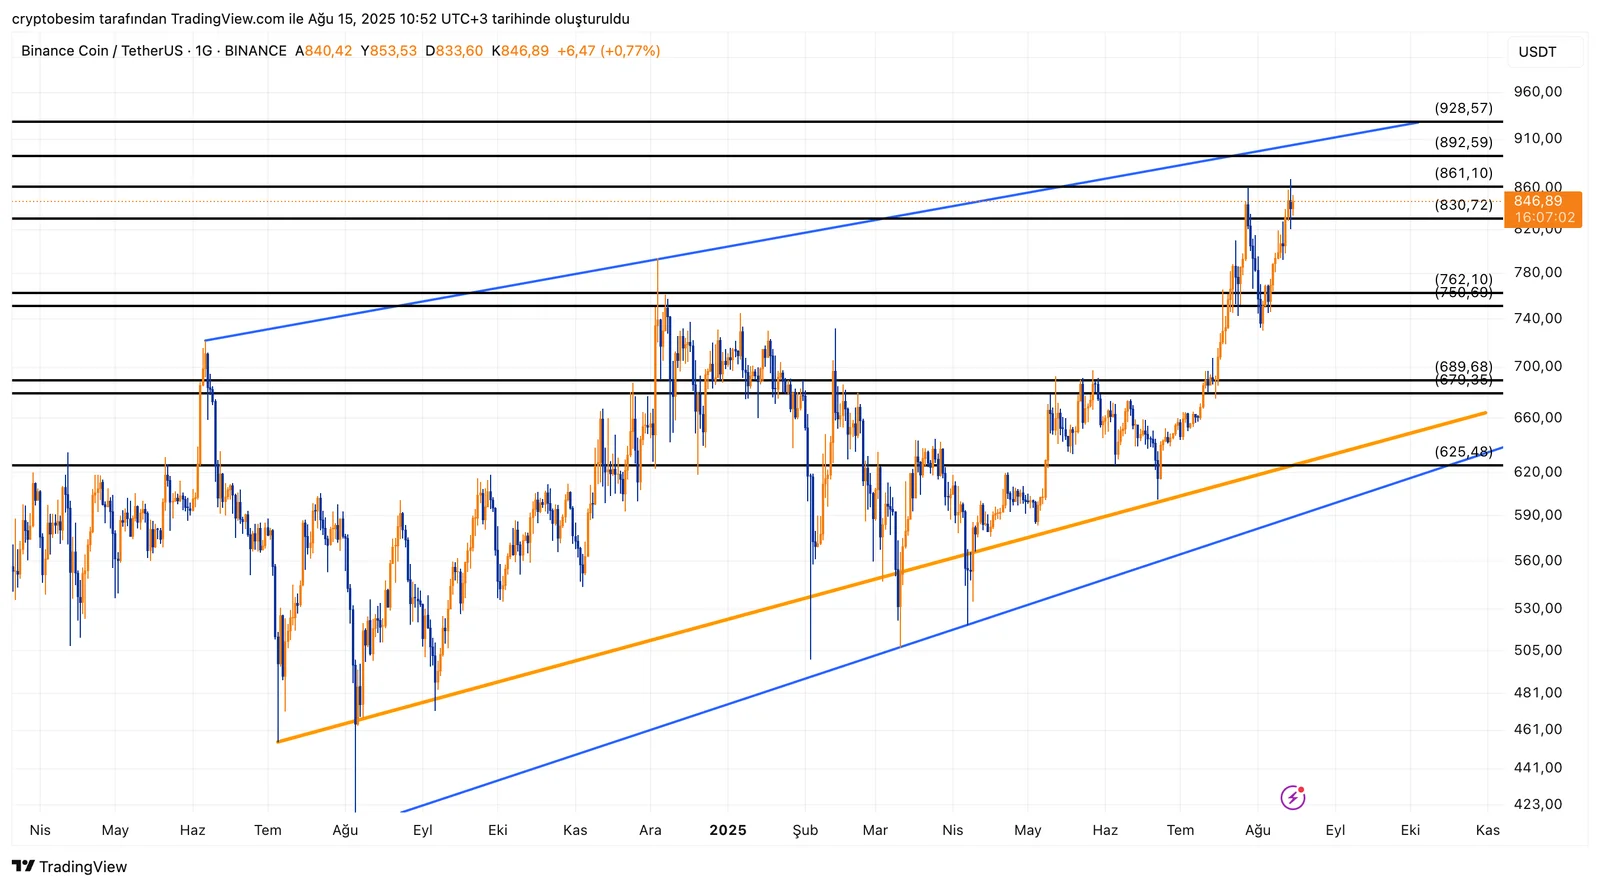
At the moment, the price is trading at $847. The $861 resistance level has been tested twice in a short period, confirming it as a strong resistance zone. Just above this level lies the channel’s trend resistance. For a trend test, the price would need to approach the $900 region. The $900–$928 range also stands out as a resistance area. Currently, the broader $850–$930 zone is acting as a selling area for BNB. A breakout above this zone would imply a target equal to the channel’s width, which points to approximately the $1,500 region.
On pullbacks, the key support levels to watch are:
- $830
- $790
- $752–$762
These analyses do not constitute investment advice and focus on support and resistance levels that may present potential trading opportunities in the short and medium term, depending on market conditions. However, the responsibility for executing trades and managing risk lies entirely with the user. It is also strongly recommended to use stop-loss orders for any trades mentioned.


