Altcoin
This page lists the latest Altcoin news and market analysis. Browse articles, expert insights, and updates in this category on JrKripto. Stay informed with in-depth coverage of cryptocurrency trends and developments.
News
Altcoin News
Altcoin News
Browse all Altcoin related articles and news. The latest news, analysis, and insights on Altcoin.
Visa’s New Platform Shakes the Market, Deals 5% Blow to Circle
Visa has unveiled a new institutional platform designed to help banks, fintech companies and cryptocurrency firms develop stablecoin-based products. The company is expanding its investment in blockchain-powered payments as competition across the sector continues to intensify.Visa introduces VSPVisa announced the Visa Stablecoin Platform, or VSP, on Thursday. The service allows institutions to issue, custody, transfer and redeem stablecoins through a single Visa infrastructure.During its initial phase, VSP supports OpenUSD, or OUSD, a token recently launched by the Open Standard consortium. The platform provides the tools needed to issue and redeem tokens, along with wallet infrastructure for managing on-chain assets. Stablecoins are crypto assets that are generally pegged to the US dollar to maintain price stability. Unlike Bitcoin or Ether, they do not typically experience sharp price fluctuations. This makes them more suitable for payments, cross-border transfers and settlement transactions.Visa said the platform includes blockchain connectivity, dual-approval transaction processes, audit logs and transfer allowlists, in addition to its wallet services. VSP also integrates with Visa’s existing payment network.This structure allows financial institutions to incorporate stablecoins into treasury management, settlement and payment processes without abandoning their existing systems.Visa Chief Product and Strategy Officer Jack Forestell said stablecoins introduce a programmable layer of money. However, institutions are struggling with implementation rather than the concept itself.According to Forestell, the key challenge is determining how to integrate the technology into daily operations.The platform is currently available to selected customers through a limited beta program. Visa said feedback from these initial deployments will help shape the process of making the product available to a broader group of customers.Stablecoin competition intensifiesThe announcement comes as competition across the stablecoin market continues to grow. Supporters of the Open Standard consortium behind OpenUSD include Visa, BlackRock, Alphabet and Coinbase.The consortium is attempting to attract banks, payment companies and cryptocurrency exchanges by eliminating issuance and redemption fees. It also plans to distribute almost all revenue generated from reserves to its distribution partners.Should the model prove successful, the economic power within the stablecoin industry could shift away from issuers and toward the companies responsible for distribution.The pressure from this competition is already becoming visible. Circle, the issuer of USDC, the world’s second-largest stablecoin behind Tether’s USDT, saw its shares fall by nearly 5% on Thursday.Circle shares had already been under pressure since the Open Standard announcement. Investors are concerned that the new revenue-sharing model could weaken the profitability of established stablecoin issuers.

90-Year-Old Asset Management Giant Launches ETF Covering 9 Cryptocurrencies
U.S. asset management giant T. Rowe Price entered the crypto sector on Thursday with the launch of a cryptocurrency ETF trading on NYSE Arca under the ticker TKNZ. The company initially filed for the product in October last year, meaning the launch process took around nine months to complete.The Baltimore-based company has been managing assets for nearly 90 years and oversees close to $1.9 trillion in client assets. T. Rowe Price describes TKNZ as the market’s first actively managed multi-token spot cryptocurrency ETF. The key difference lies in how the fund is managed. Rather than tracking a fixed index, fund managers can adjust portfolio weightings based on the company’s own research and market outlook. This structure separates TKNZ from existing passive spot crypto ETFs, which generally track a single asset or a predetermined index.Portfolio includes nine crypto assetsWhen the fund began trading, its portfolio was allocated as follows:• Bitcoin (BTC): 40.75%• Ethereum (ETH): 18.42%• BNB: 11.01%• Solana (SOL): 9.44%• XRP: 9.37%• Hyperliquid (HYPE): 6.45%• Stellar Lumens (XLM): 3%• Dogecoin (DOGE): 1.28%• USD Coin (USDC): 0.16%• Cash and cash equivalents: 0.11%What analysts are saying?Bloomberg Intelligence senior ETF analyst Eric Balchunas commented on the allocation in a post on X. He described the Bitcoin weighting as low while viewing the allocations to the remaining assets, particularly HYPE, as relatively high.According to Balchunas, the fund launched with approximately $15 million in assets and charges a 0.75% management fee. That rate is higher than the fees applied by some passive Bitcoin and Ether ETFs currently available in the market.HYPE’s relatively large portfolio weighting may appear unusual at first, but the token has recently become one of the stronger performers in the cryptocurrency market. Its price reached an all-time high of around $74.50 last month. It is currently trading near $65.60 and has gained 38% over the past year.Bitcoin, by comparison, has lost 45% during the same period. This divergence in performance may partly explain the difference between their portfolio weightings.The fund will be permitted to invest in proof-of-stake networks, but it will not initially use any of its holdings to generate staking income. The prospectus does not completely rule out staking and notes that the practice could be introduced in the future.This cautious approach reflects a broader trend among fund managers offering products involving staked crypto assets, as regulatory uncertainty surrounding staking has yet to be fully resolved.The fund will be led by Blue Macellari, head of T. Rowe Price’s digital assets unit, who will serve as lead portfolio manager. Four associate portfolio managers will support her.TKNZ’s price performance and potential inflows and outflows during its first weeks of trading will offer an important indication of how much institutional demand exists for actively managed, multi-token cryptocurrency ETFs.

Bithumb to Delist 5 Altcoins as Prices Suffer Sharp Losses
South Korean cryptocurrency exchange Bithumb has announced that it will terminate trading support for Gracie (GRACY), Tottenham Hotspur Fan Token (SPURS), ZTX (ZTX), With (WIKEN), and StepApp (FITFI) on August 18, 2026. The decision came after all five assets had remained on the exchange’s investment warning list for several months.The process began months agoBithumb designated the five tokens as investment warning assets on April 16, 2026, following a decision by the Digital Asset Exchange Alliance, or DAXA. The reason was not related to a technical issue; the tokens’ total market capitalization and trading volume across domestic and international exchanges had fallen below the minimum thresholds set by the exchange.In its announcement at the time, Bithumb said it would disclose its final decision on either extending the warning period or terminating trading support during the third week of July. The expected process has now concluded, with all five projects facing the same outcome: delisting.Under Bithumb’s standard procedure, users receive an additional period to withdraw their assets after trading support ends. This window usually remains open for around one month.Investors need to transfer their balances away from the exchange before the withdrawal deadline. Otherwise, technical support for mainnet upgrades, hard forks, airdrops, token swaps, and similar operations may no longer be available.Prices had already reflected the riskPrice charts for the five tokens indicate that the investment warning process had been weighing on their valuations for months. FITFI lost more than 75% over the past 30 days and fell another 27.78% over the past 24 hours, trading at $0.0000598. ZTX dropped 26.29% over the past 24 hours to $0.0001706. The token also recorded a 28.74% decline over the past 30 days.Project WITH was trading at $0.0012392 after falling 3.98% in the past 24 hours. However, some market data platforms outside Bithumb are currently not displaying an active price feed for the token.GRACY also suffered a 3.22% decline over the latest one-hour period.SPURS was the notable exception. Tottenham Hotspur Fan Token gained 2.62% over the past 24 hours and 2.75% over the past seven days despite the delisting announcement.The token remains down 8.05% over the past 30 days and was trading at $0.1039447. The short-term increase may have resulted from sudden speculative movements commonly seen in low-liquidity markets.A practical timeline for investorsBased on Bithumb’s previous delisting procedures, withdrawal support is expected to continue for approximately one month after trading ends on August 18. The exchange had previously noted that it could reverse the decision if the warning status of the assets was removed, but that did not happen for any of the five projects.The most immediate step for investors is clear. Anyone holding one of the five tokens must either sell it before trading support ends or transfer it to another supporting exchange or a personal wallet.Otherwise, balances may remain technically visible on Bithumb, but the exchange will no longer provide price valuations. Withdrawals could also become subject to additional procedures at a later stage.Bithumb said it regularly reviews listed assets, maintains communication with project teams, and prioritizes investor protection. However, the growing number of small-cap token delistings by major Korean exchanges such as Bithumb and Upbit suggests that tighter regulatory scrutiny is creating a cleansing effect across the lower end of South Korea’s cryptocurrency market.

What Is Enso (ENSO)?
For blockchain developers, the hardest part is often not finding a new idea. It is making that idea work across different networks and smart contracts. Enso aims to bring a process that normally requires hundreds of separate integrations into a single execution layer. The ENSO token supports network security, validation, delegation and governance.Enso’s Definition and OriginsEnso is an execution network designed to help developers create transactions across different blockchains, protocols and smart contracts. The project describes itself as a unified network that connects the fragmented blockchain landscape.ENSO is the native crypto asset of this network. It plays a role in validation, staking, delegation and governance within Enso Network. According to the official documentation, ENSO also supports the network’s operation and economic security.Enso’s core approach allows developers to specify the result they want instead of coding every step of a transaction separately. These outcome-based requests are known as “intents” in the crypto industry.For example, a developer may want to move USDC from Ethereum to Base and deposit it into a specific yield vault. Under the traditional model, the bridge, swap and vault contracts would need to be integrated separately.Enso breaks this request into the necessary transaction steps. It then brings together the required protocols, execution route and smart contract calls.This infrastructure is not limited to token swaps carried out by individual users. Wallets, decentralized finance applications, asset management platforms, fintech companies and AI agents can also use Enso’s infrastructure.Which networks does Enso support?Enso Network was designed as a Tendermint-based Layer 1 network. The project’s technical paper states that the network brings smart contract interactions from different blockchains into a shared state map.It is important to distinguish Enso Network from the networks on which the ENSO token is available. ENSO has an ERC-20 contract on Ethereum and a separate contract on BNB Smart Chain. The official documentation publishes both contract addresses.Enso’s product infrastructure is not limited to a single network. Its Route API can create transaction paths between tokens and decentralized finance positions across different chains.The system supports actions such as token swaps, bridging, vault deposits, closing positions and moving assets between protocols. For cross-chain transactions, the target network is included in the request, while Enso selects the relevant bridge and execution route.The project’s early technical roadmap focused mainly on EVM-compatible networks. Its whitepaper also listed broader support for the Solana Virtual Machine and Move Virtual Machine among its longer-term objectives.These targets should not be interpreted as features that became available at the same time or reached the same level of maturity. Supported chains, protocols and transaction types may change as Enso updates its APIs and products.Why was Enso created?The main problem Enso aims to address is blockchain fragmentation. Each network uses its own state data, smart contracts and technical standards.Even when a protocol operates on several chains, every deployment may require a separate integration. Developers need to track contract addresses, functions, transaction inputs, outputs and security requirements one by one.This process extends development timelines. It also increases maintenance, auditing and security costs.Enso stores different contract interactions within a shared map. It classifies actions such as swapping, borrowing, lending, depositing, repaying, transferring and approving under standardized action types.Developers can then communicate the outcome they want through an intent request. Enso calculates a route capable of producing that result and generates transaction data that is ready to be signed.This reduces the need to build a new adapter for every protocol. Much of Enso’s value proposition is based on easing this integration burden.Enso’s History: Important MilestonesEnso’s history dates back to 2021. During its early period, the project operated under the name Enso Finance and worked on a decentralized finance product focused on social trading and asset management.Swiss startup reports state that Enso Finance was founded in February 2021 by Connor Howe and Gorazd Ocvirk. That same year, the project completed a $5 million private funding round co-led by Polychain Capital and the Dfinity Beacon Fund.When the project’s first product failed to attract the expected level of interest, the team shifted its attention toward the infrastructure problems it had encountered during development. According to Enso’s official account, the team lost considerable time to manual integrations, smart contract audits and ongoing maintenance.This led to the creation of infrastructure components called Actions and Shortcuts. These tools were initially developed for the team’s internal needs, but they later became a service that other developers could use.Enso’s current official announcements identify Connor Howe as CEO and co-founder. A technical paper published in July 2024 lists Connor Howe, Peter Phillips and Milos Costantini as its authors.The official website does not provide a detailed list covering every current team member and founder. For this reason, unverified titles associated with the original Enso Finance team and the later Enso Network structure should be treated carefully.In June 2024, Enso raised more than $4.2 million in additional funding. The round included IDEO Ventures, Hypersphere Ventures and more than 60 angel investors from various Web3 projects.The announcement stated that the funding would support product development and work on the Tendermint-based network.The project’s backers include Polychain Capital, Multicoin Capital, Cyber Fund, Spartan, IDEO CoLab Ventures, Hypersphere Ventures and several other crypto investment firms. Enso’s official website lists these organizations among its investors.The ENSO token launch and exchange listingsThe ENSO community sale took place on CoinList in June 2025. A total of 4 million ENSO, equal to 4% of the initial supply, was allocated to the sale.The sale price was set at $1.25 per token. This corresponded to a fully diluted valuation of $125 million.According to CoinList, tokens purchased during the sale were fully unlocked at the Token Generation Event. The community allocation did not include a long-term lockup or linear vesting schedule.ENSO’s Token Generation Event took place on October 14, 2025. Binance Research reported that the token launched with an initial supply of 100 million ENSO and an initial circulating supply of 20.59 million.On the same date, Binance included ENSO in its HODLer Airdrops program. The first trading pairs on Binance included ENSO/USDT, ENSO/USDC, ENSO/BNB, ENSO/FDUSD and ENSO/TRY.ENSO was later listed on additional centralized cryptocurrency exchanges. These listings increased accessibility while also contributing to high price volatility during the token’s early trading period.An exchange listing does not prove a project’s technical success on its own. Trading volume, circulating supply, upcoming token unlocks and broader market conditions can all affect the ENSO price.Major developments and current statusEnso already had an operational Shortcuts infrastructure before the token launch. In an April 2025 update, the project stated that this system had routed more than $15 billion in transaction volume across over 10 blockchain ecosystems.Berachain’s Boyco liquidity program became one of Enso’s most prominent use cases. According to figures published by Enso, the Shortcuts infrastructure supported protocol-level transactions involving more than $3.1 billion in assets moving from Ethereum to Berachain.Enso did not directly provide the bridge in this process. LayerZero and Stargate handled the cross-chain transfer, while Enso created the steps required to route and deposit assets into the target protocols.The first live phase of Enso Network began with validators in October 2025. Validators came online, ENSO staking opened and transaction data began to be verified through simulation.The project plans to expand other participant roles, including Graphers and Action Providers, in later stages. Official statements therefore describe the network’s development as a gradual decentralization process.Enso’s activities in 2026 extended beyond decentralized finance transactions. In June 2026, the team introduced the Enso RWA App, which provides access to tokenized stocks, funds, bonds, commodities and stablecoins. The application launched with xStocks and Ondo integrations. Access to specific assets varies according to the user’s location and the rules imposed by the relevant issuer.During the same period, Bitget Wallet integrated Enso’s execution infrastructure. The project also expanded its support for the MegaETH ecosystem and continued developing its Quoter product for more reliable transaction simulations.As of July 2026, the ENSO coin price was around $0.74. How Does the ENSO Token Work?The first major use case for ENSO is network security. Enso validators lock ENSO to verify transaction data produced by the system.Validators simulate the calldata generated in response to a request. This process checks whether the transaction can be executed on the target chain and whether it can produce the expected result.Staking acts as economic collateral within this system. If a validator approves incorrect or malicious transaction data, part of its staked assets may be slashed.ENSO can also be used for delegation. Token holders who do not want to operate their own validator infrastructure can delegate ENSO to a validator.Delegators may receive a share of the validator’s verification revenue. Returns can vary depending on validator performance, commission rates, network revenue and current staking conditions.Governance is another use case for the token. Users who lock ENSO can vote through the Enso DAO on proposals concerning future versions of protocol contracts and the development of the network.The official token economics page states that staking solely for governance voting does not provide a separate reward. Proposals must also meet the required participation threshold before they can pass.The whitepaper describes ENSO as the gas asset for network requests and state changes. It also proposes that Graphers, Action Providers and validators stake ENSO to participate in the network. Staking dashboard Because all participant roles have not launched at the same stage, these use cases may have different levels of maturity. Validator staking currently stands out as the network’s first active economic role.ENSO supply and token economicsENSO launched with a genesis supply of 100 million tokens. However, this figure does not represent the project’s maximum supply.Enso uses an inflation mechanism to reward validators. Annual inflation begins at 8% and gradually declines each month.According to the official model, annual inflation falls to 0.35468% in the tenth year. New token issuance then ends, bringing the maximum supply to 127,339,703 ENSO.This explains why some data platforms show different figures for total supply and maximum supply. The initial supply of 100 million increases over time through validator emissions.Investors received 31.305% of the initial supply. The team allocation was set at 25%, while the ecosystem allocation, including the airdrop, accounted for 21.59%. The Enso Foundation received 16.605% of the supply. The CoinList community round was allocated 4%, while two advisers received a combined allocation of 1.5%.Investor, team and adviser tokens were subject to a one-year cliff. After the first year, these assets begin unlocking linearly on a block-by-block basis over 24 months.Given that ENSO launched in October 2025, the first major vesting period for these groups may begin around October 2026. Investors should consult the official unlock schedule for exact amounts and dates.This structure matters when assessing potential supply pressure. If the circulating supply rises while demand fails to grow at the same pace, newly unlocked tokens may create selling pressure.However, an unlock does not automatically mean that every token will be sold. The team, investors or ecosystem funds may hold, stake or use the unlocked assets for operational purposes.Staking, validation and network securityEnso’s security model is based on simulating transactions before users sign them. Validators check whether solutions submitted by Graphers or other infrastructure components can operate as intended.During validation, the current state of the target chain is replicated. The transaction data is executed in this environment, allowing expected balance changes and contract results to be reviewed.Enso’s technical design allows several solutions to be generated for a single user request. Participants called Graphers combine actions from the shared network map to create alternative transaction routes.Validators simulate these solutions. The whitepaper describes a system that aims to select a valid solution offering a higher output at a lower execution cost.Action Providers are developers who add smart contract abstractions to the system. They create modules defining how actions such as swaps, lending and staking should be called.Action Providers may receive a share of network revenue when their contributions are used. Graphers can also earn fees when the routes they generate are selected.However, validators were the primary participant role during Enso’s first live network phase. A fully permissionless structure for other participant roles remains part of the project’s later roadmap.This distinction is important when evaluating the network’s security. Enso’s operational API products and its planned fully decentralized network may not yet be at the same level of maturity.Enso also offers a separate simulation and verification service called Quoter. It can simulate EVM transactions created outside Enso without modifying them, producing estimated outputs, gas usage and verification results.Simulation does not eliminate smart contract risk. The state of the blockchain may change between signing and execution, an integrated protocol may be exploited or bridge infrastructure may experience technical problems.Why Is Enso Important?The same transaction can require different contracts and tools across separate blockchain networks. This fragmentation may turn a process that appears to require only a few clicks into months of development work behind the scenes.Enso aims to shorten this process through shared transaction components. Its Route API automatically calculates a suitable path between an initial asset and a target asset or DeFi position.A simple swap may involve only one action. A more complex transaction may combine bridging, token conversion, approvals and a vault deposit.Where possible, Enso combines same-chain actions into a single atomic transaction bundle. Cross-chain steps require asynchronous tracking between the source and destination networks.This approach may allow developers to access more protocols with fewer custom integrations. It can also make it faster to expand a product to new networks and assets.Enso’s contribution to liquidity comes from its ability to route assets from different chains into specific applications. Even when a user does not hold the correct token on the target network, Enso may create a suitable cross-chain route.The Berachain Boyco program demonstrated this use case by moving liquidity from different networks into a new ecosystem. Enso prepared the transactions required to deposit assets into target DeFi protocols after they crossed the bridge.Integrations, community and governanceEnso’s ecosystem includes projects such as CoW Swap, Royco, Velvet, Glider, Wayfinder and Stargate. The official website also states that the network has more than 95 integrations or customers.Royco used Enso for multi-step DeFi transactions during the Boyco program. Benqi integrated Enso’s routing infrastructure to provide access from different networks to lending products on Avalanche through a single transaction flow.Contango used Enso to add new asset pairs with a lower integration burden. According to the project’s case study, the platform gained access to more than 300 trading pairs through this infrastructure.These examples show that Enso is positioned mainly as a background infrastructure provider rather than a direct consumer-facing brand. Users may interact with Enso technology through a wallet or DeFi application without realizing it.The community also matters for the ENSO token’s distribution and the future of governance. The CoinList round made 4% of the total supply available to individual participants.Under the governance model, users who lock ENSO can vote on protocol proposals. However, meaningful decentralization depends on more than allowing token holders to vote.Token distribution, voter participation and the combined share controlled by investors and the team also influence how widely governance power is distributed. The large allocation assigned to investors and the team remains an important factor to monitor.Who Founded and Developed Enso?Enso’s foundations were laid in 2021 by Connor Howe and Gorazd Ocvirk. Connor Howe currently stands out as the project’s co-founder and CEO. The team gradually transformed the product, which began as Enso Finance, into Enso Network, an execution and integration infrastructure for multichain applications. Technical contributors such as Peter Phillips and Milos Costantini have also supported the project’s development at different stages.Frequently Asked QuestionsBelow are answers to some of the most frequently asked questions about Enso.What is Enso and when was it launched?: Enso is an execution network that makes it easier to create transactions across different blockchains and smart contracts. The project’s first company and product development efforts began under the name Enso Finance in 2021. The intent-based technical architecture behind Enso Network was developed in the following years. The ENSO token and the network’s first validator phase launched on October 14, 2025.What is the ENSO token used for?: ENSO is used for validator staking, delegation, network security and governance. Its technical design also proposes using the token as gas for network requests and state changes. Graphers and Action Providers are also expected to stake ENSO as additional network roles become available. The maturity of these roles may vary according to the network’s development stage.Which network does Enso operate on?: Enso Network was designed as a Tendermint-based Layer 1 blockchain. It maps smart contract actions from different blockchains within a shared state structure. The ENSO token has contracts on Ethereum and BNB Smart Chain. Enso’s Route and Bundle infrastructure can also work with several EVM networks and DeFi protocols.Who founded Enso?: Enso’s current official announcements identify Connor Howe as CEO and co-founder. Reports published in 2021 state that Enso Finance was founded by Connor Howe and Gorazd Ocvirk. Connor Howe, Peter Phillips and Milos Costantini are listed as the authors of Enso’s July 2024 technical paper. Since the official website does not provide a detailed list of every current founder and team member, titles from different periods should be distinguished carefully.What is the ENSO supply?: ENSO launched with a genesis supply of 100 million tokens. The total supply increases over time through validator emissions.Inflation is expected to end after the tenth year, bringing the maximum supply to 127,339,703 ENSO. At the time this guide was prepared, the circulating supply was approximately 20.59 million tokens.How can ENSO be staked?: ENSO can be delegated to network validators or locked as validator collateral by participants who meet the technical requirements. Users should check Enso’s official staking interface and supported wallets before completing any transaction. Staking may involve lockup periods, validator commissions and slashing risk. Users should consider validator performance and technical history rather than focusing only on the offered return.For the latest information about Enso and emerging projects across the crypto ecosystem, follow the JR Crypto Guide series.

What Is Yield Basis (YB)?
Earning revenue from transaction fees by providing liquidity is one of the oldest use cases in decentralized finance. However, as price movements become larger, impermanent loss can erase a significant portion of the fees earned. Yield Basis stands out as a DeFi protocol that approaches this problem through Curve infrastructure, crvUSD borrowing and a continuously adjusted 2x leveraged liquidity model.Definition and Origin of Yield BasisYield Basis is a decentralized protocol focused on allowing users to provide liquidity to automated market maker pools using Bitcoin- and Ethereum-linked assets. The project’s main goal is to reduce the impermanent loss seen in traditional liquidity pools while allowing users to continue earning revenue from transaction fees.The protocol is generally written as “YieldBasis” in its official documents. YB refers to the system’s ERC-20 governance token issued on Ethereum. The YB token became ready for distribution on September 15, 2025, and its maximum supply was capped at 1 billion tokens.It would be insufficient to describe Yield Basis solely as a yield platform. The protocol deposits volatile assets such as Bitcoin and Ethereum into Curve pools, borrows an equivalent amount of crvUSD and maintains the position at approximately 2x leverage.When users deposit a supported asset into the protocol, they receive tokens called yb-LP. These tokens represent the user’s share of a leveraged Curve liquidity position. Users can hold yb-LP assets in their wallets or deposit them into the relevant gauge contract to earn YB rewards.It is important to distinguish between YB and yb-LP tokens. YB is the protocol’s governance and incentive token. yb-LP functions as a position token representing a user’s share in a particular liquidity market.Ethereum, Curve and crvUSD InfrastructureYield Basis does not operate directly on the Bitcoin network. The system runs on Ethereum and uses tokenized Bitcoin assets such as cbBTC, WBTC and tBTC for Bitcoin positions. On the Ethereum side, the protocol also supports a WETH market.Because of this structure, users interact with an Ethereum-based representation of Bitcoin instead of depositing native BTC. Each wrapped Bitcoin asset depends on a different custody provider, issuer or bridge model, meaning each carries its own counterparty risks.Curve Finance infrastructure sits at the center of Yield Basis. The protocol uses Curve Cryptoswap and the updated FXSwap pools, which facilitate transactions between volatile assets and stablecoins. crvUSD serves as the borrowing instrument used to finance the stable-asset side of each position.The process can be explained with a simple example. When a user deposits a supported token worth 1 BTC, Yield Basis borrows an equivalent amount of crvUSD. The protocol then deposits both the Bitcoin representation and the borrowed crvUSD into a Curve pool.This creates a liquidity position worth approximately twice the value of the single asset deposited by the user. The Curve LP tokens are held inside LEVAMM, which manages the position’s leverage ratio.The leverage ratio is not maintained through a fixed debt position. When the price of BTC or ETH changes, the ratio of debt to the position’s value also moves. LEVAMM creates trading opportunities for arbitrageurs whenever a difference emerges between the market price and the target leverage ratio.Arbitrage transactions bring the position back toward its targeted 2x leverage level. The mechanism aims to rebalance positions through economic incentives rather than relying on automatically operated keeper transactions. However, extreme volatility, network congestion or insufficient arbitrage profitability can slow the process.Yield Basis’ Approach to Impermanent LossImpermanent loss occurs when the value of a liquidity provider’s position underperforms a strategy of simply holding the same assets in a wallet. The difference can grow as the market price moves further away from the level at which liquidity was initially provided.In a traditional BTC-stablecoin pool, the pool sells BTC and accumulates stablecoins through arbitrage transactions when the BTC price rises. When the price falls, the amount of BTC held in the pool increases. As a result, a liquidity provider may hold less BTC during an upward move and more BTC during a decline.Yield Basis attempts to change this curve by continuously maintaining the pool position at 2x compounding leverage. Under the protocol’s model, the value of the yb-LP position tracks the price of the supported volatile asset on an approximately one-to-one basis. Transaction fees are then added on top of this price exposure.Official documents describe this mechanism as a model that “eliminates impermanent loss.” However, this does not mean that the position is risk-free. Users remain fully exposed to changes in the price of the underlying BTC or ETH asset.Rebalancing costs, price oracles, the crvUSD dollar peg, Curve pool liquidity and the security of wrapped tokens can also affect the outcome of the position. Yield Basis therefore targets a particular mathematical form of impermanent loss; it does not eliminate the broader risk of losses in the cryptocurrency market.History of Yield Basis: Major MilestonesYield Basis was developed by Curve Finance founder Michael Egorov. Egorov incorporated his experience with Curve’s automated market maker models, crvUSD infrastructure and vote-escrow governance system into the design of the new protocol.Early development focused on a leverage model capable of mathematically offsetting impermanent loss. Before Yield Basis became publicly available, the project raised $5 million in February 2025 at a token valuation of $50 million.One of its first major introductions to the Curve ecosystem took place in June 2025. Egorov explained the project’s core mechanism at Curve’s event in Belgrade. In the following months, several security companies reviewed the protocol’s smart contracts.According to the official audit page, the core architecture was audited by Statemind, ChainSecurity, Quantstamp, MixBytes, Electisec and Pashov. A full-protocol security competition was also organized through Sherlock. The Hybrid Vault contracts underwent additional reviews by MixBytes and ChainSecurity in 2026.These reviews aim to reduce risk, but they do not provide an absolute guarantee of smart contract security. Yield Basis documentation also clearly states that audits may not identify every possible vulnerability and that users remain exposed to smart contract risks.Mainnet, Token Launch and Exchange ListingsOn September 24, 2025, Curve DAO approved an initial credit line of up to 60 million crvUSD for Yield Basis. The cbBTC, WBTC and tBTC markets were subsequently opened. Each initial pool launched with a capacity of approximately $1 million and reached its limit within a short period.As demand continued, the market limits were first increased to $10 million. Curve DAO later raised the credit line to 300 million crvUSD. This decision created the possibility of increasing individual pool capacities to as much as $100 million per market.The public sale of the YB token was conducted through Kraken Launch. A total of 25 million YB, equivalent to 2.5% of the maximum supply, was offered at a price of $0.20 per token. The sale provided the project with approximately $5 million in additional funding.YB trading began on Kraken on October 15, 2025. Binance also listed the token on the same day with USDT, USDC, BNB, FDUSD and TRY trading pairs. Binance announced YB as the 53rd project in its HODLer Airdrops program and allocated 10 million YB to the campaign.Token emissions also began on October 15. During the same period, the YB/crvUSD liquidity pool was launched, and an airdrop was distributed to veCRV holders who had supported certain Curve governance proposals.Current StatusAlthough Yield Basis initially launched with tokenized Bitcoin markets, it later added support for WETH. Official documentation currently lists cbBTC, WBTC, tBTC and WETH markets.The project launched its V3 architecture during May and June 2026. The V3 markets were among the first production implementations to use Curve’s updated FXSwap application. The update aimed to reduce the value lost to arbitrageurs during pool rebalancing and improve liquidity providers’ share of transaction fees.The Hybrid Vault system was also updated during the same period. Hybrid Vault allows users to create BTC or ETH positions above standard pool limits by holding a specified amount of crvUSD in scrvUSD.Under this structure, the crvUSD side follows the yield generated by scrvUSD. The cryptocurrency side tracks transaction fees from the Yield Basis pool or, depending on the user’s preference, YB emissions. Because the positions are kept separately, each section carries its own risks.With the V3 update, the crvUSD ratio required for Hybrid Vault positions was reduced from 55% to 45%. In other words, under normal conditions, $45 worth of crvUSD support is required for every $100 of Yield Basis position capacity. This ratio may change depending on governance decisions and pool conditions.The amount of locked YB exceeded 100 million tokens by the end of June 2026. According to DeFiLlama’s figures on July 14, 2026, the protocol had approximately $124 million in total value locked. Since this figure is variable, the latest value should be checked again through current data platforms.The YB coin price is around $0.07. How Does the YB Token Work?YB is the ERC-20 governance token of the Yield Basis protocol. However, the token’s main rights within the protocol do not become active when YB is simply held in a wallet.Users must lock YB to participate in governance, direct the distribution of liquidity incentives and receive a share of protocol fees. Locking YB creates a veYB position.veYB is represented as an NFT position under the ERC-721 standard. The voting power received by a user depends on the amount of YB locked and the selected lock duration. The maximum locking period is four years.Locking one YB for four years provides approximately 1 veYB in voting power. A two-year lock provides approximately 0.5 veYB, while a one-year lock provides around 0.25 veYB. Under normal locks, voting power declines linearly as the unlock date approaches.Users can also activate the “permalock” option. This model keeps the lock at the maximum four-year duration and prevents voting power from decreasing over time. Tokens cannot be withdrawn while permalock is active, although the option can be disabled under certain conditions.veYB holders can vote on protocol proposals. Under the official rules, at least 1 veYB is required to create a proposal. Proposals must meet a 30% quorum requirement and receive at least 55% support to pass. The voting period lasts seven days.Gauge voting represents another important part of governance. Each Yield Basis market has its own gauge contract. veYB holders can distribute their votes among these gauges, determining which liquidity markets receive YB emissions. When users deposit yb-LP tokens into a gauge, they give up the standard value appreciation linked to transaction fees and earn YB emissions instead. Therefore, the revenue models of staked and unstaked yb-LP positions are different.Supply and TokenomicsYB has a maximum supply of 1 billion tokens. This limit is established at the smart contract level. A total of 300 million YB was allocated for distribution over time through the gauge system as liquidity incentives.The second-largest allocation belongs to the team, with 250 million YB. The ecosystem reserve received 125 million tokens, while 121 million YB was allocated to investors. Another 75 million was reserved for Curve licensing, and 74 million YB was assigned to the protocol development reserve.The public sale covered 25 million YB. YB trading-pair rewards received 12.5 million, early liquidity providers received 11.25 million, Curve governance received 5 million and initial decentralized exchange liquidity received 1.25 million YB.Team and investor tokens begin vesting after a six-month waiting period and then unlock linearly over two years. Of the ecosystem reserve, 50 million YB was unlocked at the token generation event. The remaining 75 million tokens were placed on a two-year vesting schedule.The 75 million YB allocated to Curve unlocks in connection with liquidity incentives. When a certain percentage of the 300 million emission reserve enters the market, the same percentage of the allocation reserved for Curve DAO becomes claimable.This distribution shows that the entire YB supply is not available on the market at the same time. The circulating amount changes depending on emissions, vesting schedules, early-user distributions and the status of locked tokens. Transaction Fees, Emissions and Security StructureRevenue on Yield Basis comes from two main transaction-fee sources. The first is the fees collected by the underlying Curve Cryptoswap or FXSwap pools. The second comes from transactions on LEVAMM, most of which are performed by arbitrageurs rebalancing the positions.Holders of unstaked yb-LP earn revenue as transaction fees increase the position’s value per share. Holders who stake yb-LP do not receive this value appreciation. Instead, they earn a share of the YB emissions directed to the relevant gauge.veYB holders receive a share of the protocol’s administrative fee. Distributions take place every Thursday and are smoothed over a four-week period. Payments are not made directly in YB; they are distributed in yb-LP tokens representing active markets.The administrative fee rate depends on the proportion of yb-LP tokens staked in the market. Under the official model, the minimum administrative share is 10%. As the staking ratio rises, the proportion allocated to veYB holders also increases.Because the protocol operates on Ethereum, transactions are subject to Ethereum network fees. The mainnet contract for the YB token is also located on Ethereum. Even when an exchange offers deposits through different networks, users should separately verify the official contract address and supported network.The core contracts were designed to be immutable from a security perspective. Some fees, gauge weights and market parameters can be updated through the DAO. The protocol does not have a traditional system-wide emergency pause function, but a problematic market can be shut down and an emergency withdrawal route can be activated.Why Is Yield Basis Important?Automated market makers require liquidity for decentralized exchanges to operate. Liquidity providers meet this need but face impermanent loss when participating in pools containing volatile assets.This issue is particularly important for users who want to accumulate Bitcoin or Ethereum over the long term. Even when users earn transaction fees, their pool position may underperform a simple holding strategy during a strong price movement.Yield Basis aims to preserve users’ BTC or ETH price exposure while giving them access to pool transaction fees. Users deposit only the volatile asset; the protocol finances the required stablecoin side through crvUSD.When the model operates successfully, the liquidity provider’s position tracks the price of the underlying asset, while transaction fees generate additional revenue. This narrows the performance difference between providing liquidity and holding the asset directly.However, returns are not fixed. Fee revenue may decline when transaction volume falls. If rebalancing losses remain higher than the fees earned, value per share may grow more slowly or remain stagnant during certain periods.Yield Basis’ Position in the Curve and DeFi EcosystemAlthough Yield Basis is an independent protocol, it has strong technical and economic connections to Curve. Curve pools provide the liquidity infrastructure, crvUSD is used for leverage and Curve DAO provides the protocol with a credit line.In return, a total of 75 million YB was allocated to Curve DAO. These tokens are intended to attract incentives to crvUSD pools and strengthen stablecoin liquidity. Their final use depends on Curve governance decisions.Transactions in Yield Basis pools may also generate volume for other Curve pools. For example, a trade between a stablecoin and BTC may first be routed through crvUSD and then into the BTC market. This structure creates additional activity for Curve liquidity, PegKeeper operations and crvUSD demand.The Hybrid Vault model takes this connection further. Requiring users to deposit crvUSD into scrvUSD to obtain additional position capacity creates direct demand for crvUSD. The protocol aims to balance liquidity pressure on the stablecoin side as it grows.YB’s vote-escrow model is also inspired by Curve’s veCRV system. Users who lock their tokens for longer periods receive greater voting power, influence the direction of emissions and participate in fee sharing.This structure may encourage long-term participation. However, the concentration of voting power among a small number of large veYB holders could lead to centralized governance decisions. Yield Basis’ risk documentation also identifies voting concentration as a separate governance risk during the protocol’s early stages.Risks and VolatilityAlthough Yield Basis focuses on impermanent loss, it remains a complex DeFi protocol that uses leverage. Users are not protected against declines in the price of BTC or ETH. If the underlying asset falls by 30%, the value of the yb-LP position will generally also be affected by that price movement.The system depends on the assumption that crvUSD will maintain a value close to $1. A serious and lasting deviation in the price of crvUSD could disrupt the leverage ratio, the value of the debt and withdrawal outcomes.Arbitrage-based rebalancing does not guarantee immediate results. During periods of high Ethereum transaction fees, network congestion or rapid market movement, arbitrageurs may not act quickly enough. In this case, the position may temporarily move away from its targeted 2x leverage level.Although oracle systems use different price sources and moving averages, the risks of delay or manipulation are not completely eliminated. A difference between the actual market price and the price used by the protocol could cause transactions to occur at unexpected levels.Users may encounter a temporary reduction known as the Temporary Redemption Discount when withdrawing funds. This difference results from a pricing divergence between the Curve pool and LEVAMM and is expected to close through arbitrage activity. However, the withdrawal amount may change between blocks during volatile periods.Wrapped-asset risk is also important. WBTC and cbBTC depend on custodial organizations, while tBTC relies on bridge and decentralized signing infrastructure. If one of these tokens loses its peg to the Bitcoin price, users in the relevant Yield Basis market could be directly affected.Finally, the YB token carries its own market risk. Since the revenue of staked yb-LP positions depends on YB emissions, a decline in the token’s price can reduce the dollar value of earned rewards. New tokens entering circulation over time may also create selling pressure.Yield Basis Founder, Developers and EcosystemYield Basis was developed by Curve Finance founder Michael Egorov. Egorov is known for previously designing Curve’s automated market maker infrastructure, the crvUSD stablecoin and the vote-escrow governance model.Yield Basis’ operating model also uses technologies developed within the Curve ecosystem. The protocol combines Curve Cryptoswap and FXSwap pools, crvUSD borrowing and a veToken-based governance system within a single structure.Egorov’s role in the project is not limited to being its founder. He was also directly involved in the technical studies explaining Yield Basis’ leveraged liquidity model and the protocol’s initial public presentations.Development Team and Security WorkYield Basis’ official documents do not provide a detailed list of every developer working on the protocol. It is therefore not possible to confirm the exact size of the project team or the identities of all developers.However, several independent security firms have reviewed the protocol’s smart contracts. Statemind, ChainSecurity, Quantstamp, MixBytes, Electisec and Pashov conducted audits of different Yield Basis contracts and components.A security competition covering the protocol was also organized through Sherlock. The Hybrid Vault contracts underwent additional reviews by MixBytes and ChainSecurity in 2026.These audits help identify potential coding errors. However, security reviews do not mean that smart contracts are completely free from risk. The protocol also states in its official risk documents that users remain exposed to risks related to code, oracles, liquidity and leverage.Community, Governance and PartnershipsThe Yield Basis community participates in protocol governance through YB and veYB tokens. YB holders can lock their tokens to receive veYB and vote on protocol proposals. veYB holders also determine which liquidity pools receive YB emissions. This structure allows users to do more than simply hold the token; they can also shape the protocol’s incentive policy.Yield Basis’ strongest ecosystem connection is with Curve Finance. The protocol uses Curve pools, borrows crvUSD for leveraged positions and benefits from a credit line provided by Curve DAO.Curve DAO provided the protocol with credit capacity worth hundreds of millions of crvUSD during Yield Basis’ initial growth period. A total of 75 million tokens from the YB supply was also allocated to the Curve ecosystem and licensing model.The project conducted its token sale through Kraken Launch. YB was later listed on Kraken, Binance and several other centralized exchanges. These listings allowed the token to reach a wider group of users.Frequently Asked Questions (FAQ)Below are answers to some frequently asked questions about Yield Basis.What is Yield Basis and when was it launched?: Yield Basis is an Ethereum-based DeFi protocol that aims to create leveraged liquidity positions using BTC- and ETH-linked assets while reducing the effect of impermanent loss. Its first markets opened in September 2025. YB token trading and emissions began on October 15, 2025.What is the YB token used for?: YB is the protocol’s governance and incentive token. Users can lock YB to receive veYB. veYB gives holders the right to vote on protocol proposals, determine how YB emissions are distributed among pools and receive a share of administrative fees. Freely held YB does not provide direct protocol rights.Which network does Yield Basis operate on?: Yield Basis operates on Ethereum. In its Bitcoin markets, the protocol uses Ethereum-based Bitcoin representations such as WBTC, cbBTC and tBTC instead of native BTC. A WETH market is also supported.Who founded Yield Basis?: Yield Basis was developed by Curve Finance founder Michael Egorov. The project’s economic model is closely connected to Curve Cryptoswap pools, crvUSD and Curve’s vote-escrow governance approach.What is the YB supply?: YB has a maximum supply of 1 billion tokens. Of this amount, 30% was allocated to liquidity incentives, 25% to the team, 12.5% to the ecosystem reserve and 12.1% to investors. The circulating supply changes over time because of emissions and vesting schedules.Is Yield Basis suitable as an investment?: There is no single answer to this question. The price of YB may be affected by protocol adoption, token emissions, the locking ratio, governance demand, broader cryptocurrency market conditions and investor expectations. Providing liquidity to the protocol also carries different risks from purchasing YB. Smart contract vulnerabilities, leverage, deviations in the crvUSD price, wrapped BTC assets, limited liquidity and oracle failures may result in a loss of capital. Users should conduct their own research based on their risk tolerance and only use funds they can afford to lose.Follow the JR Crypto Guide series for the latest information about Yield Basis and new projects across the cryptocurrency ecosystem.

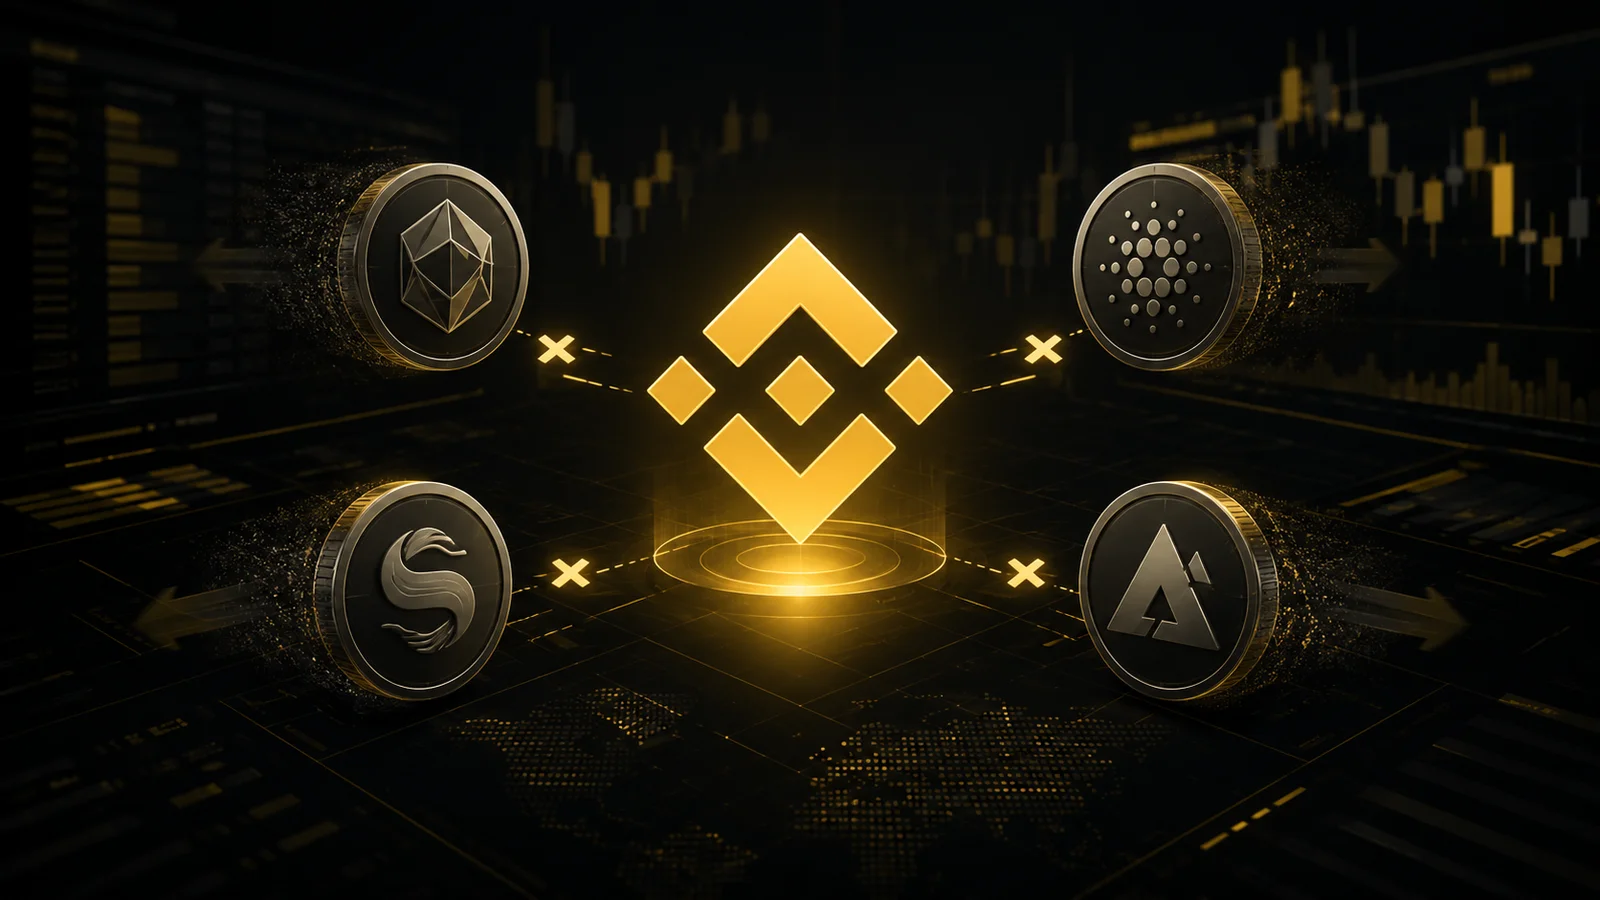
Binance to Delist Four Trading Pairs
Binance periodically reviews the spot trading pairs listed on its platform. Following its latest review, the exchange announced that it will remove four pairs. Trading in GLM/BTC, KNC/BTC, ONT/BTC and XAI/USDC will end on July 17, 2026, at 03:00 UTC. The exchange cited user protection and market quality as the reasons behind the decision. Low liquidity and weak trading volume were identified as the main criteria used to determine which pairs would be removed. It is a familiar explanation, but the consequences still directly affect users.The tokens are not being delistedThe removal applies to the trading pairs rather than the tokens themselves. GLM, also known as Golem, KNC, or Kyber Network Crystal, ONT, or Ontology, and XAI will not be completely removed from Binance Spot.Users will still be able to buy and sell these four assets through other available pairs on the exchange. Only their direct pairings against BTC or USDC are being discontinued.Trading bot users should take actionBinance also issued a warning to users running Spot Trading Bots on the affected pairs. Bot services linked to these pairs will also stop operating on July 17 at 03:00 UTC.The exchange advised users to update or cancel their bots before the deadline to avoid potential losses. A grid bot or DCA bot left running could create unexpected risks as liquidity narrows around the delisting period.Binance regularly removes low-volume pairsBinance carries out similar trading pair cleanups throughout the year. Trading volume, liquidity depth, project development and communication with project teams are among the criteria the exchange has frequently highlighted in previous announcements.Small-cap tokens and assets with declining trading activity are generally more likely to be affected. Major pairs such as BTC/USDT or ETH/USDT are rarely included in these removal announcements.The four affected projects operate in different areas of the crypto industry. Golem is a network that allows users to rent distributed computing power. Kyber Network Crystal is the native asset of a decentralized liquidity protocol. Ontology focuses on digital identity and data infrastructure, while Xai is a gaming-focused Layer 2 network.Despite their different use cases, the projects share one common feature: relatively limited spot trading activity in the affected pairs.Users with open orders or exposure to any of the four pairs should review their accounts before July 17. Pending limit orders are generally cancelled automatically when a pair is removed, while token balances remain unaffected.Based on Binance’s previous practices, similar announcements are usually published several days before trading ends. This gives users a limited but generally sufficient period to close positions or move their assets to another available trading pair.
Major Partnership in Japan: SBI and Solana Join Forces
Japanese financial giant SBI Holdings has formed a strategic partnership with the Solana Foundation to build a Japan-based onchain financial market. Under the agreement, the Solana Foundation will acquire a stake in SBI’s blockchain subsidiary, SBI R3 Japan, directly aligning the interests of the two parties under the same structure.According to an announcement released by the company on Monday, SBI R3 Japan plans to change its name to SBI Solana Global. The new company will continue its growth strategy with SBI Holdings and Sumitomo Mitsui Financial Group as shareholders. The involvement of two major financial groups gives the initiative considerable weight in terms of both capital and institutional credibility.The company’s priorities include issuing and distributing stablecoins, particularly the group’s yen-denominated stablecoin JPYSC. It also plans to structure, tokenize and distribute assets such as corporate bonds, commercial paper, investment funds and real estate.The company will also work on cross-border payment infrastructure. This initiative stands out as an attempt to accelerate trade flows, particularly within Asia.The new venture will provide onchain financial services for institutional investors and develop payment infrastructure for artificial intelligence agents. The latter is especially notable. Building a system in which AI agents can independently make payments remains an area that only a small number of companies currently take seriously.All products will operate on the Solana blockchain.The second major move following JPYSCThe announcement came only a few weeks after SBI launched JPYSC, described as Japan’s first yen-denominated stablecoin backed by a trust bank.On the same day, the group announced that applications would open on July 16 for a 12-week product offering an annual return of 3% on JPYSC deposits through SBI VC Trade. The product indicates that SBI is attempting to position JPYSC as more than a payment instrument, turning it into an investment product capable of generating yield.SBI’s recent expansion has continued at a rapid pace. Last week, the company became the sole investor in Gauntlet’s $125 million Series C funding round. During the same week, it also single-handedly funded EDX Markets’ $76 million Series C round.The fact that both investments occurred within the same week, with SBI acting as the only investor in each deal, highlights both the group’s financial strength and its confidence in crypto infrastructure.In June, SBI also acquired Japanese cryptocurrency exchange Bitbank for approximately $289 million. The acquisition gave the group a direct presence in the retail crypto trading market.Taken together, SBI’s intentions are becoming clearer. The group does not want to remain an investor that simply provides capital to crypto companies. It aims to become a major operator controlling tokenization and stablecoin infrastructure.Bitbank covers the retail market, while Gauntlet and EDX Markets strengthen the infrastructure side. SBI Solana Global completes the picture by establishing a presence in institutional onchain finance.From the Solana Foundation’s perspective, the partnership provides a direct route into Japan, a market with a relatively mature regulatory framework, at an institutional level.Japan’s decision to move relatively early on cryptocurrency regulation also makes the partnership with an established financial group such as SBI a strategic gain for the broader Solana ecosystem.At the time of writing, Solana’s SOL token was trading at around $76.

What Is Zerobase (ZBT)?
Some blockchain transactions can only be verified when the underlying data is made publicly available. Zerobase aims to reduce this requirement by combining zero-knowledge proofs with trusted execution environments; sensitive calculations are performed off-chain while their results can still be verified on-chain. ZBT, the project’s native utility token, is used for proof generation, node incentives and certain governance processes within the ecosystem.The Definition and Origins of ZerobaseZerobase, officially written as ZEROBASE in the project’s documents, is a cryptographic computing network focused on producing real-time zero-knowledge proofs. The project aims to make the results of off-chain calculations verifiable, particularly when the data involved needs to remain private.At the core of Zerobase is a proof-generation network known as a “prover network.” This network performs calculations on behalf of users or applications and then generates cryptographic proofs showing that the operation was completed according to predefined rules.ZBT was designed as the utility token of this infrastructure. It can be used to pay for proof-generation services, reward node participants, access certain products and participate in governance processes related to network parameters.Holding ZBT does not provide ownership or revenue rights in the company developing Zerobase. The project’s official economic model specifically states that the token does not represent equity, debt, dividend rights or a direct claim on project revenue.Which Networks Does Zerobase Operate On?Zerobase does not operate its own independent layer-1 or layer-2 blockchain. Proof generation and some calculations take place off-chain, while token transactions, staking contracts and proof-verification processes connect to Ethereum and other EVM-compatible networks.ZBT primarily uses the ERC-20 token standard on Ethereum. Zerobase’s MiCA-compliant technical document also states that the token is compatible with EVM networks such as BNB Smart Chain and Polygon.The token contract is also based on LayerZero’s Omnichain Fungible Token standard. This structure allows ZBT to move between supported networks while aiming to coordinate the total supply across different blockchains.Various exchange-listing announcements have shown support for both Ethereum ERC-20 and BNB Smart Chain BEP-20 deposits. Some exchanges, however, only accept deposits through Ethereum. Users should therefore check which network an exchange supports before transferring ZBT.The Purpose of ZK Proofs and TEE InfrastructureA zero-knowledge proof allows someone to prove that a particular statement is true without revealing the underlying information. For example, the risk level of a trading strategy can be verified as remaining within a defined range without disclosing every detail of that strategy.Although this approach improves privacy, generating proofs can require significant computing power. Zerobase uses Trusted Execution Environments, or TEEs, to speed up this process.A TEE creates an isolated workspace at the hardware level for data used during a calculation. According to the project’s technical documents, sensitive data is processed inside this environment, preventing node operators from directly accessing the raw inputs.Once the calculation is complete, a zero-knowledge proof is generated for the result. This proof is submitted to smart contracts on the blockchain, allowing users to verify whether the calculation followed the required rules without seeing all of the underlying data.The Zerobase architecture relies on three main layers. The TEE layer carries out calculations privately, the ZKP layer converts the result into a proof and Proof Mesh aims to establish a standard connection between different proof systems and applications.Proof Mesh provides a shared interface for formatting, combining and reusing proofs across different applications.The History and Ecosystem of ZerobaseAccording to Zerobase’s official materials, the project emerged in March 2024 from cryptography work conducted within Salus Security. The team had previously completed various assignments for Privacy and Scaling Explorations, a group connected to the Ethereum Foundation’s cryptography research.As demand for proof-generation services increased, the work developed into an independent project. At this stage, Zerobase positioned itself as a fast, decentralized and compliance-oriented ZK proof network.Vortex Tech Ltd. is identified as the token issuer and the legal entity behind the network. The company was incorporated in the Cayman Islands on July 18, 2024.Zerobase’s official MiCA document lists Xueyan Tang as the company’s CEO, Koppany Smith as its COO and Li Chen as its CMO. In other official project materials, Xueyan Tang is introduced as Mirror Tang and serves as one of the most visible public representatives of Zerobase.Mirror Tang describes herself as a cryptography professor at Shanghai Jiao Tong University. However, project documents do not present Zerobase as a company founded by a single individual. Instead, it is described as a team-based project that developed out of Salus Security.Zerobase announced a $5 million funding round in October 2024. Official documents list Binance Labs, which was later renamed YZi Labs, Lightspeed Faction, dao5 and Matrix Partners among the project’s backers.According to the MiCA document, the project raised approximately another $1 million in April 2025 through a funding round aimed at community members and key opinion leaders. The document states that the team had 26 full-time employees as of the final quarter of 2025, although this figure may have changed since then.ZBT Launch and Exchange ListingsBefore ZBT entered the market, a Pre-TGE sale was held through Binance Wallet. According to the official document, the subscription period took place on September 24, 2025, with 10 million ZBT allocated to the sale at a price of 0.02 USDT per token.This amount represented 1 percent of the total supply. Tokens purchased during the sale could not be transferred until the token generation event scheduled for October 17, 2025.ZBT completed its Token Generation Event on October 17, 2025. On the same day, Binance listed ZBT as the 54th project in its HODLer Airdrops program and opened trading pairs against USDT, USDC, BNB, FDUSD and TRY.According to Binance Research, ZBT’s initial circulating supply at the time of listing was approximately 220 million tokens. A total of 30 million ZBT, equivalent to 3 percent of the total supply, was allocated to the HODLer Airdrops program.During the same period, the token also began trading on platforms including Kraken, KuCoin, Bybit, Bitget, OKX and Gate. Upbit opened KRW, BTC and USDT trading pairs for ZBT, while Kraken launched spot trading on October 17, 2025.The large number of listings improved the token’s accessibility. However, being listed on major exchanges does not guarantee a project’s technical success, adoption rate or future price performance.Products, Partnerships and Current StatusZerobase is not only developing a general-purpose proof-generation network. The project also aims to reach the finance, identity-verification and computing sectors through different products built on the same infrastructure.zkStaking is introduced as a product in which users deposit stablecoins and returns are generated through off-chain strategies. The goal is to verify yield and risk data through zero-knowledge proofs even when the full details of the strategies are not disclosed.ProofYield focuses on measuring off-chain resources such as bandwidth and computing capacity. Participants can prove cryptographically that they supplied resources and may receive ZBT rewards according to the protocol’s conditions.zkLogin aims to allow users to access specific accounts or services without directly sharing their identity information. The project lists gaming accounts, social platforms, voting systems and educational records among its potential use cases.The official website also features other products, including zkDarkpool, zkFi and zkCEX. zkDarkpool focuses on private and compliance-oriented trading environments, zkFi targets stablecoin staking strategies and zkCEX focuses on verifiable staking models connecting centralized and decentralized finance.As of July 2026, the ZBT coin price was trading at around $0.12. How Does the ZBT Token Work?One of ZBT’s main use cases is providing access to cryptographic services on Zerobase. Developers can use the token to generate proofs or query results through Proof Mesh.The Zerobase network includes two main types of nodes: HUB Nodes and Proving Nodes. HUB Nodes direct users’ proof requests to suitable Proving Nodes, help distribute network traffic and provide unused bandwidth to the system.Operating a HUB Node does not require collateral. Rewards are distributed in ZBT based on factors such as routing performance, uptime and the amount of traffic contributed to the network.Proving Nodes handle the computationally intensive side of proof generation. These nodes execute calculations inside TEEs and generate zero-knowledge proofs.According to the official economic model, Proving Node operators must provide at least $1 million worth of stablecoin collateral. Rewards may be paid in ZBT or stablecoins based on the number, quality and transaction volume of completed tasks.This high collateral requirement may encourage professional infrastructure providers to participate. However, it may also make it difficult for smaller participants to operate Proving Nodes, raising questions about how decentralized the network can become.ZBT can also be used in proposals and votes related to protocol parameters. These rights do not provide participation in company management or revenue sharing; they serve as a procedural governance mechanism for technical network decisions.ZBT Supply and Token DistributionZBT has a maximum supply of 1 billion tokens. The official economic model describes the supply as fixed and non-inflationary.A total of 43.75 percent of the supply was allocated to node staking rewards. This represents the largest portion of the ZBT economy, with the tokens scheduled to enter circulation through a linear distribution program beginning one month after the TGE.The team and advisers received an allocation of 20 percent. These tokens are subject to a one-year lock-up period, followed by a 48-month linear vesting schedule. Investor allocations account for 11.25 percent of the total supply. These tokens are also subject to a one-year lock-up, followed by a 24-month linear vesting schedule.The ecosystem fund received 15 percent, airdrops and early mining received 8 percent and initial liquidity received 2 percent. The ecosystem fund and liquidity allocations were reported to have been fully unlocked at the TGE.A total of 5 percent of the airdrop and early-mining allocation entered circulation at the TGE. A separate distribution schedule was announced for the remaining 3 percent, which was released over the following month.Node rewards and tokens allocated to the team and investors will gradually increase the circulating supply. If demand does not grow at the same pace, these unlocks may create selling pressure in the market.Zerobase’s economic model page states that a buyback-and-burn mechanism could be introduced through a DAO decision. However, the MiCA document states that there is no active supply-adjustment mechanism and that the protocol does not allow minting or burning outside the vesting program.These two statements do not fully align. It is therefore more cautious to view token burning as a potential economic mechanism that could be proposed through governance in the future rather than an active and confirmed feature of ZBT.Multichain Structure and Security AuditsThe ZBT contract uses the ERC-20 standard and LayerZero’s OFT infrastructure. Although separate contracts may exist on supported chains, the cross-chain messaging system helps maintain the total token supply.The Zerobase token contract was reviewed by OpenZeppelin in August 2025. The audit did not identify any critical, high-severity or medium-severity vulnerabilities. It reported three low-severity findings along with several technical notes.A total of 13 issues were recorded during the audit. Most were resolved, while some were only partially addressed. The report covered areas such as testing coverage, deployment scripts, administrative privileges and cross-chain configuration.The administrator address in the contract can control LayerZero connections and certain administrator-only functions. The project stated that this address would be configured as a multisignature wallet.According to the MiCA document, the zkStaking contracts were audited by PeckShield and Salus Security, while the ZBT contract was reviewed by OpenZeppelin and Salus Security. The document states that no critical vulnerabilities were identified.Smart contract audits may help reduce risk, but they do not guarantee that every vulnerability has been discovered. Zerobase also depends on TEE hardware, off-chain servers, EVM networks and LayerZero’s messaging infrastructure, meaning that security assessments should not be limited to the ZBT contract alone.Why Is Zerobase Important?Blockchains provide transparent records, but commercial strategies, customer information and institutional calculations cannot always be conducted in public. In fully off-chain systems, users must trust the service provider to calculate results correctly.Zerobase aims to connect these two environments. Sensitive calculations are performed privately inside a TEE, while the result can be verified on-chain through a zero-knowledge proof.This model may be particularly useful for algorithmic trading strategies. A fund could prove information such as its leverage ratio, risk range or compliance with specific rules without disclosing its trading model and positions.Similar methods could also be used to verify artificial intelligence outputs, perform calculations on private data, provide authorization without revealing identity information and measure bandwidth contributions.Zerobase’s success will depend on whether these use cases generate real demand for proofs. Technical capability alone will not be enough; developers need to integrate the infrastructure, and users must choose the network over traditional alternatives.Zerobase’s Position in the EcosystemZerobase focuses on a different area from blockchain projects developing ZK rollups. Instead of creating a new general-purpose blockchain, the project aims to provide proof-generation and verifiable off-chain computing services to other applications.For this reason, the project is close to a “proof as a service” model. Applications can use Zerobase’s node network, circuit templates and APIs without building their own extensive proof infrastructure.The Proof Mesh layer aims to simplify integration by standardizing different types of proofs. Proof aggregation, recursive proofs and proof transfer between different protocols are among the layer’s objectives.Zerobase also combines ZK infrastructure with staking and yield products. This approach aims to create utility for the token beyond technical proof fees by incorporating it into user-facing financial products.However, the ZK proof market is highly competitive. Specialized prover networks, rollup teams, hardware-acceleration projects and centralized cloud providers all offer different solutions for the same computing demand.Zerobase’s combination of TEEs, zero-knowledge proofs and a multichain token economy may help differentiate the project. Long-term competitiveness, however, will depend on measurable factors such as proof-generation cost, speed, uptime, developer experience and real customer usage.Technical, Economic and Market RisksZBT is a crypto asset exposed to high volatility. Its price may experience sharp movements due to market sentiment, exchange liquidity, broader crypto trends, token unlocks and demand for Zerobase products.A significant portion of the total supply was allocated to node rewards, the team and investors. Long-term vesting schedules may reduce sudden supply increases, but they still gradually increase the number of tokens in circulation.On the technical side, TEE systems depend on hardware manufacturers and remote-attestation mechanisms. Hardware vulnerabilities, configuration errors or new attack methods targeting trusted execution environments could affect the system’s privacy assumptions.The high stablecoin collateral requirement for Proving Nodes creates another risk. It may allow a small number of large operators to gain significant influence over the network and limit the project’s decentralization goals.Products such as zkStaking use off-chain yield strategies. This model does not eliminate conventional DeFi risks such as strategy failure, liquidity problems, counterparty risk, stablecoin depegging or smart contract vulnerabilities.The differences between the project’s economic documents regarding token burning should also be monitored. Important changes to token economics need to be verified through official governance decisions, updated smart contracts and newly published documents.The regulatory environment represents another source of uncertainty. Privacy technologies, crypto-asset services and yield-generating products may be subject to different rules in different jurisdictions, and some features may be restricted by region.Zerobase’s listings on major exchanges improve access to liquidity. However, these listings do not guarantee technical adoption, sustainable revenue or the preservation of the token’s value.Frequently Asked QuestionsBelow are answers to some frequently asked questions about Zerobase.What is Zerobase and when was it launched?: Zerobase is a cryptographic infrastructure network that uses zero-knowledge proofs and trusted execution environments to make off-chain calculations verifiable. The project emerged from Salus Security’s cryptography work in March 2024, while the ZBT Token Generation Event and exchange listings took place on October 17, 2025.What is the ZBT token used for?: ZBT is used to pay for proof-generation services, reward node participants, access products such as ProofYield and zkStaking and participate in certain protocol-governance processes. The token does not provide ownership or profit-sharing rights in the company developing Zerobase.Which network does Zerobase operate on?: Zerobase does not have its own blockchain. ZBT was issued as an ERC-20 token on Ethereum, while the project uses a multichain structure designed to work with BNB Smart Chain, Polygon and other EVM-compatible networks.Who founded Zerobase?: Official sources identify Xueyan Tang, also known as Mirror Tang, as Zerobase’s CEO and project leader. However, Zerobase is described in its official history as an independent project that emerged from the cryptography team within Salus Security rather than a company founded by a single person.What is the ZBT supply? ZBT has a fixed maximum supply of 1 billion tokens. The circulating supply changes over time according to vesting schedules, node rewards and previously announced distribution programs. Figures published by data providers may differ depending on their calculation and update methods.Follow the JR Crypto Guide series for the latest information about Zerobase and new projects across the crypto ecosystem.

Bitcoin Holds $64,400: Is This the Time Resistance Finally Breaks?
The cryptocurrency market saw a second wave of gains on Friday. Bitcoin has climbed 2% since midnight, reaching $64,400 and returning to the same level it failed to break on Monday. If this resistance gives way, attention will shift to the June 15 high of $67,250. Ethereum outperformed Bitcoin this time. It rose 2.6% to $1,790 and is attempting to break the lower highs and lower lows pattern that has been in place for weeks.There was also notable activity across altcoins ahead of the weekend, despite weekends typically being associated with lower liquidity and fewer sharp price moves. Zcash and Aave both gained around 5%. Market appetite, which had been subdued for months, appears to be gradually returning to more speculative bets.Meanwhile, crypto diverged from U.S. equities. S&P 500 futures slipped 0.1%, while Nasdaq 100 futures fell 0.4%.What the derivatives market is signalingSpeculative trading activity is easing in derivatives markets, while longer-term positioning continues to build. Twenty-four-hour trading volume fell 7% to $140 billion, while open interest increased 3% to $110.52 billion. That suggests the current recovery is being driven by investors holding positions rather than short-term traders moving in and out of the market.Across major exchanges, total open interest in Bitcoin USD- and USDT-margined futures rose from 262,000 BTC to 272,000 BTC as the spot price moved above $64,000. Combined with positive funding rates and a positive cumulative volume delta, the data suggests bullish positioning is strengthening.Ethereum has yet to see the same trend. Futures open interest remains largely unchanged, indicating traders are still hesitant to increase leverage.Across the broader market, most tokens are showing a positive cumulative volume delta, meaning buyers are executing market orders instead of waiting with passive limit orders. That is generally viewed as a supportive signal for continued price appreciation.Implied volatility indexes tied to both Bitcoin and Ethereum continue to decline, a pattern often associated with steady bullish markets. Bitcoin’s volatility index, BVIV, fell to 38.5 on Friday, its lowest level since June 6.On Deribit, demand for put options is weakening as rising prices reduce downside concerns. The most actively traded contracts include $62,000, $65,000, and $67,000 call options, along with a $56,000 put option. Call options are typically favored by traders expecting further upside.Tokens in focusLighter remains one of the standout tokens of recent weeks. The token gained more than 5% on Friday and has rallied over 200% since May 16. Lighter is a decentralized derivatives exchange that recently signed a partnership with Robinhood Chain, aiming to bring its product to the brokerage's 28 million customers.Rival Hyperliquid has been one of the biggest beneficiaries of the perpetual futures trading boom in 2026. After reaching a record high of $76 last month and pulling back, the HYPE token climbed 2.8% on Friday to $68. The series of higher lows suggests buyers remain firmly in control.AI-related tokens, on the other hand, have lagged behind after their strong performance during the first half of the year. Bittensor traded flat on Friday even as the broader crypto market moved higher.

Binance Futures Lists Four New Stock Perpetual Contracts
Binance Futures is expanding its range of trading products by introducing four new perpetual futures contracts. The GEVUSDT, VRTUSDT, SNOWUSDT, and APPUSDT contracts will go live sequentially on July 10.Four new contracts arrive on BinanceThe first contract, GEVUSDT, will begin trading at 08:30 UTC and will track the share price of GE Vernova (NYSE: GEV). Five minutes later, at 08:35 UTC, VRTUSDT will launch, following the stock price of data center infrastructure company Vertiv Holdings (NYSE: VRT). SNOWUSDT, based on the share price of cloud data company Snowflake (NYSE: SNOW), will go live at 08:40 UTC, while APPUSDT, tracking mobile advertising technology company AppLovin (Nasdaq: APP), will begin trading at 08:45 UTC. All four contracts have been listed with identical trading specifications. The tick size is set at 0.01, the minimum order quantity is 0.01 units, and the minimum notional value is fixed at $5. Traders will be able to use leverage of up to 25x, while funding fees will be calculated every eight hours. The funding rate cap and floor are set at 2%, the funding interest rate is zero, and the contracts will be available for trading 24/7. They will also support Multi-Assets Mode.Binance stated in its announcement that these four contracts are exempt from the funding interval adjustment rule (Rule 8.1). Under normal circumstances, if a contract's funding rate repeatedly reaches its upper or lower limit, the exchange automatically shortens the funding interval from eight hours to one hour. This automatic adjustment will not apply to GEVUSDT, VRTUSDT, SNOWUSDT, or APPUSDT.The exchange also noted that it may adjust funding fees, tick size, maximum leverage, initial margin, and maintenance margin requirements over time depending on market risk conditions. The announcement was published as a notice under Binance Exchange Rule 17, and Binance said that this notice will prevail in the event of any inconsistency.Synthetic stock contracts have become increasingly popular among traders seeking exposure to publicly listed companies through cryptocurrency exchanges. Companies such as GE Vernova and Vertiv have attracted strong investor interest in recent months due to growing discussions around rising electricity demand driven by artificial intelligence investments. Snowflake and AppLovin have also remained closely watched in the cloud computing and advertising technology sectors.Binance's funding rate mechanism is designed to keep the price difference between the crypto-based perpetual contract and its underlying stock within a controlled range. However, exempting these contracts from Rule 8.1 means the funding interval will remain fixed at eight hours even if funding rates stay at their ceiling or floor for an extended period. As a result, traders holding heavily crowded long or short positions could face elevated funding costs for longer than they would under the standard adjustment mechanism.With leverage of up to 25x available, even relatively small price movements can have a significant impact on positions. Traders are advised to carefully review margin requirements and funding rate conditions before opening positions.
Binance Futures to Launch 7 New Futures Contracts
Binance Futures is launching seven new perpetual futures contracts. The contracts will go live on July 9, 2026, starting at 17:00 Türkiye time, with each contract opening at five-minute intervals.The list is as follows: BOTUSDT (RoboStrategy Inc.), WENUSDT (Wendy’s Company), INTWUSDT (GraniteShares 2x Long INTC Daily ETF), SNXXUSDT (Tradr 2X Long SNDK Daily ETF), XBIUSDT (SPDR S&P Biotech ETF), BNCUSDT (CEA Industries Inc.) and FWDIUSDT (Forward Industries Inc.). The opening times are 17:00, 17:05, 17:10, 17:15, 17:20, 17:25 and 17:30 Türkiye time, respectively.Some of the contracts directly track stock prices: BOT, WEN, XBI, BNC and FWDI. Others are based on leveraged ETFs. INTWUSDT tracks the GraniteShares ETF that provides 2x daily long exposure to Intel shares. SNXXUSDT is based on a Tradr product that offers similar 2x leveraged exposure to Sandisk shares. XBIUSDT is built on the SPDR ETF tracking the biotechnology segment of the S&P Total Market Index, meaning it represents a sector-wide basket rather than a single company.The other names on the list also represent different sectors. CEA Industries is a small-cap industrial company operating in compressed air and gas technologies. Forward Industries is known for carrying solutions and accessory manufacturing. RoboStrategy is positioned as a robotics and automation-themed investment vehicle. The addition of niche-sector companies alongside more familiar names such as Wendy’s and XBI shows that Binance is not limiting its futures product range to large companies only.All contracts use USDT as the margin asset, with a minimum order size of $5. The tick size is 0.01 for BOT, WEN, INTW, SNXX and XBI, while it is 0.001 for BNC and FWDI. Leverage goes up to 25x for the first five contracts, while BNC and FWDI are limited to 10x. This difference is likely related to the trading volume and price volatility of the two assets. Binance generally sets more cautious leverage caps for assets with relatively lower liquidity or higher volatility.The funding rate is calculated every eight hours and has a cap of plus or minus 2%. In perpetual contracts, the funding rate is a fee exchanged between long and short positions to keep the futures price close to the spot price. If the rate is positive, long position holders pay shorts. If it is negative, the opposite happens.Seven Contracts Exempt From Eight-Hour Funding Interval AdjustmentOne exception stands out. Binance normally shortens the eight-hour funding interval to one hour when the funding rate repeatedly hits the upper or lower cap. This mechanism is designed to curb excessive one-sided positioning. However, these seven contracts have been exempted from that rule, meaning the interval will remain fixed even under extreme funding conditions. In practice, this means that even if the market becomes heavily positioned in one direction, the funding cost will be calculated less frequently rather than every hour. This increases cost predictability for both long and short sides, while also allowing price deviations to last slightly longer.All contracts support multi-assets mode, meaning users can combine different collateral assets in a single margin pool. The contracts trade 24/7, just like other crypto futures products. This means users can open positions through these stock-linked contracts even when U.S. stock markets are closed.

Hyundai Tests Stablecoin Transfers With Tether and Avalanche
Hyundai Card has completed the first phase of a cross-border stablecoin remittance test carried out in cooperation with Tether and Avalanche. According to the announcement made on Thursday, the test was not conducted on paper. It involved a real money transfer between Hyundai Motor’s U.S. and Mexico units.Hyundai Motor America converted a $20,000 amount into USDT on the Avalanche network. The amount was then sent to the Mexico office and converted back into dollars there. The transaction took about seven minutes. The same transfer would take three to four hours if processed through traditional interbank channels.In traditional cross-border transfers, this delay is usually caused by the transaction passing through multiple intermediary banks. Each intermediary bank carries out its own control and settlement process, which extends the total transfer time. In a stablecoin-based transfer, the number of intermediaries decreases because the transaction takes place directly on the blockchain.Hyundai Card emphasized that the test was not a theoretical trial and was designed around a real settlement need between the company’s overseas units. The company handled the regulatory review, legal and tax checks, and the design of the remittance structure itself. Blockchain payment infrastructure company Axiym also took part in the process.Hyundai Card is one of South Korea’s leading credit card companies and operates under Hyundai Motor Group. The company’s test came at a time when Korean financial institutions are increasing their experiments with blockchain infrastructure. As a similar example, KB Card had also carried out a stablecoin-focused project with Avalanche in recent months.Second Test in EuropeHyundai will launch a second test between its European units later this month. Visa and USDC issuer Circle will also participate in this round.In the second test, real stablecoin transfers will be tested using various local currencies besides the dollar. The goal is to see how much cost advantage stablecoin-based money transfers can provide.While USDT and the Avalanche network were preferred in the first test, the involvement of Circle’s USDC and Visa’s payment infrastructure in the second phase shows that Hyundai Card wants to test different stablecoin and network combinations. This will allow the company to compare which infrastructure is more suitable at an institutional scale using its own data.Institutional stablecoin use has recently attracted growing interest in sectors such as automotive, retail and logistics. For companies, the main appeal is cost as much as speed. In the traditional banking system, commissions and foreign exchange costs can accumulate even in intra-group transfers. Hyundai Card’s two-phase test approach aims to measure these costs with concrete data.The company will decide in the coming period whether to open stablecoin-based payment infrastructure to broader use based on the results of the PoC process.
Coinbase Suspends Trading for 5 Altcoins, Adds 1 Altcoin to Its Roadmap
Coinbase announced that it will suspend trading for IDEX, Loopring (LRC), Omni Network (OMNI), Pirate Nation (PIRATE), and StaFi (FIS). On the same day, the exchange added the GRVT token to its listing roadmap.Countdown Begins for Five TokensCoinbase Markets will suspend spot trading for five assets on August 7, 2026, at around 2:00 p.m. ET. The exchange described the move as the result of a routine review, but did not specify which criteria each asset failed to meet. The market reaction was not evenly distributed. StaFi (FIS) and Pirate Nation (PIRATE) fell by more than 20%, while LRC and OMNI dropped between 10% and 15%. IDEX, however, did not see a sharp move. In low-volume tokens, it is not surprising that selling pressure is reflected in prices more quickly.There is also a separate detail on the Loopring side. Shortly before Coinbase’s announcement, the project shut down its own decentralized exchange, Loopring DEX, citing low usage. The two developments came back to back, and part of the decline in LRC likely stems from this.Coinbase stated that the suspended tokens will remain in users’ wallets and that withdrawals will not be blocked. Orders will move to limit-only mode: market orders will be disabled, users will only be able to place and cancel limit orders, and matching orders will still be executed.GRVT Added to the RoadmapOn the same day, Coinbase added the GRVT token to its official listing roadmap. GRVT is a hybrid derivatives exchange built on zkSync infrastructure, offering self-custody. It aims to combine the speed of a centralized exchange with the transparency of decentralized finance, while enabling trading without gas fees. The GRVT token was launched after the second season ended in late June 2026. Its total supply is fixed at 1 billion tokens, while the community and airdrop allocation was increased to 28%. The token unlocks membership benefits such as trading fee discounts, margin efficiency, and priority access to investment vaults.The platform’s growth figures also appear to support the listing decision. During its second season, GRVT’s total value locked (TVL) rose from $11.3 million to $107.1 million, marking an 847% increase. Open interest climbed to $484.1 million, while cumulative two-sided trading volume reached $393 billion. In January 2026, monthly trading volume rose to $51.6 billion, while the number of active users increased by 76% to more than 10,000. This picture summarizes GRVT’s transformation from a niche perp DEX into a platform that caught Coinbase’s attention.Being added to the roadmap does not automatically mean a listing. However, GROVE, which was added to the same list last week, gained more than 25% after spot trading opened. A similar scenario is expected for GRVT.Coinbase also shared GRVT’s Ethereum network (ERC-20) contract address: 0xAD29F2723fcdBcF665F210F25E06f97477e417cF.
What Is Turtle (TURTLE)?
DeFi yield opportunities often appear scattered, technical, and difficult to follow. Turtle aims to bring liquidity providers, protocols, and the distribution channels that deliver these opportunities to users under one structure. The TURTLE token is positioned as the crypto asset that plays a role in governance, incentives, and network participation within this ecosystem.Turtle’s Definition and OriginTurtle operates as a distribution protocol that connects DeFi yield opportunities with different platforms and users. In its official documentation, the project is described as a three-sided marketplace that matches yield opportunities with the wallets, exchanges, neobanks, and other platforms that distribute them. On the other side of this structure are protocols looking to attract liquidity.In this model, Turtle does not work merely like a yield dashboard. The protocol links which user provided liquidity to which opportunity through which distribution channel on-chain. This allows distributors that bring liquidity to earn revenue share, while protocols pay only for the liquidity that is actually provided.TURTLE is the token of the Turtle ecosystem. According to Binance Research, TURTLE is listed as an ERC-20 token that represents participation in Turtle Protocol and is used in the network’s governance and incentive mechanisms. The token appears to have been designed especially to support alignment between the protocol’s liquidity distribution network, the community, and stakeholders.Which network does it run on?The official contract page for TURTLE shares addresses on Ethereum, BNB Smart Chain, and Linea. The same page also includes addresses for sTURTLE, the staking contract, CCIP bridge pool, DAO multisig, and Governor. This shows that the token is handled together with multi-chain usage and governance infrastructure.The project’s launch purposeTurtle’s launch purpose is to make liquidity distribution in DeFi more traceable and more efficient. In traditional liquidity mining campaigns, protocols often allocate large incentive budgets. However, it is not always easy to measure whether this budget goes to lasting liquidity or to short-term yield-seeking capital.Turtle tries to solve this problem with an attribution model. When a user deposits into a vault, this transaction is recorded on-chain together with the identity of the distributor that referred the user. This allows the protocol to see the source of incoming liquidity; the distributor can also receive revenue share based on the TVL it brings.The project’s documents also emphasize that user assets are not held by Turtle. The user signs the transaction from their own wallet, the funds go to the selected vault contract, and Turtle does not provide custody during this process. This structure places the project closer to a distribution and coordination layer than to a centralized yield platform.Turtle’s History: Key MilestonesTurtle’s early phase took shape around a structure that connected liquidity providers with specific DeFi opportunities. According to the Binance Research roadmap, Turtle’s MVP launch began in the second quarter of 2024. During this period, the project moved forward with its dashboard and Deals Boost product in the first stage, called the “bootstrap phase.”At the center of this first model was the goal of attracting more efficient liquidity to protocols and offering better-structured opportunities to liquidity providers. Turtle aimed to make opportunities that large liquidity providers could access available to a broader user base. For this reason, the project is positioned differently from a classic DEX or lending protocol.By 2025, Turtle v1 and then the v2 process came to the forefront. According to Binance Research, the new dashboard, app, and brand design were introduced in the first half of 2025. In the second half of 2025, products such as the Leaderboard, Portfolio Page, Discovery Page, Earn Widget, Turtle API, and partner analytics were introduced for the first time within a broader structure.Listings and developmentsOne of the most visible developments on the TURTLE token side was Binance’s HODLer Airdrops announcement. In October 2025, Binance announced the HODLer Airdrops program for TURTLE and stated that 10 million TURTLE rewards, equal to 1% of the maximum total supply, had been allocated under this program.After the token entered the market, it began trading on different platforms such as Gate, KuCoin, Binance, MEXC, and Uniswap.The project also attracted attention on the funding side. It was announced that Turtle received an additional $5.5 million investment in October 2025, bringing its total funding to $11.7 million. The same announcement stated that Turtle had reached more than 358,000 connected wallets and over $5.5 billion in routed liquidity.Current statusToday, Turtle positions itself as an on-chain liquidity distribution infrastructure. On the official website, product-side features such as opportunity discovery, analysis, investing, monitoring, and position management stand out. The project aims not only to help users find DeFi opportunities, but also to follow risk and performance in a more organized way.As of July 2026, the TURTLE coin price is hovering around $0.03. How Does the TURTLE Token Work?The main use case of the TURTLE token is built around governance and ecosystem participation. According to the official governance documentation, users can stake TURTLE and receive sTURTLE. sTURTLE holders can either vote directly or delegate their voting power to another delegate.This structure shows that the token is designed not only as a market asset that can be bought and sold, but also as a tool that can play a role in protocol decisions. It is stated that issues such as treasury management, protocol direction, and integrations may be influenced through the governance process. However, the governance structure may take time to mature, and its practical impact depends on community participation.There is also an additional use case on the staking side. According to the official documentation, users can stake TURTLE and receive up to a 10x boost on the Turtle Shells leaderboard. This boost is applied linearly based on the ratio between the value of staked sTURTLE and the value of the user’s position in certain opportunities.The Turtle team also states that token use cases may expand in the future. In the documentation, broader access to liquidity opportunities, fee discounts, yield boost mechanisms, buyback or redistribution models, and advanced staking layers are listed among possible future use cases. These should not be read as currently guaranteed features, but as areas that may develop depending on governance and ecosystem decisions.Supply and token economyTURTLE’s maximum and total supply is announced as 1 billion tokens. Binance Research gives the initial circulating supply during the Binance listing process as 154.7 million TURTLE. This corresponds to 15.47% of the total supply.On the official tokenomics page, the supply distribution is divided into several main categories. Private rounds, meaning investor rounds, receive 27.50% of the supply; the airdrop receives 12.10%; and the team, advisors, and contributors receive 23.10%. Liquidity, market makers, and exchange reserves account for 8.00%, while the ecosystem and community category stands out as one of the largest allocations with 29.30%. On the vesting side, investor tokens have a 6-month cliff and a 36-month linear unlock. The team, advisors, and contributors have a 12-month cliff and again a 36-month linear vesting schedule. On the airdrop side, a claim and partial linear unlock mechanism is used. This structure makes two points important for investors. First, there is a significant gap between circulating supply and total supply. Second, future token unlocks may create pressure on the price. This situation is not unique to TURTLE; similar risks exist for many tokens that enter the market with a low circulating supply ratio.Network, transaction, and security structureTurtle’s security approach is divided into several layers. According to the official documentation, Turtle does not custody user assets, does not access private keys, and does not have the authority to move or freeze user funds. The user signs through the interface where the transaction is created, while the assets go directly to the selected vault contract.Turtle runs opportunities through a review process before adding them to its catalog. This review covers areas such as technical risk, smart contract risk, operational risk, and curator assessment. The project also states that featured vaults undergo independent solvency checks, while some smart contracts are audited by independent security firms.Still, these mechanisms do not completely remove risk. DeFi vaults, bridges, incentive campaigns, market volatility, and third-party protocols can carry different risks. Turtle mainly acts here as an infrastructure layer that reviews, distributes, and attributes opportunities. The selected vault’s own contracts and risk profile should also be assessed separately.Attracting liquidity in DeFi is an expensive and complex process. When a protocol launches a new product, starts an ecosystem campaign, or wants to grow TVL, it usually allocates an incentive budget. However, it is not easy to measure whether these incentives reach the right users, whether they create lasting liquidity, and which channel actually delivers results.This is where Turtle’s core problem area appears. The project makes the relationship between liquidity providers and protocols more data-driven. Recording which distributor each deposit came through helps measure campaign performance more transparently.This model also opens a new revenue area for distributors. Wallets, exchanges, or different platforms can offer DeFi yield opportunities to their own users through Turtle Earn integration. If those users provide liquidity to a vault, the distributor can earn revenue share based on the TVL it brings.Its place in the ecosystemTurtle does not directly fit into one of the classic protocol categories in DeFi. It is not a lending protocol, DEX, stablecoin project, or only a yield aggregator. It works more like a distribution and attribution infrastructure that organizes liquidity flow between these areas.From this perspective, Turtle’s place in the ecosystem can be summarized as a coordination layer between capital owners and protocols seeking capital. Protocols can create campaigns through Turtle, distribution partners can deliver these opportunities to their own users, and liquidity providers can access pre-reviewed vaults.The project’s official announcements refer to ecosystem campaigns such as Avalanche, Katana, Linea, and TAC. Binance Research also lists Avalanche, MetaMask, Binance, and more than 60 protocol integrations among business developments. These types of partnerships support Turtle’s goal of becoming an infrastructure that works not only for individual users, but also at the protocol and ecosystem level.Turtle’s Community and EcosystemOn its official website, Turtle lists Essi as Founder & CEO and Nick as Founder & CTO in the team section. The same page also includes different team members working across CMO, COO, business development, product, liquidity desk, and marketing roles. The press release also identifies Essi Lagevardi as CEO. Since Nick’s surname is not clearly stated on the official homepage, this guide uses only the naming provided on the official website. The team structure shows that Turtle is building not only a technical product, but also a model that grows through business development and liquidity relationships. This is because the project’s success does not depend only on contracts working properly. Agreements with protocols, integrations with distribution partners, and relationship management with liquidity providers also play important roles.On the investor side, Turtle has a fairly broad list of backers. The official website and press releases refer to SIG, Amber, Consensys, FalconX, GSR, Flowdesk, Theia, Trident Digital, and different crypto investors. This support shows that the project has gained visibility on the institutional and professional liquidity side; however, investor backing alone does not mean guaranteed success.Community and governanceOne of the most important community-side topics for TURTLE was the Genesis Airdrop process. According to the official documentation, airdrop eligibility was determined through wallets that made real and measurable contributions to the Turtle ecosystem. It was stated that Sybil and bot activity were filtered, while verification was carried out through on-chain data and partner payouts.The airdrop mechanism is not based only on passive NFT ownership. The documents state that users with an NFT or Discord role also had to make measurable contributions to the DAO. Some campaigns, leaderboard rankings, and referral activities were also included in the distribution scope.On the governance side, TURTLE holders stake their tokens and receive sTURTLE. To vote, sTURTLE must be delegated. The official documents also explain parameters such as proposal threshold, quorum, voting delay, and voting period. This structure shows that the Turtle DAO may gradually play a more visible role in protocol decisions.Partnerships and use casesTurtle’s partnerships are shaped around liquidity campaigns, ecosystem integrations, and distribution partnerships. The official press release highlights campaigns such as TAC, Linea Ignition, Katana, and Avalanche. These campaigns aim to show Turtle’s capacity to gather and direct liquidity around specific goals across different networks.Turtle Earn is one of the important products on the distribution side. Through this structure, wallets, exchanges, or other platforms can integrate Turtle opportunities into their own interfaces. Turtle API documentation also states that products such as Earn, Streams, and portfolio data can be used through a single REST API.On the use case side, Turtle’s focus stands out as DeFi yield, liquidity campaigns, vaults, incentive distribution, revenue share, and governance. The TURTLE token is associated with functions such as decision-making, staking, boost, and contribution incentives within this ecosystem. However, the impact of all these functions will become clearer over time depending on the protocol’s level of usage.Frequently Asked Questions (FAQ)Below, we have included some frequently asked questions and answers about Turtle:What is Turtle, and when did it launch?: Turtle is a liquidity distribution protocol that connects DeFi yield opportunities with liquidity providers and distribution channels. According to the Binance Research roadmap, Turtle’s MVP launch began in the second quarter of 2024. Throughout 2025, the project moved into a broader structure with products such as the dashboard, Earn, API, leaderboard, and partner analytics.What is the TURTLE token used for?: The TURTLE token is a crypto asset used for governance and participation within the Turtle ecosystem. Users can stake TURTLE to receive sTURTLE, delegate their voting power to themselves or another delegate, and participate in the governance process. The token is also associated with staking boosts and ecosystem incentives.Which network does Turtle run on?: According to the official contract page, the TURTLE token exists on Ethereum, BNB Smart Chain, and Linea. The same page also shares addresses for staking, the bridge pool, DAO multisig, and Governor contracts. Turtle’s product infrastructure aims to provide access to yield opportunities and vaults across different EVM networks.Who is the founder of Turtle?: On the official Turtle website, Essi is listed as Founder & CEO, while Nick is listed as Co-Founder & CTO. Turtle’s October 2025 press release states that the CEO is Essi Lagevardi. Since Nick’s surname is not clearly given on the official homepage, this information should not be presented as fully confirmed.What is the TURTLE supply?: TURTLE’s maximum and total supply is announced as 1 billion tokens. Binance Research gave the circulating supply at the time of listing as 154.7 million TURTLE. On the official token economy page, 27.50% of the supply is allocated to investor rounds, 12.10% to the airdrop, 23.10% to the team and contributors, 8.00% to liquidity and exchange reserves, and 29.30% to the ecosystem and community category.Is Turtle suitable for investment?: Turtle presents a notable model in the DeFi liquidity distribution field. However, TURTLE is a crypto asset with a low market capitalization, high volatility, and future token unlocks. For this reason, any investment decision should consider the price chart, supply unlocks, real usage, liquidity conditions, project revenues, and personal risk profile together. This guide is not investment advice.Follow the JR Kripto Guide series for the latest information about Turtle and new projects in the crypto ecosystem.

Vanguard, Managing $12 Trillion, Builds Crypto Department
Vanguard, the world’s second-largest asset manager, has started looking for an executive who will build its cryptocurrency strategy from the ground up. According to a job posting published on the company’s careers page on July 6, the role will be responsible for creating a digital asset roadmap for Vanguard’s personal wealth management clients.For the company, which manages a $12 trillion portfolio, this marks the first example of a senior-level appointment specifically focused on crypto. The posting was listed under job code 179858 and offers a hybrid working model across Vanguard’s Malvern, Dallas, Scottsdale and Charlotte offices. Executive Will Engage With RegulatorsThe person hired for the role will work as a senior subject matter expert on digital assets within Vanguard’s personal wealth division. The scope of responsibility will not be limited to product development. Risk management and communication with regulatory authorities will also be part of the job description. According to internal sources, the executive’s main goal will be to build a scalable, end-to-end strategy.The move stands in contrast to Vanguard’s previous stance on crypto. When spot Bitcoin ETFs launched in January 2024, the company did not allow these products to be traded on its own platform. For a long time, executives described crypto assets as speculative.Shift Began After New CEO Took OverThe picture changed in December 2025. Vanguard opened its platform to third-party crypto ETFs and mutual funds. The decision gave more than 50 million brokerage clients access to funds that include Bitcoin, Ethereum, XRP and Solana.Behind this shift was Salim Ramji, who became CEO in July 2024 and was the first person appointed to lead the company from outside Vanguard. Ramji previously ran BlackRock’s iShares unit, which launched the iShares Bitcoin Trust. That fund had reached nearly $54 billion in assets under management as of March 31. Vanguard also became the largest shareholder of Strategy, the biggest Bitcoin treasury company, last year.No Plan Yet for Its Own ETFStill, Vanguard has not yet filed for its own crypto ETF. The company’s published investment guidance continues to prioritize assets with transparent cash flows and offers crypto exposure only through third-party products, similar to gold. BlackRock and Fidelity, meanwhile, operate their own spot Bitcoin funds. Competition among issuers has pushed fee rates down to as low as 0.14%.Client demand is also supported by concrete data. U.S.-based spot Bitcoin ETFs reached $74.37 billion in net assets as of July 2. On the same day, the funds recorded $221.72 million in inflows after a 10-day outflow streak. At the time of writing, total net assets had risen to $77.32 billion.