
AVAX Technical Analysis
In the last quarter of 2025, the Avalanche network implemented a major update, improving speed and transaction costs. In addition, the search for institutional partnerships in strategic regions such as Abu Dhabi has come to the forefront. These developments show that AVAX has become attractive not only for crypto investors but also for institutional players. This expansion within the ecosystem forms a strong foundation that should be taken into account before technical analysis.
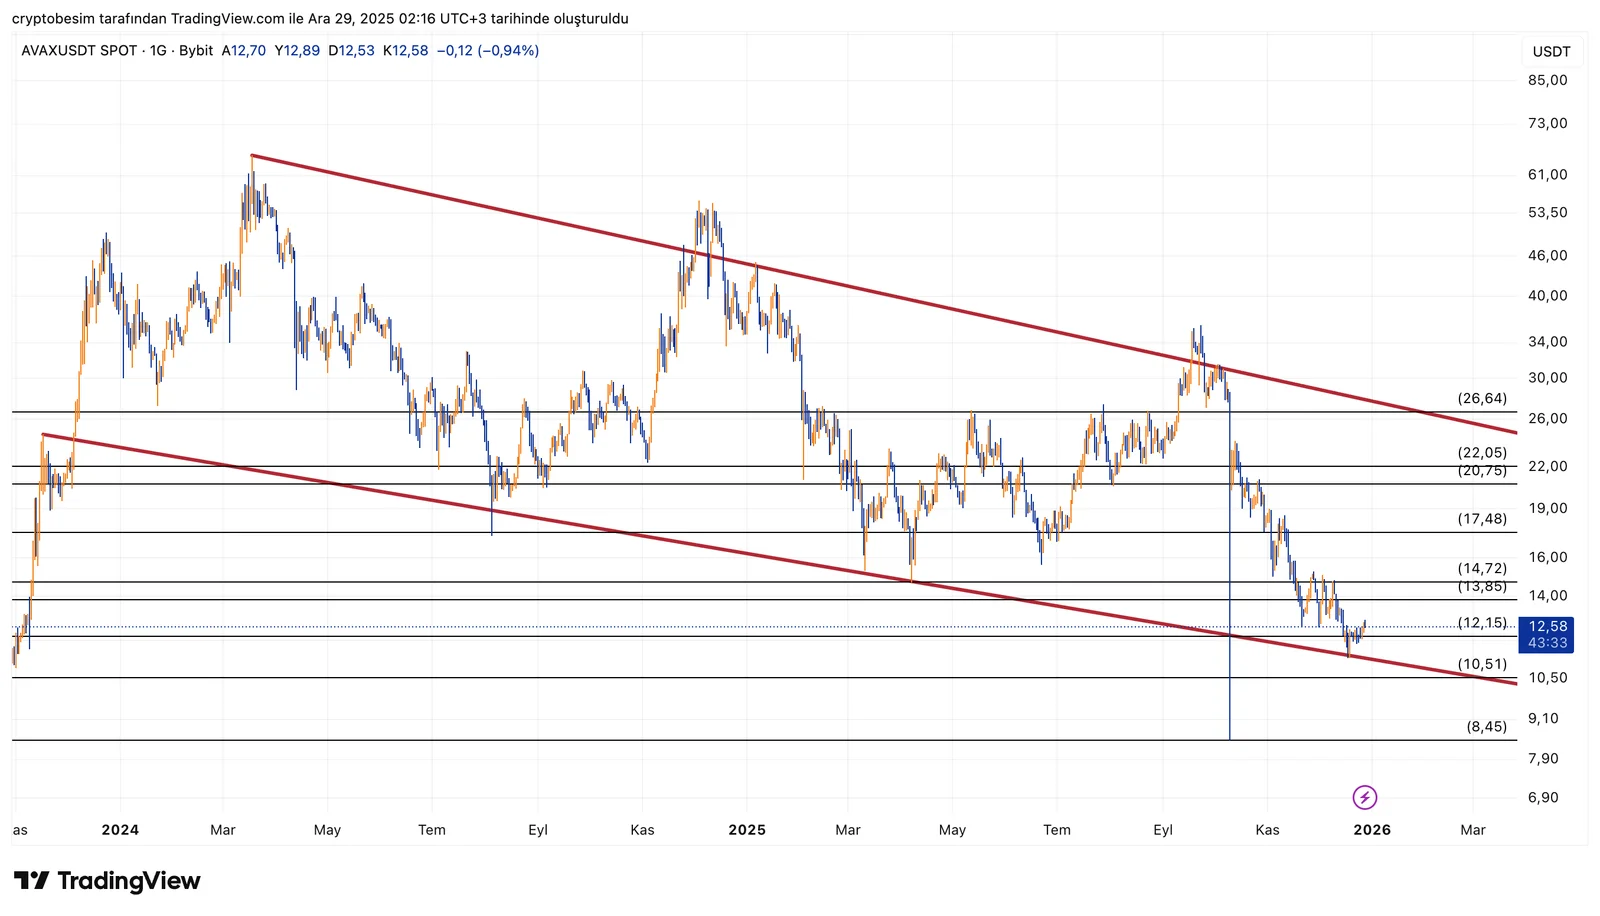
On the AVAX side, there has been a higher-timeframe descending channel structure in place since the beginning of 2024, and this structure has worked quite cleanly so far. At every recovery attempt, the price has faced selling at the upper band of the channel, and during every sharp decline, it has touched the lower band and taken a short breath. The current picture shows that this discipline has still not been broken.
The current price action is very close to the lower band of the channel. In such long-term channels, lower bands usually produce two different scenarios: either a strong reaction comes, or after a weak consolidation, a downward continuation is seen. AVAX is currently exactly at this decision point.
The critical levels seen on the chart are:
- 26.6 – 27.0: Upper band of the channel, main trend resistance
- 22.0 – 20.7: Mid-band and a support-resistance area that has worked frequently in the past
- 17.4 – 14.7: In-channel intermediate supports, regions where declines slowed down
- 12.1 – 10.5: Lower band of the channel, the current main defense line
- 8.4: Major support that will come into play if the lower band is lost
In the short and medium term, the scenario is progressing quite clearly. As long as the 10.5 – 12.1 band is preserved, AVAX is technically still within the channel, and a reaction attempt from this area would not be surprising. If such a reaction occurs, the first targets would naturally be 14.7, followed by the 17.4 band.
The truly critical threshold, as always, is the upper band of the channel. Without breaking above the 26 – 27 region, it is difficult to say that the long-term downtrend has ended. Every price action approaching this region is still an area where selling pressure comes into play.
In the downside scenario, the picture is harsher. Weekly/daily closes below 10.5 indicate that the lower band of this long-term channel has been lost and may accelerate the price toward the 8.4 level. This level represents the last strong support of the structure formed throughout 2024.
These analyses, which do not provide investment advice, focus on support and resistance levels that are thought to create short- and medium-term trading opportunities depending on market conditions. However, the responsibility for trading and risk management belongs entirely to the user. In addition, it is strongly recommended to use stop loss for the positions shared.


