
WLFI/USDT Technical Analysis
The circulating supply of the project’s stablecoin USD1 has exceeded 3 billion dollars. This shows that investor interest is increasing. On the other hand, a partnership was announced with MMA Inc, which operates in the combat sports sector. With this collaboration, WLFI is advancing its goal of bringing blockchain technology into real-world usage.
On the WLFI side, the price has been moving within a rising wedge for some time. Although the structure may look positive at first glance, such wedges technically function not as continuation patterns but as distribution formations. In other words, this is a structure where volume decreases on upward attempts rather than strengthening, preparing the ground for a downside breakout.
Currently, the price has slipped downward from the upper–middle region of the wedge. This tells us the following: buyers are reluctant to push higher, and the price is more focused on seeking balance.
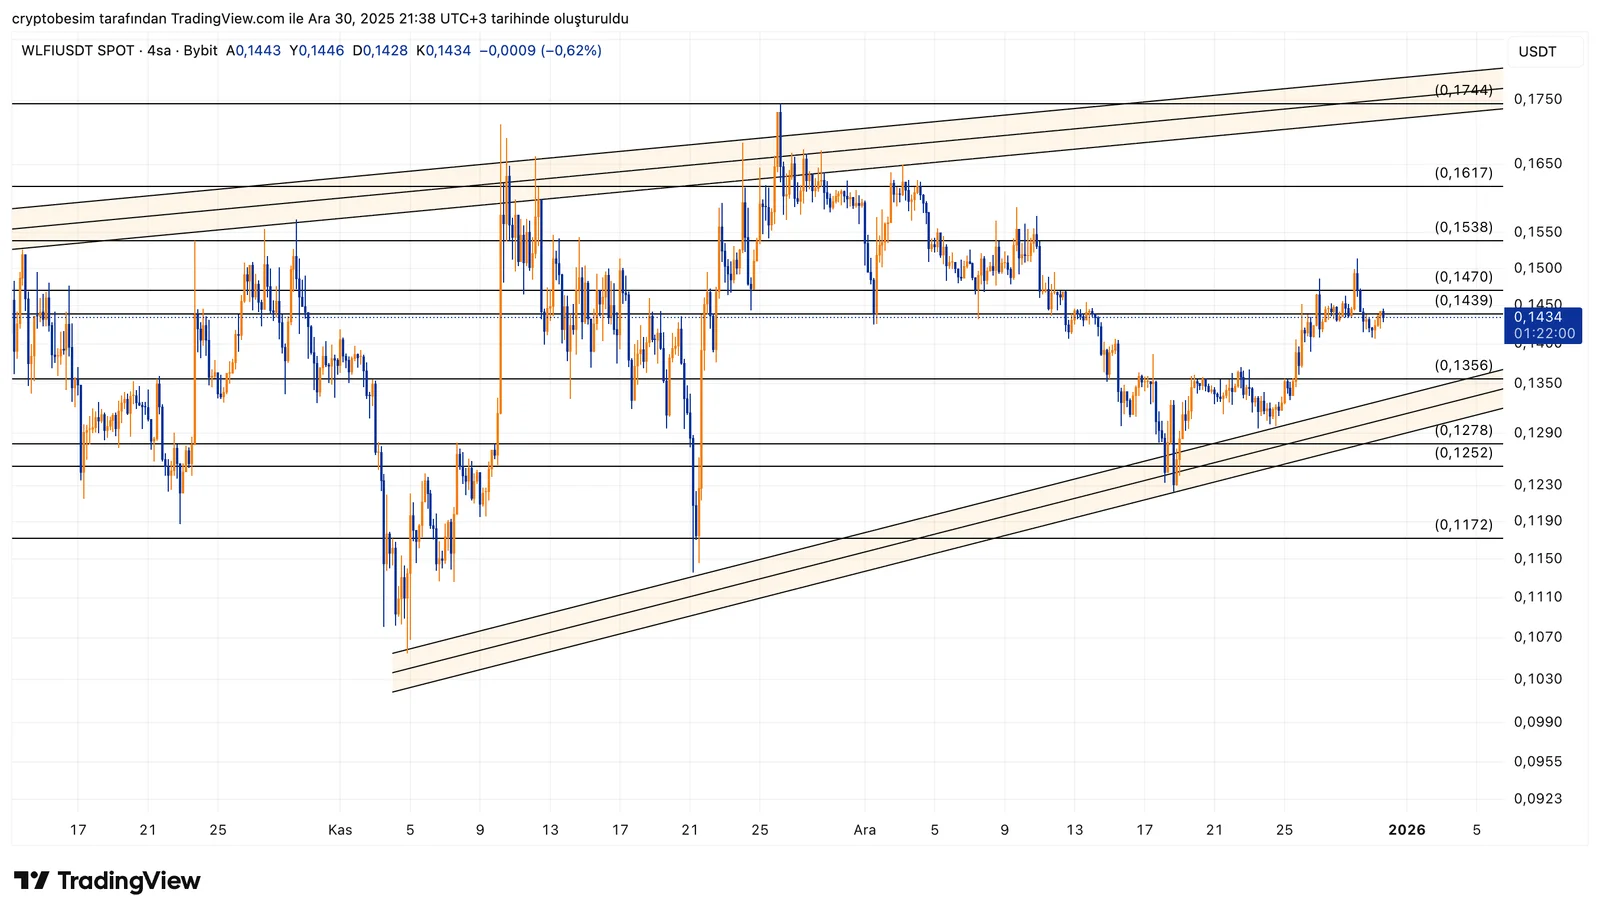
The levels seen on the chart are as follows:
- 0.147 – 0.153: Upper band of the wedge and the area where selling is concentrated
- 0.143 – 0.145: Short-term balance zone, the area where the price is currently trying to hold
- 0.135 – 0.128: Lower band of the wedge and the main support area
- 0.117 – 0.110: Lower support zone, the first stop after a breakdown
- 0.10: Exact target of the structure, the main target area in the downside scenario
In the short term, the critical point is the 0.135 – 0.128 band. As long as the price stays above this region, the rising wedge can still be considered technically intact, and a sideways–choppy structure may be observed. However, in such structures, the main move usually comes with the loss of the lower band.
If closes below 0.128 occur, the rising wedge resolves to the downside. In this scenario, it would not be surprising for the price to accelerate first toward 0.117 and then toward the 0.10 region. Especially in such breakouts, pullbacks tend to be short and weak.
In the upside scenario, the picture is more limited. Without sustained closes above 0.153, it is difficult to read this structure as a healthy uptrend. As long as that region is not surpassed, every rise still remains a reaction.
These analyses, which do not provide investment advice, focus on support and resistance levels that are thought to create short- and medium-term trading opportunities depending on market conditions. However, the responsibility for trading and risk management belongs entirely to the user. In addition, it is strongly recommended to use stop loss for the positions shared.


