
ZK/USDT Technical Analysis
Looking at the ZK chart, we can see that the price tested the $0.07353 level and then pulled back after encountering selling pressure.
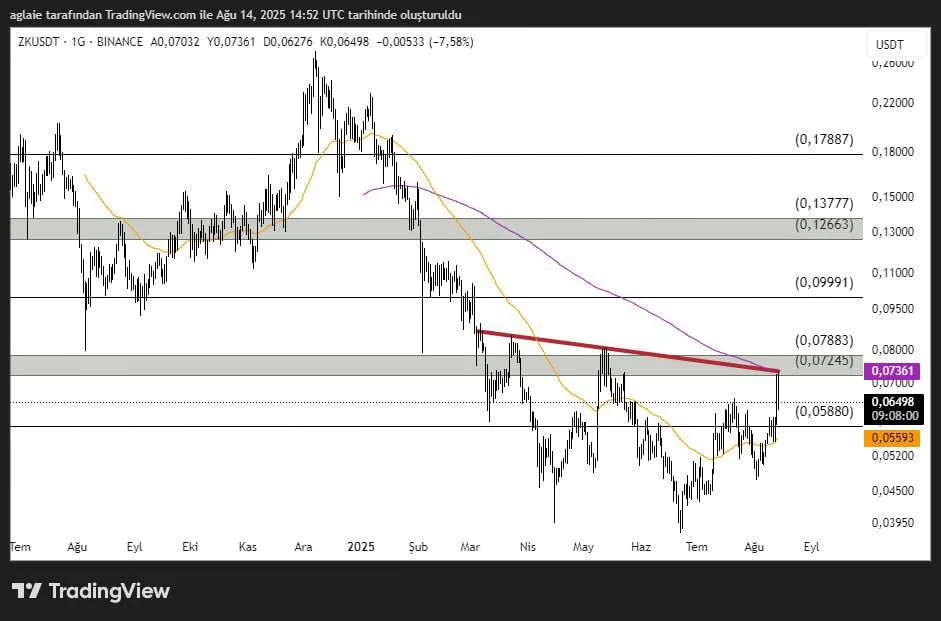
The $0.07245–$0.07883 range is an important resistance zone and holds critical significance as it intersects with the descending trendline. If the price breaks above this level and secures daily closes, it could have the potential to target the $0.09991 level, followed by the $0.1266–$0.1377 resistance zones.
In potential pullbacks, the $0.0588 level can be monitored as a zone where buyers recently stepped in and the price reacted upward.
These analyses do not constitute investment advice and focus on support and resistance levels that may present potential trading opportunities in the short and medium term, depending on market conditions. However, the responsibility for executing trades and managing risk lies entirely with the user. It is also strongly recommended to use stop-loss orders for any trades mentioned.


