
ETHFI/USDT Technical Analysis
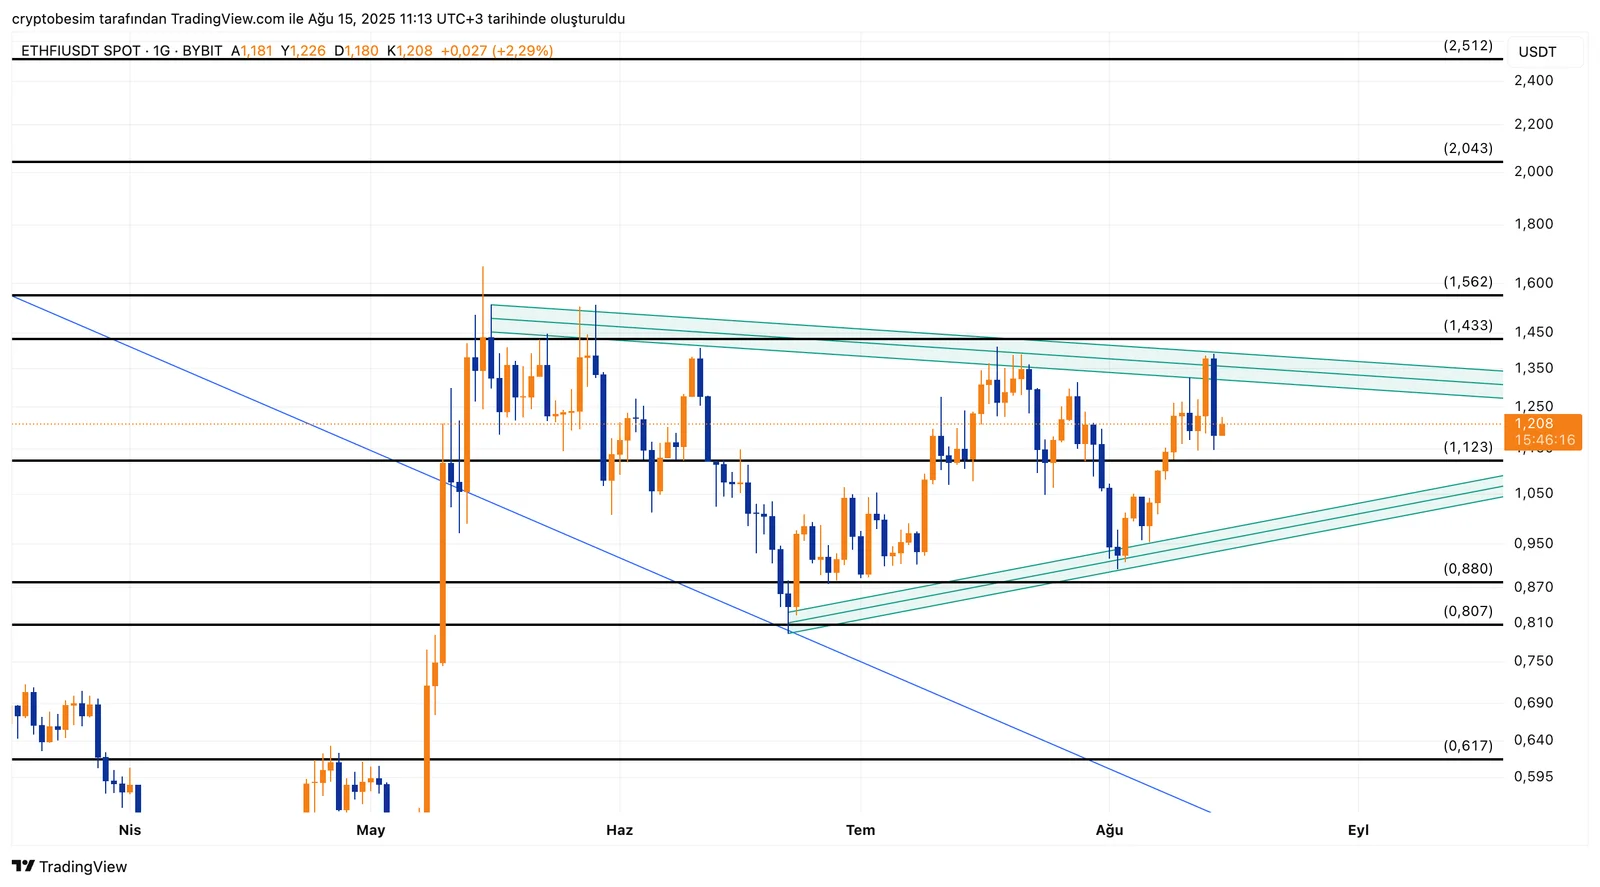
Looking at the ETHFI chart, a symmetrical triangle formation is immediately apparent. This pattern indicates growing price compression, signaling that a breakout is imminent and likely to trigger a sharp move in the breakout’s direction.
ETHFI, currently trading around $1.20, is located in the middle band of the triangle. The triangle's middle band support level of $1.12 is currently facing the price. If it falls below this level, the $0.95 trend support and the $0.88 horizontal support will come to the fore.
In bullish scenarios, the $1.35-$1.43 range is important both horizontally and as the upper band of the triangle. If this resistance area is broken, $1.56 and then $2.05 could become targets. An upward breakout of the triangle will also trigger volatility.
- In summary:
• The symmetrical triangle formation is active.
• Strong support at $1,123, and $0.95 and $0.88 below should be monitored.
• Strong resistance at the $1,350-$1,433 area.
• On an upward breakout, $1,562 → $2,043 → $2,512 can be targeted.
• On a downward breakout, $0.95 → $0.88 → $0.807 are prominent support levels.
These analyses do not constitute investment advice and focus on support and resistance levels that may present potential trading opportunities in the short and medium term, depending on market conditions. However, the responsibility for executing trades and managing risk lies entirely with the user. It is also strongly recommended to use stop-loss orders for any trades mentioned.


