Altcoin
This page lists the latest Altcoin news and market analysis. Browse articles, expert insights, and updates in this category on JrKripto. Stay informed with in-depth coverage of cryptocurrency trends and developments.
News
Altcoin News
Altcoin News
Browse all Altcoin related articles and news. The latest news, analysis, and insights on Altcoin.
ID Comment and Price Analysis - November 4, 2025
ID/USDT Technical AnalysisSPACE ID keeps making headlines with its Web3 domain and identity services such as “.bnb” and “.eth”. The project’s SDK has been integrated into over 330 applications, and compatibility with major exchange wallets is expanding. Thanks to these developments, the ID token is evolving beyond just “buying a domain name”; it’s becoming a core tool for managing digital identity. Falling Channel Structure Analyzing the chart on a daily basis, we see that the coin keeps moving within a descending channel, with the price currently testing the lower trendline. This area is technically critical, as it aligns with both trend support and previous reaction zones. If the price manages to hold above the channel’s lower boundary, the likelihood of a rebound move increases. On the upside, the first resistance stands at $0.1065, followed by $0.1153 and $0.1443, which represent key levels in the mid-to-upper range of the channel. A daily close above this zone could signal a broader recovery phase.On the other hand, the $0.083–$0.085 zone acts as the main support area. A breakdown below it would mean a channel breach, potentially pushing the price toward $0.0675. This makes the current area the last major trend defense zone for bulls.Support and Resistance LevelsSupports: 0.0960 – 0.0830 – 0.0675Resistances: 0.1065 – 0.1153 – 0.1443 – 0.1805These analyses, not offering any kind of investment advice, focus on support and resistance levels considered to offer trading opportunities in the short and medium term according to the market conditions. However, traders are responsible for their own actions and risk management. Moreover, it is highly recommended to use stop loss (SL) during trades.

UBS and Chainlink Complete First Tokenized Fund Transaction
UBS has taken a significant step in the digitization of investment funds. The bank completed its first on-chain fund redemption using Chainlink's Digital Transfer Agent (DTA) infrastructure. This transaction enabled the integration of the $100 trillion global funds industry with blockchain technology.Chainlink was used in UBS's transactionThe transaction was conducted using the "UBS USD Money Market Investment Fund Token (uMINT)," tokenized on Ethereum. This move by UBS was one of the first practical examples of how blockchain technology can be integrated with traditional finance. DigiFT, acting as the on-chain distributor, completed the redemption process using Chainlink's DTA standard. The transaction, initiated from UBS's own systems, was automatically executed thanks to the Chainlink infrastructure.Mike Dargan, UBS Group Technology Manager, stated that this development highlights the importance of smart contract-based infrastructures in the funds industry, saying, "This transaction is a milestone that enhances the investor experience and streamlines operational processes." Dargan emphasized that tokenization will increase efficiency in the financial sector and open up new possibilities for product design.UBS's platform, dubbed "Tokenize," aims to bridge the gap between digital assets and traditional financial systems. By automating critical functions such as order taking, execution, and reconciliation, the platform aims to reduce both operational complexity and processing time. This automation is expected to yield significant efficiencies, particularly in high-volume transactions such as money market funds.This development complements UBS's recent pilot project with Chainlink and SWIFT. In that project, banks' existing systems were connected to the blockchain infrastructure using Chainlink's Cross-Chain Interoperability Protocol (CCIP) and Runtime Environment technologies. This connection enabled fund transactions to be processed on-chain using the ISO 20022 message format.Given the size of the funds sector, the impact of this integration could be significant. The global funds industry, with a market capitalization exceeding $100 trillion, has long faced efficiency challenges due to bureaucracy and delays in transaction processing. This move by UBS demonstrates that tokenization can transform not only investment products but also back-end operations. Such on-chain transactions could pave the way for future innovations such as instant fund redemption, simplifying cross-border payments, and allowing investors to monitor their assets 24/7.

DeFi Platform Suffers $93 Million Loss: Transactions Halted
Stream Finance is facing a major crisis in the decentralized finance (DeFi) ecosystem. The company announced that it has suspended all deposits and withdrawals following a $93 million loss reported by an external fund manager. Following the incident, a comprehensive investigation led by international law firm Perkins Coie LLP was launched.In a statement on X (formerly Twitter), the Stream Finance team announced that the fund manager reported the loss on Sunday and that urgent measures were being taken to secure the assets. The company stated, “We are in the process of withdrawing all our liquid assets and expect this process to be completed shortly. We will not resume deposits and withdrawals until we fully understand the scope of the incident.” Perkins Coie LLP, which is conducting the investigation, has appointed attorneys Keith Miller and Joseph Cutler, known for their experience in the crypto and finance sectors. The firm has previously worked with fintech companies, providing consulting on compliance, cybersecurity, and internal audit processes. Stream Finance stated that this step demonstrates its commitment to the principles of “transparency and strong corporate governance.” The stablecoin price fell below $1.However, the impact of the incident wasn't limited to Stream Finance. The protocol's stablecoin, Staked Stream USD (xUSD), quickly lost its dollar peg. According to PeckShield data, xUSD fell to $0.51, breaking away from its $1 target. Analysts warn that this collapse could trigger a cascading wave of liquidations.Platforms using xUSD as collateral include major lending protocols such as Euler, Morpho, and Silo. The total amount of collateral tied to Stream Finance on these platforms is estimated to exceed $280 million in debt and loans. Pseudonymous analyst YAM emphasized that this figure only includes direct collateral; indirect exposures, particularly the complex credit loops established with derivatives like USD, are not taken into account.Stream Finance was previously a DeFi protocol known for its recursive looping, or repeating return models. This structure, which allowed users to earn higher interest by reinvesting their collateral, also carried high risks depending on market conditions. The company recently filed a complaint regarding DefiLlama's TVL (Total Locked Value) calculation method. DefiLlama stated that it did not accept Stream's model as "true TVL," and Stream began displaying the total of user deposits and strategic assets separately on its website.DeFi experts believe this incident will increase awareness of the risks associated with complex yield strategies in the industry. "This clearly highlights how yield is generated and how risky strategies that don't align with standard metrics can be," said Minal Thurkal, Head of the DeFi ecosystem at CoinDCX.Stream Finance's suspension of withdrawals until the investigation is complete has severely shaken user confidence. The company announced that it will provide regular updates on the process in the coming days. However, how this $93 million loss will be recouped and the extent to which investors will be compensated for their losses remains unclear.
Sharp Correction in the Crypto Market: Bitcoin and Altcoins Drop
The crypto market was caught in a sharp sell-off again in the first week of November. Bitcoin tested below $105,000 for the first time in three weeks, while altcoins experienced even deeper losses. The combination of fear and liquidity squeeze across the market significantly reduced investor risk appetite. With Bitcoin's decline, the Crypto Fear and Greed indicator dropped from 42 to 21, reaching the "Extreme Fear" level. This was its lowest point in seven months. The last time the index fell this sharply was in April. At the time of writing, the index was down 29 percent. According to experts, there are multiple reasons behind the sell-off. The first factor is the lack of liquidity in the market. According to analyst Michaël van de Poppe, the circulating supply of many altcoins is limited. If only 10% of the total supply is traded, a large sell order can easily destabilize the market. Because the order books lack sufficient depth, the decision by a few large investors to sell can quickly drive prices down. This makes altcoins both more vulnerable to declines and more reactive to rises. Van de Poppe says, “Be patient. The cycle is not over. Altcoins may recover more strongly when liquidity returns.”Another pressure factor in the market is Bitcoin's increasing dominance. Bitcoin, which holds more than 60% of the total market capitalization, is causing capital outflows from altcoins. As dominance increases, investors are turning to BTC again as a safe haven, accelerating the weakening of altcoins.On the macro front, the liquidity shortage in the US is negatively impacting cryptocurrencies. The government shutdown and Treasury spending cuts have reduced cash flow in the market. The accumulation of approximately $1 trillion in the Treasury General Account (TGA) has reduced reserves in the system and pushed up money market interest rates. This squeeze has led to a flight from risky assets. Furthermore, cautious statements from Fed Chair Jerome Powell accelerated the sell-off. While markets were anticipating further interest rate cuts, Powell's message that "we won't rush" disappointed investors. Bitcoin fell below $108,000, while leading altcoins like Ethereum and Solana lost between 6-8 percent of their value. Trading volumes have decreased by nearly 40 percent since mid-October.What lies ahead?However, the outlook isn't entirely bleak. Historically, when Bitcoin dominance peaks and altcoins are weak, a strong altcoin rally usually follows. Experts suggest that the Fed could become dovish again (dovish, positive monetary policy) if the US government resolves the shutdown and economic data weakens. Such a scenario could trigger a potential liquidity expansion or a new wave of quantitative easing in 2026. In short, the crypto market is currently under pressure from shrinking liquidity, rising fear, and Bitcoin-centric capital influx. However, such periods can herald a new bullish cycle for patient investors.
What is PayPal USD (PYUSD)?
At a time when digital payments are gaining momentum and users are seeking speed, low costs, and security, PayPal USD (PYUSD) was developed to address these needs. Launched in collaboration with PayPal and Paxos, PYUSD is a stablecoin pegged to the US dollar. Backed 100% by cash and short-term Treasury bonds, this digital asset aims to build a robust and reliable bridge between traditional finance and the Web3 world. Running on Ethereum (ERC-20) and Solana (SPL), PYUSD allows PayPal and Venmo users to transfer value in seconds with low fees. Token issuance and redemption occur through Paxos Trust, and all reserves are transparently audited. The NYDFS license and PayPal's BitLicense provide the project with a strong regulatory foundation.Let's take a detailed look at what PYUSD offers, how it works, and why it is rapidly gaining importance in both the individual and corporate worlds.PYUSD Definition and OriginPayPal USD, or PYUSD for short, is a stablecoin developed by digital payments giant PayPal in collaboration with Paxos Trust, a regulatory-compliant blockchain company. PYUSD's key feature is that each token is pegged to $1. It is 100% backed by cash and short-term Treasury bonds. This means that when a user holds 10 PYUSD, they are actually holding $10 worth of cash or government bonds in Paxos's controlled reserves. This provides both security and a stable digital store of value. PYUSD is always trading around $1. PYUSD was created to offer a fast, low-cost, and secure payment solution in the digital economy. PayPal wants both individuals and businesses to be able to conduct their daily transactions via its blockchain infrastructure. Specifically, it aims to build a secure bridge between fiat money (i.e., traditional USD) and the crypto world. In other words, with PYUSD, users can easily convert their PayPal balance into digital form and convert it back to traditional USD when needed. This two-way bridge structure makes PYUSD a highly practical solution.As a technological infrastructure, PYUSD was initially implemented as an ERC-20 token on the Ethereum network. However, over time, it will be ported to the Solana network, which stands out for its scalability and low transaction costs. With the launch of Solana support in May 2024, PYUSD will be much faster and cheaper to transfer. This is a significant step for a user-friendly brand like PayPal to offer stable value across different networks. This structure, which combines Ethereum's secure and widespread ecosystem with Solana's speed advantage, provides flexibility for both developers and ordinary users. Paxos manages this entire process transparently and in compliance with regulations. It reports its PYUSD reserves monthly through independent auditors. These reports are made publicly available for everyone to access. Furthermore, Paxos, the issuer of PYUSD, is licensed by the New York Department of Financial Services (NYDFS). Similarly, PayPal obtained a BitLicense in 2022, ensuring PYUSD's fully regulated market presence. Users can instantly convert their balances from their US PayPal or Venmo accounts into PYUSD and back to USD with equal ease. Furthermore, PYUSD can be sent to other wallets, used for online purchases, or traded on supporting exchanges. This flexibility makes it a functional tool in both the traditional finance and cryptocurrency worlds.PYUSD History: Key MilestonesPYUSD has experienced rapid growth since its launch. PYUSD quickly expanded into a broad ecosystem, both in terms of technical infrastructure and user access, and is solidifying its place in the stablecoin space with significant partnerships and strategic integrations. Here are the milestones in this process:August 2023 – Launch: PayPal officially announced PYUSD on August 7, 2023. Led by CEO Dan Schulman, this announcement symbolized PayPal's entry into the digital currency world. It was emphasized that PYUSD would be launched in partnership with Paxos Trust and fully licensed.September 2023 – Venmo integration: On September 20, 2023, PYUSD was integrated into the Venmo app. Users could now buy and sell PYUSD and make fast and free transfers between their PayPal and Venmo accounts. With this development, the NYDFS also added PYUSD to its "green list," solidifying its regulatory acceptance. Fall 2023 – Exchange and wallet support: PYUSD was listed on leading crypto exchanges such as Crypto.com, Coinbase, Kraken, and Bitstamp towards the end of the year. It was also integrated with popular wallets such as MetaMask, Ledger, and Phantom, as well as institutional custody platforms such as Fireblocks and Copper. Support for payment services such as BitPay increased its potential for daily use.March 2024 – Free transfers with Xoom: PayPal integrated PYUSD into its cross-border transfer platform Xoom. This initiative allowed users to send money with PYUSD to many locations around the world without any exchange rate differences or transaction fees.May 2024 – Release on the Solana network: At Consensus 2024, it was announced that PYUSD now runs on the Solana network. Solana's high transaction capacity and low cost made PYUSD transfers much more efficient. Around the same time, Paxos began publishing monthly audit reports on reserves.2025 - 2025 saw significant developments in regulation, technology, and adoption for PYUSD. In February, the US Securities and Exchange Commission (SEC) closed its 15-month investigation into PYUSD without imposing any sanctions. Around the same time, PYUSD was temporarily removed from some European exchanges (e.g., Kraken) due to the European Union's MiCA regulation coming into effect. PayPal announced that PYUSD had exited the experimental phase and aimed to roll it out to 20 million businesses by the end of 2025. It also planned to support freelancers with bulk payments through Hyperwallet. In June, plans were announced to integrate PYUSD into the Stellar network, making it more widely available in microfinance and remittance platforms with faster and lower-cost transactions. The "Pay with Crypto" platform, launched in July, allows businesses to receive crypto payments from over 100 wallets, store these payments as PYUSD, and earn returns of up to 4%. In August, PYUSD entered the top 10 stablecoins list by forming a $1 billion liquidity partnership with Spark in the DeFi space. As a result of these developments, PYUSD's market capitalization surpassed $2.8 billion in October, with an average daily trading volume of $100 million. Why is PYUSD Important?PYUSD offers a unique user experience by combining the speed and security advantages of blockchain with the familiar structure of traditional finance. With its 24/7 infrastructure, transfers occur in seconds, making global money transfers much more convenient for both individuals and institutions. Furthermore, these transactions are secured by reserves backed by 100% cash and short-term US Treasury bonds. Thanks to independent audit reports regularly published by Paxos, the exact value of PYUSD is transparently verified.PYUSD largely eliminates the high transaction fees and long waiting times associated with traditional cross-border transactions. PYUSD transfers between PayPal and Venmo are completely free, while transactions made through other networks are also quite low-cost. Being able to trade with a stable asset, especially for large transactions, protects users against exchange rate fluctuations and increases operational efficiency.One of PYUSD's biggest distinguishing features is its strict regulatory compliance. Paxos's New York Department of Financial Services (NYDFS) license and PayPal's BitLicense demonstrate that this stablecoin operates in full compliance with regulations. This provides a significant level of trust, particularly for institutional investors and large businesses.PYUSD also boasts significant user access. Its integration with PayPal and Venmo allows millions of users to access this digital dollar with a single click. Furthermore, because PYUSD is traded on major exchanges like Coinbase and Crypto.com, it appeals to a broad audience of investors and developers. The use of PYUSD, particularly in DeFi protocols and liquidity pools, is becoming increasingly widespread, making it an important tool in both traditional and decentralized finance. Finally, one of the most striking aspects of PYUSD is its ability to serve as a functional bridge between fiat and the crypto ecosystem. Users can easily convert their dollar balances into PYUSD, use them in the blockchain environment, and convert them back to fiat dollars when needed. This two-way ease of use holds great potential for the future of financial systems. PYUSD thus builds a seamless and secure bridge between the digital and traditional worlds.PYUSD Model: Economics, Reserves, and Issuance MechanismPYUSD's token economics model also adds value to the coin. PYUSD is designed as a stablecoin that aims to maintain the peg of 1 PYUSD = 1 US dollar. To maintain this value, its reserves consist of 100% cash and short-term Treasury bonds. Paxos holds these reserves in dedicated accounts under the supervision of the NYDFS and publishes independent audit reports monthly, ensuring both regulatory compliance and user trust.The token issuance and redemption process is highly transparent: Users can acquire PYUSD by depositing USD through their PayPal or Venmo accounts; Similarly, they can convert PYUSD back to USD at any time. PYUSD initially launched as an ERC-20 token on Ethereum and expanded to the Solana network by 2024. Integration with other networks such as Stellar and Polygon is planned for the near future. This multi-network strategy increases PYUSD's accessibility and transaction efficiency.PYUSD UsesFurthermore, PYUSD offers many practical uses for everyday users and businesses. It enables low-fee transfers, particularly for cross-border payments. Transactions between PayPal and Venmo are free, while international money transfers with services like Xoom are also becoming faster.With the on/off-ramp feature, users can directly switch between USD and PYUSD without using a bank or exchange. This feature simplifies crypto access. Furthermore, merchants accepting PYUSD receive payments instantly at a fixed dollar value, reducing exchange rate risk and transaction time. On the institutional side, PYUSD is used in both treasury management and DeFi applications (liquidity pool, lending, collateral). Integration with PayPal wallets provides a seamless experience within the digital ecosystem, while also being tradeable on external wallets and major crypto exchanges.PYUSD's Future and RoadmapFinally, PYUSD's future also adds value to the coin. PYUSD's future plans are focused on multi-chain expansion, global regulatory compliance, and institutional integration. Following Ethereum and Solana, it is expected to become active on networks such as Stellar, Arbitrum, and Polygon. Furthermore, bridge protocols like LayerZero will increase PYUSD's portability across blockchains.PayPal is also keen to expand PYUSD beyond the US. Once compliance with international regulations like MiCA is achieved, its use in Europe and other regions could expand. A focus is being placed on bank and fintech partnerships to increase institutional adoption.Transparency will become even more important in the future: Paxos's monthly audit reports may increase in frequency, and real-time verification systems may be implemented. Additionally, reward programs such as interest or cashback are also on the agenda to incentivize users. Finally, the use of PYUSD in next-generation financial products (e.g., token-based derivatives or digital insurance) could become widespread.Who are the Founders of PYUSD?PYUSD is backed by two powerful names: PayPal, a pioneer in digital payments, and Paxos Trust, which provides a fully compliant stablecoin infrastructure. PayPal CEO Dan Schulman emphasizes the need for reliable tools that can integrate with both the fiat and blockchain worlds for the widespread adoption of digital assets. He believes PYUSD directly addresses this need. Paxos CEO Charles Cascarilla describes PYUSD as "the first stablecoin issued by a leading financial institution" and sees this move as a significant advancement in the digital asset world. Jose Fernandez da Ponte, Head of PayPal's Blockchain and Crypto Group, stated that the primary goal in PYUSD's design was to provide "a fast, simple, and low-cost payment solution for commerce." This visionary leadership approach makes PYUSD a strategically strong product.From the ecosystem perspective, PYUSD is also progressing with significant support. Global crypto exchanges like Crypto.com, Coinbase, and Kraken currently list PYUSD; popular wallets like MetaMask, Ledger, and Phantom support this digital dollar. On the institutional side, secure custody services like Fireblocks and Copper continue their PYUSD integrations. In terms of payment systems, shopping with PYUSD is now possible thanks to service providers like BitPay. Moreover, PayPal's services, such as Venmo and Xoom, make individual-to-individual and country-to-country transfers of PYUSD more accessible. This broad partnership structure provides easy access to PYUSD for both individual users and corporate actors.Frequently Asked Questions (FAQ)Below are some answers to your questions about PayPal's PYUSD:What is the difference between PYUSD and PayPal Balance? A PayPal balance is a digital fiat account used only within the PayPal/Venmo ecosystem. PYUSD, on the other hand, can be converted from this balance, but it is a crypto asset that can travel on the Ethereum/Solana networks. This means you can send PYUSD to wallets other than PayPal or use it on supporting services. Every 1 PYUSD is worth exactly 1 USD, guaranteed by Paxos.How are PYUSD reserves verified? Paxos publishes independent audit reports every month. These reports document the total value of cash and bonds held against PYUSD. Furthermore, the records are checked by certified independent auditors, allowing users to confirm that the reserves are 100% mutual.Which blockchains is PYUSD valid on? PYUSD was initially released on Ethereum (ERC-20 token). Support for Solana (SPL) was added in May 2024. PayPal and Venmo wallets display their balances as a single account on both networks. Network connections to Arbitrum, Polygon, and others are also planned for the future.Why do corporates use PYUSD? PYUSD offers low costs and fast settlements for cross-border payments. Its transparent reserve structure and auditability make it compliant with financial regulations. Large companies can mitigate risk by holding excess cash in Treasury bonds and access digital payment infrastructures with PYUSD. In short, it provides operational efficiency and compliance advantages.Can individuals use PYUSD? Yes. PYUSD is available to individuals in the US with eligible PayPal or Venmo accounts. These users can buy and sell PYUSD directly within PayPal/Venmo. It can also be accessed by purchasing PYUSD from exchanges like Coinbase and Crypto.com or from supporting wallets. This means that individuals can also access PYUSD, albeit with limited access.You can find the most up-to-date analyses, tools, and guides on PYUSD and the stablecoin ecosystem in the JR Kripto Guide series.
The Powell Effect: Bitcoin Funds Exit, Solana, and Flow into 6 Altcoins
Crypto asset investment products recorded a total net outflow of $360 million last week. This decline is primarily due to Fed Chair Jerome Powell's emphasis that a new interest rate cut in December is "not a certainty." Powell's cautious remarks have plunged investors into uncertainty, dampening risk appetite.CoinShares data draws attention: Bitcoin's significant outflowAccording to CoinShares data, the United States is at the center of these outflows. US-based funds saw $439 million in outflows, partially offset by inflows of $32 million from Germany and $30.8 million from Switzerland. Canada also closed the week in positive territory with $8.5 million in flows. Sweden, on the other hand, recorded an outflow of $11 million.Bitcoin ETFs were the hardest-hit product group, with $946 million in outflows for the week. Despite the interest rate cut, Powell's "hawkish" rhetoric reiterated Bitcoin's sensitivity to monetary policy. While Bitcoin's total assets under management fell to $175.6 billion, the year-to-date inflow of $29.4 billion remained.Solana was the star of the week. Driven by the launch of new Solana ETFs in the US, the funds saw $421 million in inflows. This figure marked the second-highest weekly inflow in Solana's history. This brings SOL's total positive year-to-date inflow to $3.3 billion. Ethereum also saw $57.6 million in inflows. However, daily flow data suggests investors remain hesitant. Nevertheless, it's noteworthy that Ethereum maintained its strong year-to-date inflow of $14.3 billion. XRP also closed the week positive with $43.2 million in positive flow, bringing its total year-to-date inflow to $1.97 billion.The picture was mixed for smaller altcoins. Sui saw $9.4 million inflows, Litecoin $1.5 million, Cardano $700,000, and Chainlink $500,000. Multi-asset funds saw a small inflow of $8.3 million, while Zcash remained stable. However, the "other" category saw a notable outflow of $43 million.Among fund providers, iShares ETFs led the way with $390 million in outflows. Fidelity's Wise Origin Bitcoin Fund saw $156 million, Bitwise $92 million, and ARK 21Shares $76 million. ProShares and 21Shares AG also saw positive outflows, with $47 million and $21 million, respectively.While a total of $49 billion has flowed into digital asset funds since the beginning of the year, fluctuations in recent weeks suggest that investors are still closely monitoring Fed policy.

Balancer Suspected in $70 Million Hack Attack
Balancer, one of the established protocols in the DeFi ecosystem, was rocked by suspicions of a major cyberattack in which approximately $70.9 million in assets were stolen. On-chain data indicates that the funds were transferred to a new wallet and the attacker began consolidating the assets. This raised concerns about possible money laundering and asset hiding attempts.Hack Suspicion for BalancerAffected assets include 6,850 osETH, 6,590 WETH, and 4,260 wstETH. Data indicates that the attack occurred on Balancer's second version (V2). Balancer has long held a prominent position in the decentralized finance world, a protocol with approximately $750 million in total value locked (TVL).Following the attack, the price of Balancer's native token, BAL, fell by more than 5 percent. Market data shows that BAL has been declining significantly since its peak on Monday. The Balancer team hasn't yet released an official statement, but this is the project's third major security breach in the last four years. Two separate attacks, in 2021 and 2023, also resulted in millions of dollars in losses.According to data shared by the on-chain analytics platform Lookonchain, the attacker's wallet experienced a total outflow of approximately $70.6 million worth of assets. Ethereum-based assets appear to predominate among these funds. Experts suggest the attacker may have attempted to move funds through mixers or interchain bridges. This method complicates cryptocurrency tracing and is often used in money laundering attempts.Different scenarios are being floated within the community regarding how the attack occurred. Some analysts suggest a smart contract vulnerability in Balancer V2 pools may have been exploited, while others believe the attack stemmed from an unrelated protocol management error. Security researchers are currently examining the on-chain activity in detail to trace the funds and identify the attack vector.The community expects an immediate statement from the Balancer team and a potential restitution plan. The extent and impact of the attack will become clearer in the coming days, but this $70 million incident has already gone down as one of the largest security incidents of 2025 in the DeFi ecosystem.
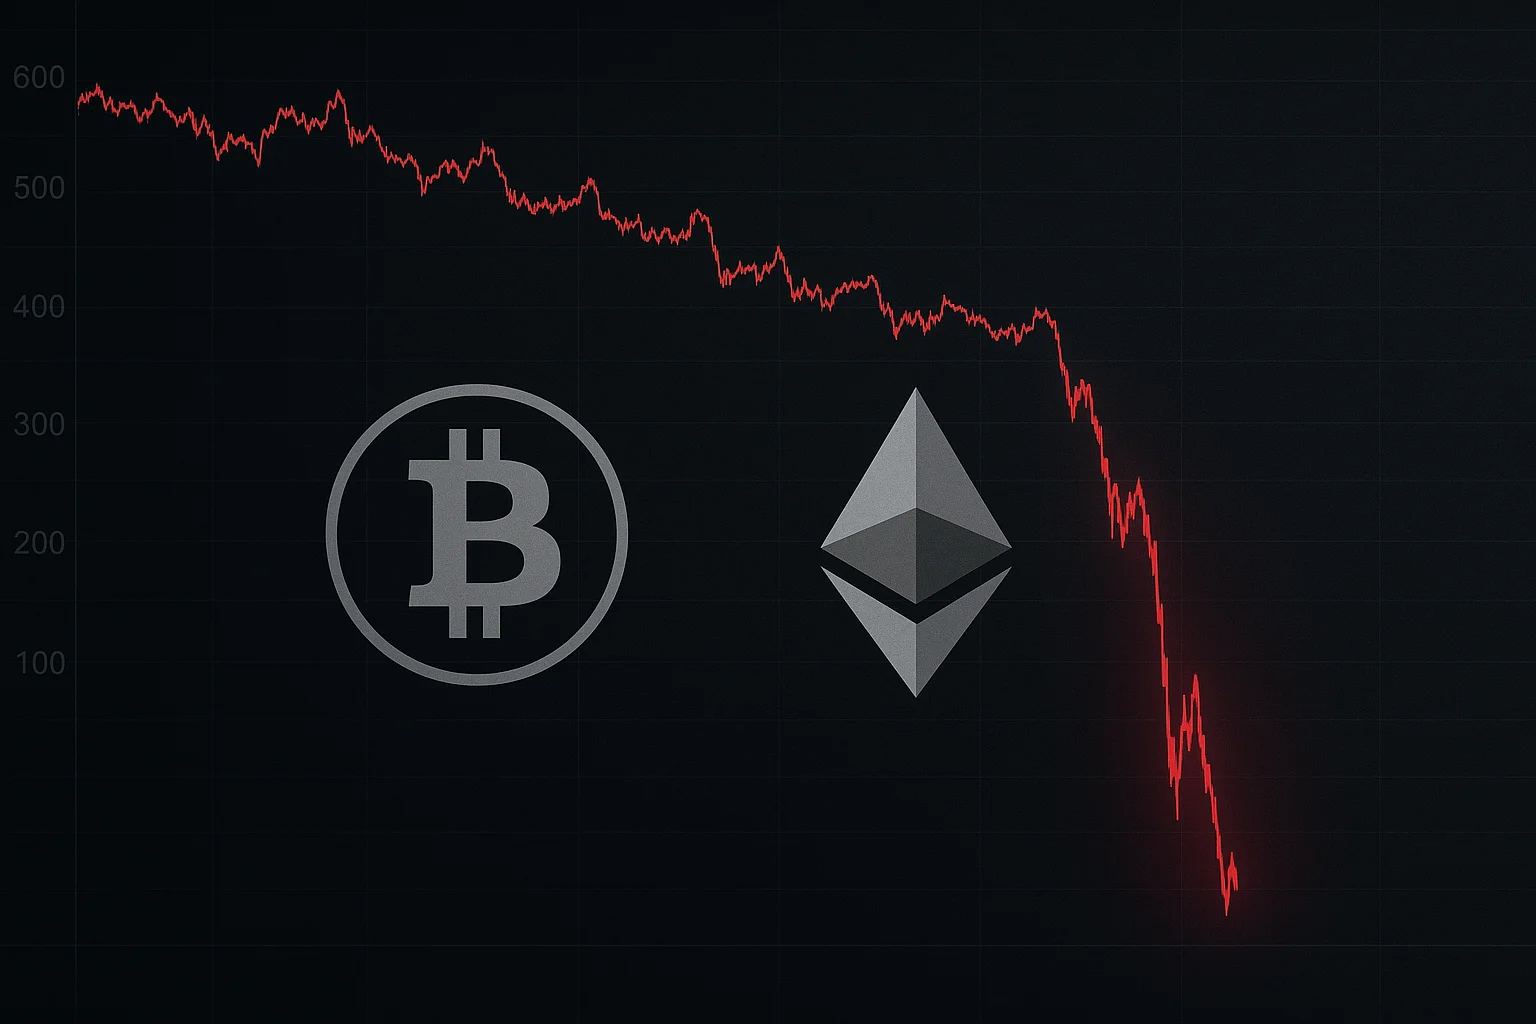
Why the Crypto Market Crashed? Here Are 3 Critical Factors
The cryptocurrency market closed the week with a sharp sell-off. As of November 3rd, the total market capitalization fell by approximately 3 percent, returning to the red. Many major crypto assets, particularly Bitcoin and Ethereum, experienced double-digit declines. The liquidation of over $400 million in long positions within 24 hours further deepened the decline.No new Fed cut signalThe selling stems from statements from the US Federal Reserve (Fed). Fed Chair Jerome Powell, who cut interest rates by 25 basis points in October, said that a new cut in December was "not a certainty." This statement weakened investor expectations for easing policy; the dollar index strengthened, while risk appetite declined.US Treasury Secretary Scott Bessent also stated that tight monetary policies were already slowing some parts of the economy, leaving limited room for further cuts. According to CME FedWatch data, the probability of a December interest rate cut has fallen to 69 percent. This has created selling pressure, particularly on cryptocurrencies, which are among the most interest-sensitive assets. Billion-Dollar Outflow from Bitcoin ETFsAnother factor deepening the market decline was the massive outflows from US-based spot Bitcoin ETFs. According to Fairside data, a total of $1.15 billion was withdrawn from these funds last week alone.Outflows from major funds like BlackRock, ARK Invest, and Fidelity indicate a decline in investor interest in institutional crypto products. This situation exacerbated the vulnerability of the Bitcoin price, causing the sell-off chain to lengthen.Wave of Liquidations Exceeds $400 MillionBitcoin's slide below $107,500 triggered a chain of liquidations in futures. More than 162,000 investors lost their positions in the last 24 hours. In Bitcoin alone, $74.6 million worth of long positions were liquidated, while in Ethereum, this figure reached $85.6 million. Across the market, $413 million worth of long positions were liquidated. Analysts point to the risk of an additional liquidation of approximately $6 billion if BTC falls below $106,000. If this scenario plays out, the market is likely to enter a sharper correction in the short term.Sharper decline in altcoinsAltcoins were hit much harder than Bitcoin. The top 50 cryptocurrencies lost around 4 percent on average. Bitcoin's market dominance increased to 60.15 percent, indicating that investors are turning to BTC as a "safe haven."Ethereum fell 4.4 percent to $3,734, and BNB fell 4.8 percent to $1,039. XRP lost 3.3 percent to $0.56. Uniswap (UNI) and Dogecoin (DOGE) were among the day's sharpest-falling assets, with UNI losing 9 percent and DOGE losing 6.9 percent. The overall outlook suggests that the Fed's cautious stance and ETF outflows are suppressing market risk appetite, while leveraged trading and on-chain liquidations are accelerating the decline. The crypto market may remain volatile and directionless until the Fed meeting in December.
STRK Commentary and Price Analysis - November 3, 2025
STRK/USDT Technical Analysis STRK Current View As one of the leading Layer-2 solutions addressing Ethereum’s scalability challenges, StarkNet has recently come back into the spotlight with both its technological upgrades and user-focused initiatives. Notably, the StarkNet Foundation’s staking system, which now includes Bitcoin users, has drawn significant attention. The growing number of developers and expanding ecosystem continue to fuel investor interest in STRK.Analyzing the chart on the daily time frame, we see that the coin has been trading within a broad consolidation range for quite some time. The price has recently retested the lower boundary of this range and showed a strong bounce reaction, suggesting that the bottom zone remains valid and short-term momentum has turned positive. The price is currently attempting to hold above the $0.1150–$0.1230 zone. Closes above this area would support further bullish momentum. The first key resistance stands near $0.1380, followed by the $0.1500–$0.1550 region. A confirmed move above this zone could open the path toward $0.1700 and signal a continuation of the recovery trend.On the other hand, the $0.1150 level will act as initial support below. Losing this area may trigger a deeper retest toward $0.1040–$0.1000. However, current price behavior suggests that buyers are actively defending the range lows, keeping the structure constructive for now.Summary• STRK remains in a long-term consolidation structure.• Strong rebound from range support turned short-term outlook positive.• Holding above $0.1230 strengthens the $0.1380 upside target.• Below $0.1150, a retest of lower supports may occur.These analyses, not offering any kind of investment advice, focus on support and resistance levels considered to offer trading opportunities in the short and medium term according to the market conditions. However, traders are responsible for their own actions and risk management. Moreover, it is highly recommended to use stop loss (SL) during trades.

ZK Comment and Price Analysis - November 3, 2025
ZK/USDT Technical AnalysisZKsync stands out as one of the strongest Layer-2 solutions tackling Ethereum’s scalability challenges. Recently, interest in the ecosystem has surged; both the number of users and transaction volume have seen a visible increase. At the same time, more developers are deploying applications on ZKsync Era, further supporting the network’s growth. Trend Breakage Analyzing the chart on the daily time frame, we see that the coin has broken above its year-long downtrend, signaling a clear shift toward a more bullish structure. Following this breakout, the price successfully moved above the major horizontal resistance zone at $0.060–$0.072, confirming early signs of trend reversal.This strong uptrend remains intact as long as the price holds above this region. The first major target sits near $0.099, followed by the $0.12–$0.14 range, which is a key zone where trend continuation could accelerate and market strength could expand.In case of a downside correction, the $0.060 area could be retested as support. A daily close below this level might weaken momentum and trigger a pullback toward $0.047. However, the current outlook remains positive, with the breakout structure still holding strong.Support and Resistance LevelsSupport: $0.060 – $0.047 – $0.036Resistance: $0.099 – $0.12 – $0.14 – $0.178Summary• ZK has broken above its year-long downtrend; structure turned bullish.• Above $0.072, price could advance toward $0.12 – $0.14.• $0.060 acts as a key support and trend validation zone.• Trend bias remains upward; dips may offer buying opportunities.These analyses, not offering any kind of investment advice, focus on support and resistance levels considered to offer trading opportunities in the short and medium term according to the market conditions. However, traders are responsible for their own actions and risk management. Moreover, it is highly recommended to use stop loss (SL) during trades.

ETHFI Commentary and Price Analysis - November 2, 2025
ETHFI/USDT Technical AnalysisWe’re ending the week on a positive note for EtherFi. The protocol’s DAO has proposed a token buyback of up to $50 million from its treasury. This move is widely seen as a strong signal of confidence — aiming to control circulating supply and support ETHFI’s token value. ETHFI Range Area Analyzing the chart on a daily time frame, we see that the coin keeps moving within a broad range structure. The price has recently bounced strongly from the lower range band at $0.80–$0.88, showing early signs of recovery. This zone has acted as a key demand and support area multiple times before. The first resistance in the short term to watch is $1.12. A breakout above this level could open the door for a move toward $1.43, which aligns with the mid-range resistance and serves as a major barrier.On the other hand, maintaining support above $0.88–$0.80 remains crucial for the ongoing trend. A daily close below this area could increase selling pressure and trigger a deeper pullback toward $0.66.Support and Resistance LevelsSupport: $0.88 – $0.80 – $0.66Resistance: $1.12 – $1.43 – $1.56 – $2.04Summary• ETHFI has rebounded strongly from the lower range support.• Key breakout zones: $1.12 and $1.43.• As long as the $0.80–$0.88 support holds, recovery momentum remains intact.• A close below $0.80 would weaken the technical outlook.These analyses, not offering any kind of investment advice, focus on support and resistance levels considered to offer trading opportunities in the short and medium term according to the market conditions. However, the user is responsible for their own actions and risk management. Moreover, it is highly recommended to use stop loss (SL) during the transactions.

TAO Commentary and Price Analysis - November 2, 2025
TAO/USDT Technical AnalysisBittensor continues to attract attention at the intersection of artificial intelligence (AI) and blockchain technology. With nearly 70% of TAO tokens staked and increasing institutional interest, the network shows strong potential to evolve from being “just a tech project” into a system with real-world utility. Symmetrical Triangle Formation Analyzing the TAO chart on a daily time frame, we see that the coin is trading within a symmetrical triangle formation. As of today, the price has touched the upper trendline of the triangle, marking a critical short-term resistance zone around $524–$555. A decisive breakout above this area would confirm the bullish pattern, potentially driving the price first toward $565, then $671. In a broader scenario, the $785 region stands out as an extended target.On the other hand, the $460–$431 range forms the first support area. If the price breaks below this zone, a deeper pullback toward $358—aligned with the triangle’s lower trendline—could occur. However, the current structure remains constructive, supported by repeated upper-band tests and sustained buying pressure.Summary• TAO is testing the upper boundary of a contracting triangle.• A breakout above $524–$555 could accelerate the uptrend.• Upside targets: $565 → $671 → $785.• A drop below $460 would signal short-term weakness.These analyses, not offering any kind of investment advice, focus on support and resistance levels considered to offer trading opportunities in the short and medium term according to the market conditions. However, the user is responsible for their own actions and risk management. Moreover, it is highly recommended to use stop loss (SL) during the transactions.

ARB Comment and Price Analysis - November 1, 2025
ARB Technical AnalysisArbitrum has recently gained attention with its expanding role in DeFi and real-world asset (RWA) tokenization. The rapid growth in active projects and stablecoin liquidity is broadening the network’s utility and driving stronger investor interest in the ARB token. Before diving into the technicals, it’s worth noting how this ecosystem growth is starting to reflect on the price action. Falling Wedge Formation Analyzing the ARB chart on a daily time frame, we see that the coin keeps trading inside a falling wedge formation. This is typically known as a bullish reversal pattern. The price is currently hovering around the midline of the wedge, and holding this area strengthens the case for a potential upside breakout in the coming sessions. In the short term, the $0.30–$0.32 zone remains a key support area. As long as the price stays above this level, the overall outlook remains constructive.The $0.36–$0.39 range is the first major resistance and could mark the start of a move toward the wedge’s upper boundary. If an upside breakout occurs, targets lie at $0.45–$0.51, with the full wedge projection pointing toward $0.62.However, a daily close below $0.28 would weaken the structure and increase selling pressure.Support and Resistance LevelsSupport: $0.32 – $0.30 – $0.28Resistance: $0.36 – $0.39 – $0.45 – $0.51 – $0.62These analyses, not offering any kind of investment advice, focus on support and resistance levels considered to offer trading opportunities in the short and medium term according to the market conditions. However, traders are responsible for their own actions and risk management. Moreover, it is highly recommended to use stop loss (SL) during trades.

Ether.fi Launches $50 Million ETHFI Buyback
The Ether.fi DAO has submitted a new proposal proposing to buyback up to $50 million of ETHFI when the token price falls below $3. The proposal will be activated immediately upon approval, making Ether.fi the newest DeFi protocol to implement buybacks to enhance liquidity and support price stability. Market data indicates that decentralized finance (DeFi) projects are actively using this method, with buyback programs exceeding $1.4 billion by 2025. New proposal from the Ether.fi FoundationAccording to the governance proposal published on Thursday, the Ether.fi Foundation will be able to make open market purchases as long as the price of ETHFI remains below $3. ETHFI's price is down 89% from its 2024 peak and was trading at $0.93 as of October 31st, indicating that the token is within the buyback range envisioned by the proposal.Ether.fi is among the DeFi protocols that generate strong revenue but experience weak demand in the secondary market. The company's strategy is to use a portion of its protocol revenues to reduce the tokens in circulation, similar to share buybacks in the corporate world. However, this time, the buyback process will be tied directly to a price threshold rather than a specific timeline.The plan will take effect upon approval and continue until one of three conditions are met: the $50 million cap is reached, the foundation deems the program complete, or a new governance vote is passed. The proposal states, "The Foundation plans to gradually increase the buyback capacity based on protocol revenue when the ETHFI price is below $3. This will effectively utilize excess revenue, strengthen market confidence, and reduce the circulating supply."If the proposal is approved, following a four-day Snapshot vote starting Friday, this will be Ether.fi's third buyback attempt. Previously, liquidity support programs were implemented through Proposals #8 and #10. All transactions under the new plan will be transparently reported on-chain and shared on the Dune Analytics dashboard. Ether.fi is a non-custodial liquid restaking and staking protocol running on Ethereum. Users simultaneously acquire tradable tokens when staking ETH, allowing the assets to generate returns both within and outside of staking. Data indicates that the protocol's total locked value is around $10 billion, with annualized revenues of approximately $360 million.Ether.fi's move signals the evolution of DeFi protocols toward a revenue-driven "protocol-company" model. Giants like Aave, Uniswap, and even NFT marketplace OpenSea are also participating in this trend. This month, the Aave DAO proposed a $50 million annual token buyback program, while OpenSea has allocated half of its revenue to buybacks for its SEA token, which will launch in early 2026.According to a CoinGecko report, projects like Hyperliquid, Pump.fun, Aave, and Uniswap have repurchased over $1.4 billion in total tokens by 2025.
Deutsche Bank-Backed EURAU to Use Chainlink Infrastructure
AllUnity, a joint project between Deutsche Bank and DWS, is opening a new chapter in Europe's digital finance landscape. EURAU, the company's euro-backed stablecoin, is now multi-blockchain supported using the Cross-Chain Interoperability Protocol (CCIP) infrastructure developed by Chainlink. This allows EURAU to operate on Ethereum, Arbitrum, Base, Optimism, Polygon, and Solana networks, and will also integrate with the corporate finance-focused Canton Network in the future.EURAU will use Chainlink infrastructureAllUnity's euro-backed stablecoin, EURAU, is taking a significant step into Europe's digital finance scene. Developed as a joint venture between Deutsche Bank and asset management giant DWS, the project is migrating to multi-blockchain supported using Chainlink's Cross-Chain Interoperability Protocol (CCIP) infrastructure. This integration will enable EURAU to operate on Ethereum, Arbitrum, Base, Optimism, Polygon, and Solana networks. The company also plans to expand to the Canton Network, which focuses on corporate finance applications. AllUnity CEO Alexander Höptner stated that this step will enable EURAU to “operate seamlessly across different blockchains,” significantly expanding its usability and reach. Fernando Vazquez, head of banking and capital markets at Chainlink Labs, described the integration as “a fundamental step that accelerates the transition to a new era of tokenization in Europe.”EURAU is based on MiCA compliance and full reserve assurance. Licensed under MiCA, the European Union’s comprehensive framework for regulating crypto assets, the stablecoin targets institutional clients rather than individual investors. This allows EURAU to be used in B2B payments, treasury management, and on-chain settlement processes. With the license it received from the German financial supervisory authority BaFin in July, the project became one of the first officially regulated euro stablecoins in Europe.Chainlink’s CCIP technology enables the secure transfer of data, tokens, and messages between different networks. In this system, Chainlink acts as a bridge between blockchains, enabling smart contracts to communicate with each other. AllUnity's choice of this infrastructure sets a significant precedent for enabling European financial institutions to securely participate in the tokenization process.The two major institutions behind AllUnity lend significant weight to the project. As of March 2025, DWS managed over €1 trillion in assets, while Deutsche Bank's balance sheet exceeded $1.6 trillion.Eurau's transition to multi-network support could fill a long-needed gap in Europe's cryptofinance ecosystem. A euro stablecoin that is both regulatory-compliant and cross-chain interoperable is poised to play a central role in Europe's tokenization vision.At the time of writing, the LINK price appears largely unaffected by these developments. The coin is up 2% at $17.25.