Altcoin
This page lists the latest Altcoin news and market analysis. Browse articles, expert insights, and updates in this category on JrKripto. Stay informed with in-depth coverage of cryptocurrency trends and developments.
News
Altcoin News
Altcoin News
Browse all Altcoin related articles and news. The latest news, analysis, and insights on Altcoin.
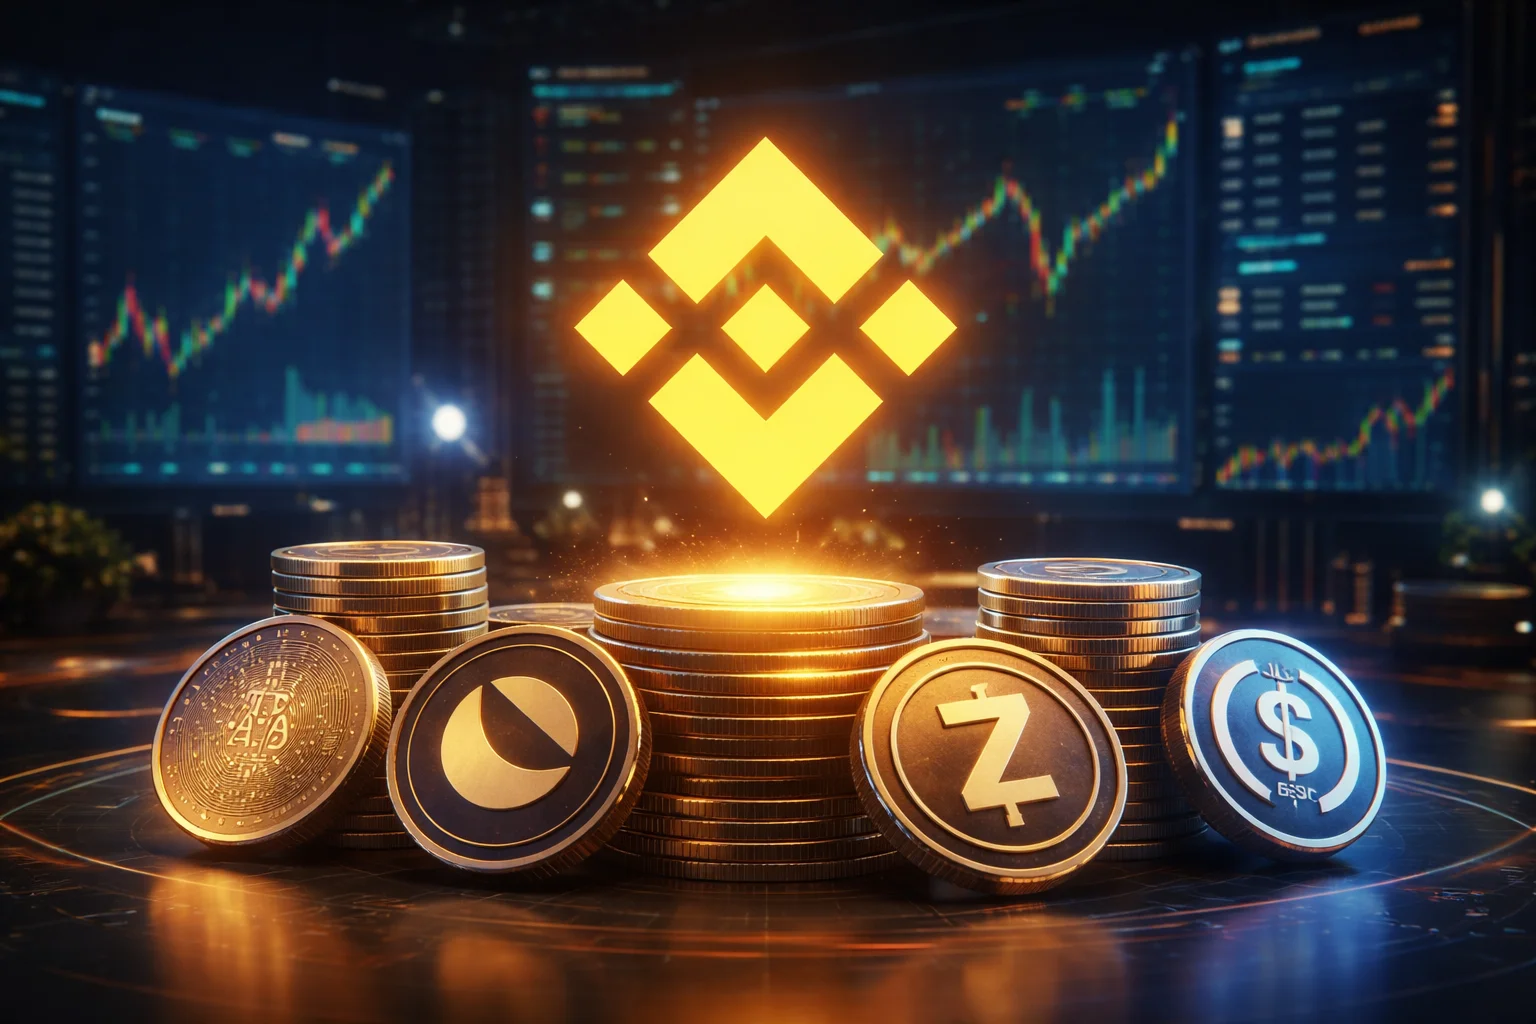
Binance Year-End Update: 5 New Pairs Will Be Listed
Binance, one of the largest cryptocurrency exchanges, continues to expand its spot trading options. According to an official statement, Binance announced it will launch five new trading pairs on the spot market to improve user experience and increase liquidity. Trading will begin on December 24, 2025, at 11:00 AM Turkish time (11:00 AM UTC) on the ADA/USD1, ASTER/USD1, LUNA/USDC, LUNC/USDC, and ZEC/USD1 pairs. With these new trading pairs, investors will have the opportunity to directly trade prominent crypto assets from different blockchain ecosystems against stablecoins. Projects such as Cardano (ADA), Aster (ASTER), Terra (LUNA), Terra Classic (LUNC), and Zcash (ZEC) will be available paired with stablecoins like USD1 and USDC. This step aims to provide a more flexible trading environment, particularly for investors seeking protection from price fluctuations and wanting to take positions in stablecoins. Trading Bots service will also be activatedBinance will not only list new pairs. At the same time, Trading Bots services will also be activated for these trading pairs. Within the scope of Spot Algo Orders, automated buy and sell orders will be available for ADA/USD1, ASTER/USD1, LUNA/USDC, LUNC/USDC and ZEC/USD1 pairs. Thanks to this feature, users will be able to automatically trade in the market according to their predetermined strategies and reduce the need for manual intervention in price movements.Automatic trading bots provide a significant advantage in terms of time management, especially in busy market conditions. Users can create strategies based on specific price ranges, volume criteria or technical indicators and execute their trades through algorithms. Binance emphasizes that these services are actively used by both individual investors and professional traders and offer a more disciplined approach to market fluctuations.On the other hand, Binance continues its incentives for USDC pairs. The statement indicated that discounted "taker" fees will continue to be valid for all existing and new USDC spot and margin trading pairs. This situation makes USDC-based transactions more attractive across the exchange, while also supporting liquidity. However, the new trading pairs will not be accessible to all users. Binance does not allow trading in these pairs in some countries due to legal and regulatory requirements. Canada, the US and its territories, the Netherlands, Iran, North Korea, Syria, Cuba, the Crimean region, and non-governmental areas of Ukraine are among the currently restricted regions. Users are also required to complete account verification processes to trade in these pairs.
What is Meteora (MET)?
Meteora (MET) is the native token of a dynamic liquidity protocol running on the Solana blockchain. It is part of a platform designed to make liquidity smarter, more efficient, and more sustainable in the DeFi ecosystem. In this guide, we will examine the Meteora protocol and the MET token in detail, covering all the important points from its definition and history to its use cases and token economics.Definition and Origins of METMeteora was developed as a decentralized exchange (DEX) and liquidity protocol built on the Solana network. The main goal of the project was to provide an efficient, combinable, and long-term sustainable liquidity infrastructure for decentralized finance (DeFi) applications. In fact, this story began in 2021 under the name Mercurial Finance. By 2023, the team repositioned the project and switched to the Meteora brand. With this transformation, Meteora became a core liquidity layer for many platforms, most notably Jupiter, one of the most important DEX aggregators in the Solana ecosystem. The Meteora protocol aimed to directly address some of the structural problems frequently encountered in classic DeFi models. These included the dispersion of liquidity into different pools, a large portion of capital remaining idle, increased slippage rates in volatile markets, and unfair token launches where bots played a prominent role. To overcome these problems, the team implemented a dynamic market maker model called DLMM, automated vault structures, and a fairer launchpad approach. The goal was to create a deeper, more balanced, and lower-cost liquidity environment for both liquidity providers and traders. Some of the launchpads on Meteora. The MET token was designed as a governance and utility token placed at the heart of this ecosystem.Operating on the Solana network with the SPL token standard, MET played an active role in the distribution of incentives and governance processes within the Meteora protocol. Following the collapse of the FTX exchange, the project team made a clear decision due to structural problems experienced on Mercurial Finance's former token, MER, and started with a clean slate. During this process, the Mercurial platform was shut down, and the Meteora protocol, built around the MET token, was implemented. In short, Meteora continued its journey as a new structure that drew upon Mercurial's experiences but learned from its mistakes, aiming to advance the dynamic liquidity layer vision on Solana with the MET token. MET's History: Key MilestonesMeteora's journey began with the idea of rethinking liquidity within the Solana ecosystem and quickly took shape through significant milestones. Instead of remaining merely a DEX, the project aimed to become one of Solana's core liquidity layers over time. During this process, critical steps were taken, including rebranding, technical architecture changes, new partnerships, and ultimately the launch of the MET token. Below, you can find the main milestones that the Meteora protocol has reached to date in chronological order:February 2023, protocol launch: The Meteora protocol, as the successor to Mercurial Finance, went live on the Solana mainnet in February 2023. This launch was carried out by the team behind Jupiter, Solana's largest DEX aggregator. While the Mercurial platform and MER token were officially discontinued, Meteora was launched from scratch with new features.Mid-2023, initial integrations: After its launch, Meteora quickly gained integrations within the Solana ecosystem. In particular, the Jupiter DEX aggregator began supporting Meteora's liquidity pools, and users were directed to Meteora pools via the Jupiter interface. In this way, Meteora became an important part of the ecosystem in its early stages. (Note: During this period, while platform usage increased, the user base remaining from the Mercurial era was also transferred to Meteora.)December 2023, Introduction of V2 and DLMM: At the end of 2023, the Meteora team announced the V2 version of the protocol and introduced the Dynamic Liquidity Market Maker (DLMM) concept. Launched in December 2023, the DLMM beta pools generated approximately $1 billion in transaction volume with only about $12 million in TVL, proving the system's high capital efficiency. The DLMM model attracted great interest thanks to its zero-slip price ranges (thousands) that concentrate liquidity and dynamic fee mechanisms adjusted according to market volatility.2024, Platform Development and Launchpad Partnerships: Throughout 2024, the Meteora protocol continuously developed. Significant steps were taken, especially in the Launchpad area: In August 2024, a partnership was established with the Moonshot launchpad, enabling new token projects to be launched fairly and liquidly through Meteora DLMM pools. Over time, launchpads like Believe, BAGS, and Jup Studio have also joined the Meteora ecosystem, generating hundreds of thousands of dollars in additional weekly volume and revenue. These integrations have made Meteora one of the preferred platforms on Solana for providing liquidity for new projects. September 2024, Phoenix Rising plan (MET announcement): After operating without a token for a long time, Meteora announced the MET token in the second half of 2024. With the plan called "Phoenix Rising," the details of MET's token economy (tokenomics) were shared with the community. The announcements stated that 20% of the total MET supply would be allocated to former Mercurial supporters, 15% would be given to Meteora users, and approximately 48% of the total supply would be in circulation at launch. This exceptionally high initial circulation rate demonstrated a goal of achieving a wider community distribution, unlike previous token launches in the Solana ecosystem (e.g., Jupiter's JUP token at 13.5%).October 23, 2025, MET token launch (TGE): After a long preparation period, Meteora's Token Generation Event (TGE) took place on October 23, 2025. On this date, the MET token was created on the Solana blockchain and distributed as an airdrop to pre-eligible users. Eligible users withdrew their MET tokens to their wallets using the claim interface on Meteora's official website. Simultaneously, up to 10% of the total supply of MET tokens was locked in a one-sided liquidity pool, creating an initial liquidity pool where users could purchase MET in exchange for USDC. This innovative distribution model enabled early price discovery and liquidity. In November 2025, following the TGE, the MET token began listing on major exchanges. For example, the Binance exchange opened MET trading to users on November 13, 2025, by listing the MET/USDT, MET/USDC, and MET/TRY trading pairs.December 2025: As of December 2025, the MET token price is hovering around $0.21. Why is MET Important?The MET token is central to the Meteora protocol and is significant both for its functionality within the ecosystem and its value model. Below, we will examine step-by-step why the MET token is so critical, under the headings of use cases and token economics. Use CasesUse in DLMM pools: The MET token plays a role in various ways within the dynamic liquidity pools offered by Meteora. In particular, the Meteora protocol has offered the possibility of creating a one-sided liquidity pool in new token launches. As seen in the launch of the MET token itself, users who won airdrops could, if they wished, place their METs in Meteora's initial pool and receive Liquidity Distributor NFT positions in return, earning a share of the pool transaction fees. In this way, MET has gone beyond being just a governance token and has become an asset that can be used in liquidity provision processes. In the future, it will be possible to evaluate MET in different token pairs within Meteora DLMM pools to provide liquidity or share in fee revenues. Staking and Voting (Governance): One of the most important use cases of the MET token is its governance mechanism. MET holders can participate in decision-making processes regarding the future of the Meteora protocol by staking their tokens. Staking users gain voting rights in Meteora DAO votes and can participate in proposals for changes to the protocol. For example, MET holders can vote on issues such as updating protocol parameters (fee rates, new pool approvals, etc.). In addition, there is the possibility of receiving a share of the protocol's revenues in exchange for staked METs. The Meteora team plans to share a portion of the transaction fees on the platform with MET stakers. This fee-sharing model aims to both create long-term demand for the MET token and incentivize liquidity providers and token holders in the same direction. In short, staking MET empowers users with governance while also offering the opportunity to generate passive income. In-protocol incentives and rewards: Within the Meteora ecosystem, the MET token is a tool used for various ecosystem incentives. MET rewards and programs have been implemented to encourage Meteora's growth and user participation. For example, the Meteora protocol ran a points program throughout 2024, distributing points to its active users; during TGE, users received a MET airdrop in exchange for these points (15% of the total supply was allocated to this program). MET has also been used in strategic partnerships: granting MET airdrop rights to those staking JUP tokens on the Jupiter platform is one example (3% of the total MET supply was allocated to Jupiter stakers). Going forward, it is planned to support ecosystem growth through MET token distributions within liquidity mining programs or other collaborations. In this way, MET acts as a central incentive element in rewarding protocol users and attracting new participants.Token EconomicsSupply Structure: The total supply of MET tokens is fixed at 1 billion. This means that a non-inflationary model is adopted by keeping the maximum amount of the token predetermined. The circulating supply will not be increased through new MET issuances, so if demand increases over time, the fixed supply can positively impact the token value. A certain portion of the total supply is initially put into circulation (through airdrops and liquidity pools), while the remainder is locked for future use. Distribution and Circulation: Meteora has designed the distribution of MET tokens to be as community-focused and fair as possible. Approximately 48% of the total supply was put into circulation at launch (TGE). This high initial circulation aimed to enable users and early supporters to participate in the project. When examining the breakdown of distributed tokens, 20% was allocated to former Mercurial token holders and stakers, and 15% to community members using the Meteora platform. Additionally, 3% is allocated to the Launchpad Partnerships ecosystem, 3% as an incentive for those staking JUP on the Jupiter platform, 2% to various off-chain contributors, 3% to operational liquidity needs, and 2% to a special staking participant group called M3M3. Through this distribution plan, Meteora has created a decentralized ownership structure by instantly giving almost half of the MET tokens into the hands of real users. The remaining approximately 52% of the supply is locked and will be used in long-term plans. Team and Reserve Allocations: 52% of the total MET supply, excluding the distributed portion, is allocated to team and protocol reserves. According to official statements, 18% is for the core team and 34% is designated as the Meteora protocol reserve. However, these tokens are not immediately released into circulation but are subject to a long-term vesting schedule. Team and reserve tokens will be released gradually over 6 years in a linear fashion, meaning a certain percentage will be released each year. This prevents the mass sale of team tokens, which would create a burden on the market, and encourages the project team to focus on long-term success. The 6-year vesting process is designed to ensure the sustainable development of Meteora and protect the MET token value from sudden supply shocks. Staking and Reward Mechanisms: Meteora's token economy relies on reward distribution through protocol revenue sharing and incentive reserves, rather than continuous inflation. This means that instead of constantly minting new tokens to reward MET token holders, pre-allocated community reserves and protocol-generated revenues are used. For example, it is planned that future MET stakers will receive a percentage of the protocol's DEX transaction fees. This approach creates long-term incentive models for MET: Token holders earn as the protocol grows, and since the total supply remains constant, motivation to hold (HODL) increases. As highlighted in Meteora's Phoenix Rising plan, all allocations except team and reserve allocations are available at launch, and no inflationary token release is planned afterward. This means that in the long term, there will be no selling pressure from sudden supply increases in the MET market, and incentives will be provided primarily through protocol revenues and collaborations. In short, the MET token economy is built on a balanced model that rewards users while maintaining token value. MET's Developers and LeadershipMeteora Labs is known as the team/company that developed the Meteora protocol. This team consists of experienced and well-known developers in the Solana DeFi ecosystem. The foundations of the Meteora project were laid with Mercurial Finance, one of Solana's early DeFi applications. The founding team of Mercurial aimed to bring new solutions to liquidity problems in Solana by launching Meteora. In 2021, the team behind the project received $3.5 million in seed funding from significant investors such as DeFiance Capital, Huobi (HTX) Ventures, and Signum Capital. This early support provided funding for Meteora's development and demonstrated confidence in the project's potential.Meteora's founder and first CEO is Ben Chow, a well-known name in the Solana community. Ben Chow is also known as one of the co-founders of Jupiter, Solana's largest DEX aggregator. As the leader behind Meteora's product architecture and launch strategy, Ben Chow played a significant role in the development of innovations such as DLMM and DAMM. However, in February 2025, following a community controversy (the memecoin incident involving Libra), Ben Chow left his active role at Meteora. Following this departure, project leadership was taken over by other founding members of Meteora. In particular, another core team member, known by the alias "Meow," and a co-founder of Jupiter, has been managing Meteora's operations and strategic direction since 2025. As an anonymous but respected developer within the Solana ecosystem, Meow has taken on the task of guiding the community and growing the protocol. Meteora's core team also includes important developers like M3M3. M3M3 was an early technical contributor to Meteora's automated market maker infrastructure, playing an active role in the development of features such as Alpha Vaults and dynamic fee modules. Continuously contributing to the technical evolution and community governance of the protocol, M3M3 is an active member within the MET DAO. The Meteora project has a strong community-driven governance approach, alongside its development team. A community movement called LP Army, bringing together liquidity providers, has formed around Meteora. Long-term supporters and members of the technical community contribute to the protocol's governance by coming together under the MET DAO (decentralized autonomous organization) structure. This community is active in areas such as discussing ecosystem proposals, planning the distribution of liquidity incentives, and providing feedback on the product roadmap. For example, Meteora's "Rising Incubator" program supports those developing new liquidity tools from within the community, and grants are allocated from the DAO treasury to such initiatives. Frequently Asked Questions (FAQ)Below you will find some frequently asked questions and answers about MET:Which network does MET run on?: The MET token runs on the Solana blockchain. It has an SPL token standard, meaning it is compatible with wallets and platforms in the Solana ecosystem. In short, you can store MET in Solana wallets such as Phantom and Solflare and use it in applications on the Solana network.What is DLMM and what does it do?: DLMM (Dynamic Liquidity Market Maker) is Meteora's advanced pooling model that concentrates liquidity in specific price ranges. This structure aims to balance the return of liquidity providers by applying dynamic transaction fees according to market volatility, while enabling transactions with very low slippage in narrow price ranges.What is the supply of MET tokens?: The total supply of MET tokens is 1 billion (1,000,000,000). This maximum supply is fixed, and the Meteora protocol will not create more MET. Initially, approximately 48% of the supply was planned to be in circulation, with the remainder locked for the team and protocol treasury. Since the supply is fixed, a scarcity effect may occur in MET tokens as demand increases over time. How to stake MET?: To stake MET, you need a Solana wallet and a small amount of SOL for transaction fees. The wallet is connected to the official Meteora application, MET tokens are locked, and in return, you gain governance rights and the opportunity to share in future protocol revenues. Can individual investors buy MET?: Yes, MET tokens are available to individual investors and can be bought and sold on both Solana-based DEXs and centralized exchanges. As of November 2025, many exchanges, primarily Binance, have launched trading pairs such as MET/USDT, MET/USDC, and MET/TRY.You can follow the latest analyses, guides, and developments about the MET token and the Meteora protocol in the JR Kripto Guide series.
New Act in the Terra Collapse: Jump Trading Sued for $4 Billion
The court-appointed receiver managing Terraform Labs' bankruptcy proceedings has filed a new lawsuit regarding the Terra ecosystem crisis, one of the most devastating collapses in cryptocurrency market history. Receiver Todd Snyder is seeking approximately $4 billion in damages, accusing the high-frequency trading company Jump Trading of illegally profiting from and actively contributing to the TerraUSD (UST) collapse. Allegations of a "secret agreement"The lawsuit, reported by the Wall Street Journal, was filed in the U.S. Federal Court for the Northern District of Illinois. In addition to Jump Trading, the lawsuit names William DiSomma, one of the company's co-founders, and Kanav Kariya, head of the crypto trading unit, as defendants. Snyder argues that Jump exploited the Terraform Labs ecosystem through "manipulation, concealment, and conflicts of interest," leading to significant financial losses for thousands of investors. In 2022, Terraform Labs' algorithmic stablecoin, TerraUSD, collapsed within days after losing its dollar peg, and the ecosystem's native token, Luna, plummeted to near zero. The wiping out of approximately $40 billion in market capitalization triggered a crisis of confidence not only among individual investors but across the entire cryptocurrency sector. This process paved the way for chain bankruptcies, further deepened by the collapse of the FTX exchange later that year. According to court documents, secret agreements were made between Jump Trading and Terraform Labs starting in 2019. These agreements allegedly involved Jump purchasing Luna tokens at prices far below market value, in some cases as low as 40 cents per token, and then freely selling these assets when prices rose above $100. Citing previous filings with the US Securities and Exchange Commission (SEC), Snyder claims Jump earned approximately $1 billion solely from Luna sales. The lawsuit also alleges that Jump was a party to a secret agreement, described as a "gentleman's agreement," to maintain TerraUSD's dollar peg. According to the allegations, in May 2021, when UST briefly fell below $1, Jump bought stablecoins from the market to drive the price up; however, this intervention was presented to the public as a success of Terraform's algorithmic structure. Snyder argues that this misled investors, creating the perception that the system was more robust than it actually was. Another notable claim in the lawsuit is that approximately 50,000 Bitcoins were transferred to Jump during the May 2022 crisis without any written contract. Furthermore, it is alleged that DiSomma sought emergency financing by contacting other trading companies as the crisis deepened, and that these actions accelerated the collapse. Jump Trading categorically denies the accusations. A company spokesperson stated that the lawsuit is an attempt to shift the blame for the crimes committed by Terraform Labs and its founder, Do Kwon, onto others. Jump stated that the allegations were baseless and that he would defend himself in court. Terraform Labs filed for bankruptcy in January 2024 and shortly after reached a settlement with the SEC for approximately $4.5 billion. The company's founder, Do Kwon, pleaded guilty to the charges and was sentenced last week to 15 years in prison.

Binance Alpha Delists 9 Altcoins from Features
Binance Alpha, a platform aiming to highlight experimental projects within the Binance ecosystem, underwent a significant listing update as of December 19, 2025. According to an official statement from Binance, the tokens BUZZ, DARK, FROG, GORK, MIRAI, PERRY, RFC, SNAI, and TERMINUS are being removed from the Binance Alpha showcase. This decision was made following regular reviews of the projects featured on the platform.Binance Alpha Announces Removal of 9 AltcoinsBinance reminded that the Alpha platform, by its nature, hosts early-stage or experimental projects with higher risk, emphasizing that these projects are expected to meet certain quality, transparency, and user security standards. The evaluations revealed that these tokens were not compliant with Binance Alpha criteria. However, it was also underlined that this decision does not mean the tokens are completely removed from the Binance ecosystem. According to the announcement, the removal of the relevant tokens from the "featured assets" list on Binance Alpha took effect on December 19, 2025, at 10:00 AM UTC. However, users can still sell these assets. Sales transactions can be carried out via the Market tab in Binance Wallet or by following the path Asset > Alpha within Binance Alpha. In other words, access is not restricted; only visibility in the Alpha showcase ends. Looking at the delisted tokens, it's clear that most are community-focused, meme-based, or early-stage experimental projects. Tokens like BUZZ and FROG gained attention through their social media engagement and short-term hype. DARK and GORK stood out more for their anonymous team structures and limited technical documentation. Projects like MIRAI and TERMINUS, while attracting attention with their AI or future technology themes, raised questions about sustainable product development and transparent roadmaps. In the case of PERRY, RFC, and SNAI, factors such as low liquidity, limited user base, and irregular project updates are considered to have played a role. Binance has repeatedly emphasized that price volatility can be very high in such projects, and users may experience sudden value losses. The decision to remove them from the Alpha listing is stated to be a direct step towards mitigating these risks.In its statement, Binance reiterated that user protection is a priority. It was stated that tokens on the Alpha platform carry "higher risk than normal" and are susceptible to sharp price fluctuations. Therefore, it was emphasized that investors should conduct their own research before trading, and thoroughly examine the project teams, token economics, and use cases.On the other hand, Binance added that it will continue to support innovation and keep the Alpha platform open to new, promising projects. Users are advised to follow the official X account of Binance Wallet for updates and announcements regarding new listings.

ETC Comment and Price Analysis - December 19, 2025
ETC /USDT Technical AnalysisAnalyzing the chart of the coin on a daily time frame, we see that ETC is tightly compressed within a descending wedge pattern. The price has been drifting lower inside this pattern for a long time, but in recent candles both volatility and price range have narrowed significantly. This suggests that selling pressure is weakening, but there is still no clear direction. The market is at a decision point.The $12.50–$12.30 zone is the main support area in the short term. The price is currently holding just above this level, which almost perfectly matches the lower boundary of the wedge. As long as this support holds, the possibility of an upward breakout remains alive.On the upside:$13.20–$13.50 is the first key resistance, acting as both horizontal resistance and the upper trend line of the wedge.A strong, high-volume break above this area would confirm an upside breakout and could push the price toward $14.30.After that, $15.80–$16.20 becomes the major target and resistance zone, as it marks the area where the previous decline started.On the downside:Daily closes below $12.30 would trigger a downward breakout of the wedge.In this case, the price could move toward $11.80–$11.60.This zone is the last major support; losing it could accelerate the downtrend.In summary, ETC is highly compressed within a descending wedge. If support holds, a sharp upside move is possible. If $12.30 is lost, downside pressure increases. The next major move will depend on which direction this tight structure breaks. The Falling Wedge These analyses, not offering any kind of investment advice, focus on support and resistance levels considered to offer trading opportunities in the short and medium term according to the market conditions. However, the user is responsible for their own actions and risk management. Morover, it is highly recommended to use stop loss (SL) during the transactions.
PEPE Comment and Price Analysis - December 19, 2025
PEPE/USDT Technical Analysis Descending Wedge Formation Analyzing the chart, we see that PEPE is clearly forming a large descending wedge pattern on the long term chart. For months, the price has moved lower with lower highs and gradually slowing lows, and it is now compressed very close to the lower boundary of the wedge. The drop in volatility and smaller candle sizes suggest that selling pressure has weakened, but there is still no clear confirmation of a trend reversal.The main balance and support zone in this structure is $0.00000400–$0.00000380. The price is currently trying to hold just above this area. This zone is important both psychologically and technically, as it represents the base of the pattern. As long as this support holds, the descending wedge keeps the potential for an upside breakout alive and can be seen as the “final compression” area in the long-term structure.On the upside, the move is expected to be gradual:The first area to watch is $0.00000510–$0.00000550, which acts as a short-term balance zone.If the price holds above this area, momentum could build toward $0.00000670–$0.00000830.The most critical resistance is the upper boundary of the wedge at $0.00001100–$0.00001600. Without a strong, high-volume breakout above this zone, it is difficult to talk about a long-term trend reversal.On the downside, risk still remains. If the price stays below $0.00000380, the wedge would break to the downside, and a move toward $0.00000280–$0.00000270 could follow. This area represents the last major long-term support, and losing it would seriously weaken the structure.These analyses, not offering any kind of investment advice, focus on support and resistance levels considered to offer trading opportunities in the short and medium term according to the market conditions. However, the user is responsible for their own actions and risk management. Morover, it is highly recommended to use stop loss (SL) during the transactions.
BNB Comment and Price Analysis - December 18, 2025
BNB Technical AnalysisBNB Chain is set to launch its own stablecoin. The goal of this token is to increase liquidity within the network and make money flow more easily between applications on BNB Chain. This move could support not only DeFi and trading volume, but also allow users to move more smoothly between different services on the same chain. A native stablecoin would strengthen BNB Chain’s goal of building a more independent and comprehensive financial ecosystem. Narrowing Triangle Structure Analyzing the coin chart on the daily time frame, we see that BNB is forming a clear symmetrical triangle. The price is trying to hold this consolidation by finding support at the Fibonacci 0.618 level. After the recent drop, the $820–$800 zone acted as a strong demand area, as it overlaps with both the 0.618 Fibonacci level and the rising lower trend line. The bounce from this area suggests that selling pressure is weakening and buyers are still active.The $820–$800 zone is the key level in the short term. As long as the price stays above this area, the triangle structure remains valid and the chance of an upward breakout stays alive. On the upside, the first important resistance is $900–$910. This zone is both a horizontal resistance and close to the upper trend line of the triangle. A clear breakout and daily closes above this level could open the way toward $940, followed by the $1,000–$1,030 range. The $1,020–$1,038 area stands out as a major target, as it was a zone of strong selling in the past.Daily closes below $800 would weaken the structure and could push the price toward $780, then $750–$715. Losing this area would confirm a downward breakout of the triangle and could lead to a deeper decline.In summary, BNB is in a decision phase, consolidating above the Fibonacci 0.618 support. If support holds, an upside breakout is possible; if it fails, selling pressure is likely to increase.These analyses, not offering any kind of investment advice, focus on support and resistance levels considered to offer trading opportunities in the short and medium term according to the market conditions. However, the user is responsible for their own actions and risk management. Morover, it is highly recommended to use stop loss (SL) during the transactions.
What is Plume (PLUME)?
Plume (PLUME) is an EVM-compatible network that aims to bring real-world assets (RWA) onto the blockchain and connect them with the DeFi world. In short, traditional assets such as real estate, private loans, and commodities can be tokenized on Plume, making them easier to buy, sell, and use as collateral in the crypto ecosystem. The project emphasizes the trust and compliance needed, especially on the institutional side; by considering controls like KYC/AML at the infrastructure level, it strives to offer both regulatory compliance and the 24/7 operational nature of the blockchain. Thanks to EVM compatibility, smart contracts and DeFi tools from Ethereum can be more easily migrated to the Plume ecosystem. Let's take a look at what PLUME is and what the PLUME coin is used for.Definition and Origins of PLUMEIn its simplest form, you can think of Plume as "a bridge between real assets and the crypto world." But it's not just about digitizing assets; Plume's main goal is to convert real-world financial instruments into tokens, giving them crypto-specific flexibility. So these assets become programmable; they can be bought and sold, transferred between wallets, used in DeFi protocols, and even used as collateral to borrow money. This is where Plume's "RWAfi" claim comes in: integrating real assets into the flow of DeFi. The project's starting point stems from this need. In 2024, seeing the growing interest in RWAs and the gap in the market, the team embarked on a journey to combine the transparency and 24/7 transaction advantages of blockchain with the massive asset classes of traditional finance. Plume Network's co-founders, Chris Yin (CEO) and Teddy Pornprinya (CBO), began developing an infrastructure where RWAs would be integrated into the crypto world in a "demand-driven" manner. Chris Yin's experience in technology startups and venture capital, and Teddy Pornprinya's background in business development at large structures like Binance and Coinbase, ensured the project had a strong sense of direction from the very beginning. During its establishment, the Plume team quickly attracted investor interest. In a Series A round in late 2024, they received a total of $20 million in investment from prominent institutions in both traditional and crypto finance, such as Brevan Howard, Galaxy Digital, and Apollo Global Management. This support provided a crucial foundation for infrastructure development and regulatory preparation. It is noteworthy that Plume has been focused on "compliance" from the very beginning; the team aimed to prepare a white paper compliant with the MiCA regulation and complete the ESMA registration process in mid-2025, thus moving forward with a clearer framework on the European side. In this way, Plume positioned itself as a "prepared" RWA blockchain both technologically and regulatoryly. PLUME's History: Key MilestonesAlthough Plume is still a relatively young project, it has managed to attract attention with the steps it has taken and the momentum it has gained in a short time. Below, we have summarized Plume's journey to date in a more fluent way, along with its prominent milestones:2024 - Establishment and first investment: Plume Network was officially established in 2024. According to information shared in December 2024, the project completed its first investment round of $20 million with the goal of building a real asset finance (RWAfi) focused ecosystem. The participation of institutions with significant weight in both traditional and crypto finance, such as Apollo Global Management, Brevan Howard, and Galaxy Digital, in this funding round demonstrated that Plume had already gained considerable institutional trust from the outset.January 2025 - Testnet “Season 1” and community engagement: At the beginning of 2025, Plume launched a comprehensive testnet process called “Season 1,” directly engaging the community. During this process, over 18 million wallets were created and over 280 million transactions were processed. These figures, quite high for a new network, clearly demonstrated the interest in the project. Early users who participated in the testnet were rewarded with the first PLUME token airdrops, and the community foundation was laid during this period.February 2025 - Strategic partnerships (Mercado Bitcoin & Superstate): In February, Plume partnered with Mercado Bitcoin, one of the largest crypto platforms in Latin America, to launch a project in Brazil aimed at tokenizing $40 million worth of assets. During the same period, Superstate, which offers regulated bond funds in the US, selected Plume as its multi-chain expansion partner. This enabled Superstate's short-term US Treasury bond-backed tokens to be integrated into the Plume network, allowing users on-chain access to these products.April 2025 - Strategic investment from Apollo: In April 2025, Apollo Global Management announced a strategic investment in Plume. This move by Apollo, one of the strongest players in the private equity sector, was a significant indicator of institutional confidence in Plume's RWA vision. With this investment, Plume gained significant momentum in strengthening its infrastructure and bringing corporate finance products to the on-chain world. During this period, the Plume ecosystem had incorporated over 200 protocols and applications following the testnet phase.June 2025 - Plume Genesis Mainnet launch: Plume's mainnet, Genesis, officially launched on June 5, 2025. On launch day, over $150 million in tokenized real assets were already active on the network. Integrations with financial giants like Blackstone and Invesco were completed from day one, ensuring Plume's strong start. On the DeFi side, well-known protocols like Curve and Morpho were integrated into the Plume network. In the same month, Plume's MiCA-compliant white paper was approved by EU regulatory authorities, ESMA registration was completed, and the PLUME token became legally listable in Europe.Summer 2025 - Rapid Growth Period: In the months following its mainnet launch, the Plume network experienced significant growth momentum. By September 2025, the total value locked (TVL) on the network exceeded $577 million. During this period, Plume surpassed Ethereum to become the blockchain with the highest number of addresses holding RWA tokens; just weeks after launch, over 100,000 addresses held RWA tokens on Plume. Between July and September 2025, Credbull launched a private loan fund of up to $500 million on Plume. In August, Plume announced that it had successfully tokenized over $1 billion in real assets, bringing them to the on-chain environment. During the same period, carbon credits and environmental assets began to be integrated into the Plume ecosystem through climate-focused partnerships such as Bioeconomy. Autumn 2025 - Corporate Expansion: In October 2025, Plume surpassed a significant milestone in on-chain securities transactions by obtaining a registered transfer agent license from the U.S. Securities and Exchange Commission (SEC). This license paved the way for future areas such as regulated equity issuance, digital funds, and tokenization of publicly traded company shares. During the same period, USDC was natively integrated into the Plume network in collaboration with Circle, and cross-chain stablecoin transfers became smoother thanks to CCTP. Furthermore, Plume was selected for the Mastercard Start Path fintech program, gaining the opportunity to work closely with the global payment ecosystem. As of December 2025, the PLUME token price is hovering around $0.015. Why is PLUME Important?What makes Plume important is not just that it brings RWAs to the blockchain; it does so by centering the speed, flexibility, and efficiency of DeFi. While DeFi largely revolves around crypto assets today, trillions of dollars worth of real-world assets are still held in illiquid, slow, and fragmented structures.Use CasesThe infrastructure offered by Plume creates a very broad use case for both institutional and individual users.Tokenization of Real Assets: Thanks to its tokenization engine called Arc, Plume enables the issuance of real estate, private loan funds, commodities, and alternative assets as digital tokens. These tokens represent ownership or yield of the related asset and are managed by smart contracts. Issuance processes that can take months or even years in the traditional financial world can be completed much faster and at a lower cost on Plume. This provides asset issuers with access to global investors.DeFi Integration and Yield Generation: Plume directly connects tokenized assets with DeFi. Through the Nest protocol, users can deposit stablecoins like pUSD or USDC into RWA vaults and receive nTokens in return. These tokens can be bought and sold within the Plume ecosystem, used for lending, or transferred to other protocols. This allows assets like Treasury bonds, private loans, or carbon credits to generate returns using a DeFi-like staking and farming model. Lending and Trading: RWA-backed borrowing is possible through protocols like Morpho in the Plume ecosystem. Users can borrow stablecoins by using their tokenized assets as collateral. RWA-focused DEXs like Rooster offer liquidity for the buying and selling of various tokenized assets. All these transactions take place transparently on the blockchain, while compliance layers ensure compliance with legal requirements.Access to Institutional Finance: Plume also offers a strong infrastructure for institutional players. Large asset managers such as Apollo, Blackstone, and Invesco can reach a wider investor base by tokenizing their funds through Plume. While custody solutions like Anchorage Digital support the security of institutional assets, the Plume Passport wallet makes it possible to manage identity verification and compliance processes on the blockchain. Thus, institutions can use blockchain technology without compromising regulations.Token EconomyPLUME, at the heart of the Plume ecosystem, is the core token that powers the network and sustains incentive mechanisms. The token economy is designed to both encourage long-term participation and support network security.Maximum supply and distribution: The maximum supply of the PLUME token is limited to 10 billion units. Approximately 20% of this supply was released into circulation with the TGE in January 2025. The remaining tokens are being released gradually with a vesting schedule spread over the long term. 59% of the total supply is allocated to community, ecosystem, and foundation work; this share is used for airdrops, incentive programs, developer grants, and validator rewards. 21% of the supply is allocated to early investors, and 20% to the founding team and core contributors. The fact that team and investor tokens are locked aims to limit early-stage selling pressure. What is the PLUME token used for? PLUME is designed as a versatile utility token on the Plume network. Its primary use is for gas fees paid for transactions and smart contract interactions on the network. In addition, PLUME plays a significant role in governance; in the future, token holders are planned to gain voting rights on protocol updates and network-related decisions. This structure aims for Plume to gradually transition to a more community-oriented governance model. Staking and network security: Plume is a Layer-1 network operating with a Proof-of-Stake mechanism. Validators secure the network by staking PLUME, while users can earn staking rewards by delegating their tokens to validators. With the staking infrastructure expected to be operational by mid-2025, additional reward programs encouraging validator participation have also been launched. This system both strengthens network security and makes long-term PLUME holding attractive. Incentives and Airdrops: Plume used strong incentive programs to accelerate early adoption. During the Season 1 testnet, millions of wallets received PLUME, creating a broad community base. In the Season 2 program, launched after the mainnet, 150 million PLUME were allocated as rewards to participants who used the protocols on the network and provided liquidity. These programs aim to encourage long-term use and ecosystem engagement rather than short-term gains.PLUME Model (Economy, Reserve, and Issuance Mechanics)One of the most important elements that distinguishes Plume from similar projects is its holistic economic model. This structure addresses not only the PLUME token economy but also stablecoins, the issuance process of real assets, and cross-chain liquidity. Network Economy and Consensus: As a Layer-1 blockchain, Plume uses a Proof-of-Stake based structure. Validators secure the network by staking PLUME. While the maximum supply is fixed at 10 billion, instead of issuing new tokens, the majority of incentives are distributed from pre-allocated ecosystem funds. This keeps inflation under control while continuing to incentivize validators and liquidity providers. For example, the 150 million PLUME distributed under Season 2 is part of this model.pUSD stablecoin and reserve structure: pUSD is one of the fundamental building blocks of the Plume ecosystem. Pegged 1:1 to the US dollar, pUSD is fully backed by USDC reserves. Users can mint pUSD by depositing USDC, and can burn pUSD and return to USDC whenever they wish. Thanks to Circle's CCTP integration, cross-chain USDC transfers are fast and seamless. Reserves are managed through the Nucleus infrastructure, and 1 USDC is held in the system as a counterpart for every pUSD. This structure offers a transparent and reliable stablecoin model, free from algorithmic risks. Tokenization of real assets: At the heart of Plume is the RWA issuance process. Institutions wishing to issue tokens go through Plume's compliance layers. Thanks to MiCA compliance and a SEC-registered transfer agent license, even securities can be tokenized within a legal framework. While physical assets are securely held through custodians such as Anchorage Digital and Fireblocks, tokens represent these assets on-chain. The Nexus oracle layer securely transfers real-world data to smart contracts. The portal interface simplifies the issuance process from a technical standpoint as much as possible. PLUME's Developers and LeadershipBehind Plume is an experienced team with deep knowledge of both blockchain and traditional finance. Chris Yin, the project's founder and CEO, established software startups in Silicon Valley before launching Plume, held product management positions at companies like Coupa Software, and then served as an investor in a venture capital fund. Recognizing the potential of DeFi and crypto early on, Yin defines Plume's strategic direction with a vision to innovate, particularly in the area of tokenization of real-world assets. His technology and investment background ensures the project's balanced progress in both product and growth. Teddy Pornprinya, Plume's Co-Founder and Chief Business Officer (CBO), is responsible for business development and strategic partnerships. Having previously worked at leading crypto companies like Coinbase and Binance, Teddy has also gained experience in decentralized exchange projects. This gives him a thorough understanding of both the dynamics of the crypto ecosystem and how to build bridges with traditional financial actors. The influence of Teddy's business development team is clearly visible in deals with major institutions like Apollo and in the acceptance process for programs like Mastercard Start Path. The Plume team isn't limited to the founders. On the legal side, there's B. Salman Banaei (General Counsel), experienced in crypto regulation. On the technical and operational side, Dan Levine (Director of Engineering) and James Friel (Ecosystem Leader) stand out; this team works on scaling the Plume network and growing its developer community. The engineering team includes developers with experience in Ethereum and DeFi. For example, Alp Güneysel, as a Senior Smart Contract Engineer at Plume, plays an active role in the development of EVM-based protocols. On the governance side, the Plume Foundation holds a significant position. The foundation coordinates the network's R&D efforts, long-term growth, and gradual decentralization process. In terms of strategy and global expansion, Shukyee Ma, as Chief Strategy Officer, plays an influential role in both the foundation and the overall direction of the ecosystem. This structure has significantly contributed to Plume's leading position, particularly in initiatives like the Global RWA Alliance. Plume also presents a strong picture in terms of supporters. In addition to investors such as Apollo and Galaxy Digital, experienced advisors from the corporate finance world contribute to the project. Christine Moy, Apollo's Head of Digital Assets, openly supports Plume's vision, and joint projects developed with institutions such as EY and Mastercard strengthen the corporate confidence behind the team.Frequently Asked Questions (FAQ)Below, you can find some frequently asked questions and answers about PLUME:What exactly is Plume (PLUME) and what does it do?: Plume is a blockchain platform that brings real-world assets such as real estate, bonds, and loans to the DeFi ecosystem by tokenizing them. These assets can be bought and sold on Plume, used as collateral, or valued to generate returns. In short, Plume creates a functional bridge between traditional finance and the crypto world.How does the Plume network work?: Plume is an EVM-compatible Layer-1 blockchain and ensures its security with the PLUME staking mechanism. Thanks to modules such as Arc, Nest, Nexus, and Skylink, tokenization, yield, data verification, and cross-chain transfers take place within a single ecosystem. This structure makes Plume a fully-fledged RWA chain.What are the use cases of the PLUME token?: PLUME is used as a gas fee for transactions on the network and contributes to network security through staking. It also offers voting rights in future protocol decisions as a governance token. It can also be considered as a collateral and liquidity tool within the ecosystem.Where and how can I buy Plume (PLUME) tokens?: PLUME is listed on major cryptocurrency exchanges such as Binance and Bybit. Users can buy and sell PLUME on these platforms using pairs like USDT. Access is also possible through decentralized exchanges and wallets thanks to EVM compatibility.How are real-world assets secured on Plume?: Every asset tokenized on Plume is backed by real-world collateral or legal rights and protected by regulated custodians. Regulatory steps such as MiCA compliance and SEC licensing put this process on a legal footing. The KYC-based Plume Passport system also ensures that transactions are carried out in a compliant manner. What do “RWA” and “RWAfi” mean?: RWA refers to the tokenized form of real-world assets. RWAfi, on the other hand, defines a financial model where these assets are bought, sold, staked, and generate returns using DeFi protocols. Plume aims to build an RWAfi infrastructure that offers this approach end-to-end. What differentiates Plume from other projects?: Plume combines a permissionless blockchain structure with regulation-compliant KYC/AML layers. It offers tokenization, stablecoin, liquidity, and cross-chain solutions in a single ecosystem. Furthermore, its strong institutional support and EVM compatibility set Plume apart from similar projects.Discover the latest analyses, use cases, and detailed guides on Plume (PLUME) and other next-generation RWA-focused blockchain projects in the JR Crypto Guide series.

AAVE Comment and Price Analysis - December 18, 2025
AAVE Technical AnalysisAAVE has announced a new strategic roadmap for 2026. After the U.S. SEC officially ended its four-year review, the founder stated that AAVE will focus on three main areas: the V4 protocol upgrade, expansion of the Horizon RWA market, and the launch of a mobile app. These steps show that AAVE aims to grow not only in DeFi lending, but also in real-world assets and broader financial tools. Rising Wedge Formation Analyzing the chart on a daily time frame, we see that AAVE is forming a clear descending wedge. Price action shows increasing pressure toward the lower boundary of this pattern. Though short-term bounces occur, they remain weak, and each recovery attempt is rejected at the upper trend line. This suggests that the risk of a downward breakout is currently higher.The $184–$180 zone is a critical support area in the short term. The price is trying to hold above this level. If daily closes fall below this zone, selling pressure could accelerate. In that case, $175–$172 would be the first target, followed by $162–$155 if the decline deepens.The key resistance zone is $198–$205. As long as the price stays below this area, downward pressure continues. A strong breakout above it could open the way toward $211 and later $230.In summary, AAVE is at a key decision point within a descending wedge. The direction will largely depend on whether the $180 support holds.These analyses, not offering any kind of investment advice, focus on support and resistance levels considered to offer trading opportunities in the short and medium term according to the market conditions. However, the user is responsible for their own actions and risk management. Morover, it is highly recommended to use stop loss (SL) during the transactions.

TAO Commentary and Price Analysis - December 17, 2025
TAO/USDT Technical Analysis Falling Channel Structure Bittensor is a project standing out at the intersection of cryptocurrency and artificial intelligence. The network completed its first halving in December 2025, cutting the new TAO supply entering the market by half. Events like this can theoretically support the price in the long term. In addition, institutional investment products such as the Grayscale Bittensor Trust have started to appear, putting TAO on the radar of not only retail investors but also large capital.These fundamental developments indicate that TAO is not just an “AI-themed coin,” but an asset with growth potential supported by a new supply mechanism and increasing institutional interest.Analyzing the chart on a daily time frame, we see that TAO is clearly moving within a descending channel. Following a strong sell-off, the price pulled back to the lower boundary of the channel and is currently trying to bounce from this area. However, every upward attempt has been met with selling pressure near the upper side of the channel, meaning the main trend is still bearish.The $248–$250 zone is the first support area in the short term. Short-term bounce attempts should be considered normal as long as the price holds above this level, However, these moves should be seen as relief rallies, not a trend reversal. The most critical resistance lies at $278–$280 above. This area is both a strong horizontal resistance and the upper boundary of the descending channel. Rallies toward this zone may create short-selling opportunities within the current structure.Selling pressure is likely to return, with a possible pullback toward $262–$255, and then $249–$245 if the price fails to break above $278–$280 and shows weakness there, The natural price action within the channel also supports this scenario.The price needs to break above $288–$292 with strong volume and exit the channel for a bullish scenario to be taken seriously. Until this happens, the descending channel remains intact, and rallies are likely to be treated as selling opportunities. In summary, TAO is bouncing within a downtrend, but the overall structure has not changed. The $278–$280 zone is the key level that will determine the direction of this move.These analyses, not offering any kind of investment advice, focus on support and resistance levels considered to offer trading opportunities in the short and medium term according to the market conditions. However, the user is responsible for their own actions and risk management. Morover, it is highly recommended to use stop loss (SL) during the transactions.
What is Plasma (XPL)?
Plasma (XPL) is a high-performance Layer 1 blockchain network specifically developed for stablecoin transactions. In other words, Plasma aims to make stable cryptocurrencies (such as USDT) as fast, low-cost, and accessible as digital cash. Launched in 2025, this project has recently been making headlines in the crypto world. In this guide, we will answer questions such as what is Plasma coin, how did it come about, what technologies is it based on, what are its use cases, how does the token economy work, and what advantages does it offer to individual users, in simple language.Definition and Origins of PlasmaWhat is the Plasma network? Plasma is an independent blockchain designed from scratch to facilitate stablecoin transfers. That is, it is not a sidechain or scaling solution of an existing chain like Ethereum; it is a completely separate blockchain network with its own infrastructure. This network aims to be the fundamental infrastructure for stablecoin circulation on a global scale, while prioritizing low transaction fees, high speed, and a user-friendly experience. What were the purposes behind the development of Plasma? The motivation behind the project's emergence is closely related to the growing role of stablecoins in the crypto ecosystem. In recent years, the supply of stablecoins has reached hundreds of billions of dollars, while monthly transaction volumes have begun to exceed trillions of dollars. However, existing blockchains, designed before the widespread use of stablecoins, suffer from problems such as high transaction fees, slow confirmation times, and a lack of specialized features for digital dollar transfers. Plasma emerged to address these inefficiencies; it aims to provide an infrastructure that will eliminate the friction experienced in stablecoin payments, acting as a dedicated highway.What is its technological infrastructure? Technically, Plasma is based on a modern and innovative architecture. It uses an improved variation of the HotStuff protocol called PlasmaBFT as its consensus mechanism. This ensures transaction finality in a very short time (less than 1 second) on the blockchain and can reach a capacity of over 1,000 transactions per second. In other words, the network has the speed and scalability required for real-time payment transactions. At the execution (smart contract) layer, Reth, a high-performance Ethereum client written in Rust, is used. This makes Plasma fully EVM compatible; developers can deploy Solidity smart contracts to the Plasma network without any modifications, and users can connect popular wallets like MetaMask to Plasma without using extra tools. In short, Plasma offers an infrastructure compatible with Ethereum while creating much faster and cheaper transaction capabilities in the background through its own consensus and optimization processes. Another innovative aspect of Plasma is its solution to gas fees. On most blockchains, even sending a token requires acquiring the main currency of that chain (e.g., ETH on Ethereum) to cover the gas fee. Plasma eliminates this barrier by using a system called Paymaster (Fee Sponsor). Through this mechanism, the protocol itself or decentralized applications allow users to pay transaction fees with stablecoins like USDT, or even subsidize the fee entirely. This means you don't need to hold XPL tokens in your wallet to make a basic USDT transfer on Plasma; the network will fund it from its own XPL budget if needed, or you can pay directly with USDT. This approach makes stablecoin usage extremely practical and seamless, even for users new to crypto or with little technical knowledge.Plasma's History: Key DevelopmentsWe can examine the milestones Plasma has reached since its launch as follows:Launch process: The Plasma project rapidly developed throughout 2025 and reached its mainnet in the third quarter of the year. The foundations of the project were laid with strong funding and support. In February 2025, a seed and Series A funding round of approximately $24 million was completed, led by industry giants such as Framework Ventures and Bitfinex (the operator of Tether). This funding round also included significant market players such as DRW/Cumberland, Bybit, Flow Traders, 6th Man Ventures, and Nomura; and well-known names such as Tether CTO Paolo Ardoino and Peter Thiel provided support as individual angel investors. This strong start ensured that Plasma gained significant trust both in the crypto sector and in traditional finance circles. Testnet and Mainnet: Following an intensive development process, the Plasma testnet went live in July 2025. The anticipated mainnet launch then took place on September 25, 2025. With the mainnet launch, Plasma's own cryptocurrency, the XPL token, began listing on major exchanges. On launch day, the amount of stablecoins entering the ecosystem reached a striking level of $2 billion; the market capitalization of the XPL token exceeded $2.4 billion on the first day, and its price rose to $1.54. By the end of the first week, the total value locked (TVL) on the Plasma network surpassed $5.5 billion, demonstrating the market demand for a purpose-built stablecoin infrastructure. Thanks to this impressive start, XPL emerged as one of the most valuable new crypto assets in 2025. Network improvements: The deployment of the Plasma mainnet brought with it significant technical features. For example, the Plasma team announced a unique integration called the Bitcoin bridge (BTC bridge). This allows users to securely and decussively transfer their BTC to the Plasma network, converting it into 1:1 collateralized wrapped BTC tokens called pBTC, which they can then use in smart contracts on Plasma and convert back to real BTC. This trust-minimized BTC bridge expands Plasma's capabilities by providing direct Bitcoin liquidity to decentralized finance (DeFi) applications. The team also announced they are working on a Confidential Payments module for privacy-focused transactions. When this feature is implemented, data such as transaction amount and recipient information can be hidden without compromising existing wallets and compatibility, providing a certain level of privacy in stablecoin transfers. The Confidential Payments feature is still under research and development and is planned to be added to the network in a future update. Ecosystem Growth and Adoption: Plasma experienced rapid adoption in the period following its mainnet launch. Many decentralized applications and protocols have sought to integrate with Plasma to speed up and reduce the cost of stablecoin transactions. For example, Aave, a leading global DeFi lending protocol, launched its own money market on Plasma. Within 48 hours of its launch, $5.9 billion worth of deposits flowed into Aave pools on Plasma, peaking at $6.6 billion in TVL in mid-October. This made Plasma the second-largest market for Aave after the Ethereum mainnet, quickly establishing it as a significant player in the global lending market. Similarly, the Binance exchange began supporting the Plasma network, offering its users on-chain USDT yield products. Listings on major exchanges (such as Binance, OKX, and Bybit) and community-focused airdrops have rapidly increased the adoption rate of the XPL token. As of December 2025, XPL coin price is estimated to be around $0.13. Why is Plasma Important?The Plasma project stands out in the crypto world for focusing on a specific problem and offering innovative solutions. While traditional blockchains have various obstacles in the use of stablecoins as a daily payment method, Plasma removes these obstacles, providing benefits across a wide range of applications, from Web3 integration to real-world financial applications. Below, we detail Plasma's importance under the headings of use cases and token economics to better understand it. Use CasesWeb3 Integration: Plasma is a network that can easily integrate into the Web3 ecosystem thanks to its compatibility with the Ethereum Virtual Machine (EVM). Developers can migrate existing Ethereum smart contracts or decentralized applications (DApps) to Plasma with minor changes, thus offering their users faster and cheaper transactions. Especially when stablecoin-based applications (e.g., decentralized exchanges, lending protocols, payment dApps) run on Plasma, scalability and fee issues encountered on general-purpose chains like Ethereum are minimized. This also gives Web3 projects the opportunity to reach wider audiences and get closer to real-world use. Indeed, the adoption of Plasma by large DeFi protocols like Aave proves how attractive the network is as an infrastructure for Web3 applications. On-chain payment systems: Plasma's most obvious use case is on-chain payment and remittance systems. Although stablecoins are considered suitable for daily payment methods due to their stable value, using them on most blockchains involves high transaction fees and technical complexity. Plasma solves this problem by allowing USDT transfers with near-zero fees. For example, a user can send USDT to the other party in seconds and almost for free on the Plasma network – without needing to hold XPL in their wallet, paying the transaction fee directly with USDT. In this way, the Plasma network provides an extremely suitable platform for scenarios such as remittance (international money transfer), receiving stablecoin payments in e-commerce, in-game payments, or micro-payments. The fact that transactions are instantaneous (sub-second finality) and costs are negligible makes stablecoin payments truly as easy as "sending a message". Plasma's website shows near-zero transaction fees and quick transaction times in this way. Real-world applications: The Plasma team has a vision to integrate blockchain technology with real-world financial systems. They not only offer a technical infrastructure but also develop user-friendly solutions. For example, they announced Plasma One, a stablecoin-focused neobank and card product. This application allows users to directly use their USDT balances on the Plasma network for daily expenses, essentially experiencing a bank account and debit card. Furthermore, the Plasma foundation is collaborating with traditional payment providers and financial institutions to license its payment technology. This means that in the future, Plasma's infrastructure could operate in the background, unknowingly powering the financial transactions of millions of people using stablecoins. In short, Plasma's potential real-world applications include a wide range of services such as international money transfers, commercial payments, savings and lending (via DeFi), and even providing infrastructure for government-backed digital currency projects. The project's founders believe that mainstream adoption of stablecoins is only possible with such a robust and user-friendly infrastructure. Plasma One tanıtım görseli. Token EconomyXPL, the native cryptocurrency of the Plasma network, forms the backbone of the network's economy. The total supply is set at 10 billion XPL. This supply is distributed across various categories to create a fair and sustainable ecosystem: 10% is allocated to the public token sale, 40% to ecosystem and growth funds, 25% to the founding team and employees, and 25% to investors and strategic partners. Specific lock-up periods and a staggered vesting schedule are applied to team and investor shares to prevent sudden, heavy selling pressure on the market. Similarly, a 12-month lock-up period is foreseen for tokens acquired from the public sale, particularly for US users. XPL'in token dağıtım grafiği. Staking and Reward Structure: Plasma is based on Proof of Stake consensus, so the network's security and continuity are ensured by staking XPL tokens. Participants who want to become validators lock a certain amount of XPL on the network to verify blocks and earn rewards for this service. One of the notable aspects of Plasma's staking system is its reward inflation model. Initially, the XPL inflation rate is 5% annually, but it is reduced by 0.5% each year, eventually reaching 3%. This inflation is distributed to validators as new block rewards, thus maintaining strong early security incentives while preventing the total supply from becoming excessively inflated over time. Plasma also implements a unique penalty (slashing) method for validators who make mistakes. In this model, called "soft slashing," validators who make mistakes only lose their rewards for that period as a penalty, but their staked principal remains untouched. This system secures the network while also offering a more forgiving approach for validators. Furthermore, it provides delegation opportunities for small investors or users without technical expertise: XPL holders can delegate their tokens to a validator, participate in the staking process through them, and receive a proportional share of the rewards. Thus, contributing to network security and generating passive income has become a process accessible not only to large players but also to ordinary users. In-use incentive mechanisms: The Plasma ecosystem doesn't position the XPL token solely as a "gas fee payment tool." XPL also plays a role in governance and ecosystem incentives within the network. XPL holders will be able to participate in future network governance voting, submit suggestions, and have a say in shaping the project's direction. Ecosystem funds (40%) reserved for developers and contributors can be distributed as rewards and grants to parties developing applications and contributing to growth on the network. For example, to accelerate Plasma adoption, programs such as transaction fee campaigns, liquidity mining incentives, or hackathon rewards can be funded from the XPL budget at certain periods. Indeed, during the Aave integration, the Plasma Foundation allocated $10 million worth of XPL as an incentive to attract liquidity to the Plasma version of Aave, significantly accelerating deposit flow. Finally, the ability to pay gas fees with stablecoins on the Plasma network is also an indirect incentive mechanism; since users do not have to spend XPL on basic transactions, the barrier to entry to the network is low, which increases usage rates. In short, the XPL token economy has a multifaceted structure that both secures the technical operation of the network and incentivizes usage and growth.Plasma's Developers and LeadershipBehind the Plasma project is a team with experience in the crypto and finance world. The founding team consists of a strong and diverse group of experts in technology and finance. Team members include individuals who have worked as software engineers at tech giants like Apple and Microsoft, financiers with high-frequency trading (HFT) experience at institutions like Goldman Sachs, and academics who have conducted research on distributed systems at Imperial College London and Los Alamos National Lab. Furthermore, individuals who have previously played active roles in major stablecoin and blockchain projects and are experts in the sector are involved in Plasma's development. This ensures that Plasma is managed by a team with a solid foundation in terms of technical competence and industry knowledge. The development and growth of the project relies not only on the internal team but also on a broad developer community. As an open-source ecosystem, Plasma is open to developers contributing from around the world. Smart contract developers, wallet and tool providers, node operators, and independent researchers can contribute to the Plasma project through its Github repository and test networks. For example, wallet developers like OneKey quickly integrated Plasma and began offering XPL support in their wallets. This community-focused approach played a critical role in the network's rapid adoption. Furthermore, the Plasma Foundation provides technical documentation, SDKs, and incentive programs to support the developer community. Developer events, testnet bounty programs, and hackathons are organized to keep the ecosystem vibrant. Project Vision and Roadmap: Plasma's vision is to become a significant part of the global financial infrastructure in the stablecoin era. Tether CEO Paolo Ardoino emphasized that a secure, scalable, and decentralized infrastructure is essential for stablecoin adoption to explode into the mainstream, and that Plasma is designed to meet precisely this need. The team aims for Plasma to become the "chain where digital dollars are assumed to move" in the long term. In this context, the roadmap includes both technical improvements and adoption-focused steps. Upcoming goals include implementing privacy features (Confidential Payments), building bridges with more assets and networks (e.g., integrations with different stablecoin issuers, multi-chain support for Ethereum and other L1/L2 networks), and transitioning to community governance to achieve a fully decentralized network. Furthermore, work continues on launching end-user products like Plasma One to increase real-world usage, collaborations with traditional financial institutions, and regulatory compliance. In short, the Plasma team is focused on both pursuing technological innovation and building the necessary bridges for integrating stablecoins into daily life.Frequently Asked Questions (FAQ)Below you can find some frequently asked questions and answers about Plasma:Which exchanges list Plasma (XPL)? The XPL token has been listed on a number of major cryptocurrency exchanges since its launch. The highest volume trading platform is Binance, where XPL/USDT is one of the most active trading pairs. In addition, XPL can be traded on popular exchanges such as OKX and Bybit. Some regional exchanges and decentralized exchanges have also listed it. In general, XPL has high liquidity and wide accessibility; having various pairs such as USDT, USDC, BNB, and TRY on major exchanges makes it easy for different user segments to access XPL. How to stake XPL? The Plasma network operates with a staking mechanism. XPL holders can participate in the staking process in two ways. Users with the necessary technical competence and collateral can become validators by running a node; Users validate transactions, generate blocks, and earn XPL rewards. Those who don't want to run their own node can delegate their XPL to an existing validator and share in the rewards. Staking can be done through Plasma's official dashboard, the Plasma One application, or supporting wallets and exchanges. Rewards are distributed according to an inflation model; approximately 5% annually in the first few years and decreasing over time. Thanks to Plasma's soft slashing model, if an incorrect validator is selected, only the rewards are cut off, the principal is protected. Which wallets are compatible with Plasma? Since Plasma is EVM compatible, it can be used with many Ethereum-supported wallets, primarily MetaMask. Users can manage their XPL and on-net assets by adding the Plasma network's RPC information to their wallets. Hardware and multi-chain wallets like OneKey offer Plasma integration, while wallets like Trust Wallet and Coin98 are also expected to provide support. Furthermore, the Plasma team plans to provide an integrated wallet experience with the Plasma One application. This allows users to easily access the Plasma network without learning a new wallet. Which networks does it operate on? Plasma operates as an independent mainnet; XPL is the native token of the Plasma blockchain, not on another chain. The goal is not to replace existing networks, but to provide a specialized infrastructure for stablecoin transactions. Plasma also has a multi-chain structure. Thanks to bridges like LayerZero, USDT on Ethereum and Tron can be moved to Plasma. USD₮0 issued by Tether on Plasma facilitates cross-network stablecoin transfers, while the Bitcoin bridge integrates BTC into the Plasma ecosystem. This structure allows stablecoin liquidity to circulate freely between different blockchains. What are the advantages for individual users? Plasma (XPL) offers a low-cost and fast blockchain experience for individual users. Transaction fees for basic stablecoin transfers are negligible; there is no requirement to hold XPL when sending USDT, and fees can be paid directly with stablecoins. Thanks to sub-second finality, transactions are almost instantaneous. Ethereum compatibility allows continued use of popular wallets like MetaMask. With the evolving ecosystem, it's becoming possible to earn stablecoin returns through DeFi protocols like Aave, while XPL staking and delegation options offer passive income opportunities. In these respects, Plasma provides a practical, fast, and accessible blockchain infrastructure for individual users. Don't forget to check out other articles in the JR Crypto Guide series for similar comprehensive guides on important projects in the crypto world.

BNB Chain is preparing to launch its own stablecoin
BNB Chain has taken a significant step toward expanding its on-network financial infrastructure by preparing to launch its own native stablecoin. An official announcement on December 17, 2025, confirmed the development of a new stable asset with low volatility and targeting widespread adoption across the BNB Chain ecosystem. While the stablecoin's name and a clear launch schedule have not yet been shared, this move is seen as part of BNB Chain's strategy to strengthen liquidity, enhance security, and reduce reliance on external stablecoin bridges. BNB Chain Launches Its Own StablecoinBNB Chain management states that the planned stablecoin aims to unify different use cases across the ecosystem under a single liquidity layer. Launching its own native stablecoin aims to eliminate the bridge risks frequently encountered with cross-chain stablecoins. This ensures liquidity remains entirely on-chain, increasing transaction efficiency and preventing security vulnerabilities that may arise from external infrastructure.The new stablecoin is expected to play a critical role in decentralized finance applications. Trading on decentralized exchanges like PancakeSwap, lending and borrowing protocols, yield farming, and on-chain payment solutions are among the prominent use cases. BNB Chain plans to make this asset a fundamental building block of daily on-chain activities, not just for a specific niche. This approach signifies a more holistic financial model that places the stablecoin at the center of the ecosystem. Following the announcement, a significant wave of speculation arose within the crypto community. The fact that former Binance CEO Changpeng Zhao (CZ) follows an account on the X platform linked to a stablecoin project called "U" has led to speculation that the new stablecoin might be related to this project. However, neither BNB Chain nor CZ has officially confirmed this. It is also noted that Zhao has previously warned that social media interactions do not imply support or partnership. At this stage, the name, branding, and potential collaborations of the stablecoin remain unclear. However, some sources suggest that the stablecoin, codenamed "U," will be launched on December 18th and is structured around the principles of "Unified, Inclusive, Fluid." The project claims to prioritize security and liquidity with a comprehensive reserve management framework. Despite this, there is no direct link to this project on BNB Chain's official channels. Therefore, investors and developers need to wait for official announcements to see the clear picture. BNB Chain has not yet shared critical details regarding the design of the new stablecoin. Whether the asset will be fiat-backed, crypto-collateralized, or algorithmic remains unclear. The launch date is also not yet finalized. Network management emphasizes that users should only follow official BNB Chain announcements and technical documentation.

Bitwise Makes 10 Critical Crypto Predictions for 2026
Bitwise CIO Matt Hougan, in his comprehensive assessment of 2026, argued that the crypto market is entering not just a price cycle, but a structural transformation. According to Hougan, the next two years mark a period where the established patterns will become obsolete for the entire crypto ecosystem, especially Bitcoin. Bitwise's 10 predictions show the areas where this transformation will be concentrated.Bitwise's 10 predictionsThe first and most striking prediction is that Bitcoin will break the classic four-year cycle. According to Hougan, Bitcoin will reach a new all-time high in 2026, and the historically established model of "three years of uptrend, one year of downtrend" will become invalid. Although the fact that the last halving occurred in April 2024 strengthens the expectation that 2026 will be a year of decline, Bitwise does not agree with this view. According to the company, 2026 will be a year of uptrend, contrary to expectations.The second prediction concerns Bitcoin's volatility. Bitwise predicts that Bitcoin's volatility will be even lower than high-volume technology stocks like Nvidia in 2026. This is interpreted as a sign that Bitcoin is gradually transforming into a more mature and stable asset class.The third point focuses on ETFs. According to Bitwise, spot ETFs will purchase more than 100% of the new BTC, ETH, and SOL supply released to the market. This prediction shows that institutional demand could reach a level that is not only strong but also exceeds supply.The fourth prediction is that crypto-related company stocks will outperform technology stocks. Crypto-focused companies such as mining firms, exchange operators, and infrastructure providers are expected to outperform classic technology stocks.Fifth is Polymarket. Bitwise predicts that open positions on the decentralized prediction platform Polymarket will reach an all-time high. This indicates a significant increase in interest in on-chain prediction markets.The sixth prediction concerns stablecoins. According to Bitwise, stablecoins will be cited as one of the main causes of currency instability, especially in developing countries. The acceleration of the flight from local currencies could bring the use of stablecoins to the center of political and economic debates.The seventh prediction focuses on on-chain vaults and asset management. Bitwise expects assets managed in on-chain vaults to double by 2026. This growth is linked to the increased adoption of DeFi by institutions.The eighth prediction is related to the legal framework for crypto in the US. If the US passes a crypto market structure law, according to Bitwise, Ethereum and Solana could reach new all-time highs. Regulatory clarity is considered critical, especially for smart contract platforms.The ninth prediction is quite ambitious. Bitwise suggests that all Ivy League universities will direct at least half of their endowment funds directly or indirectly to crypto assets. This step could be a significant turning point in terms of the academic and institutional legitimacy of crypto. The tenth and final prediction is that the ETF trend will continue unabated in the US. Bitwise forecasts that more than 100 altcoin ETFs could be launched by 2026. This development could allow the crypto market to offer a much wider range of investment products.

SEC Backs Down, Aave Shifts Gears for 2026
The U.S. Securities and Exchange Commission (SEC) has officially closed its nearly four-year investigation into Aave Protocol without making any sanctions recommendations. This decision removes some of the long-standing regulatory uncertainty surrounding DeFi projects, both specifically regarding Aave and generally. Aave founder and CEO Stani Kulechov confirmed the SEC's closure in a public statement. This marks the end of the investigation, which began in late 2021 and early 2022 as part of a wave of increased oversight of DeFi protocols. During this process, the SEC focused on protocols offering lending, borrowing, and liquidity services without intermediaries, moving beyond centralized exchanges. While the SEC did not publicly disclose the scope of the investigation, market observers believed the focus was on whether the AAVE token could be assessed under U.S. securities laws and whether the protocol's operations were subject to registration requirements. The Aave team cooperated with regulators throughout this period, maintaining contact with SEC personnel for years. In June 2025, a meeting between Aave representatives and the SEC's Crypto Task Force was a significant milestone in this process.The closure of the investigation without sanctions was announced via a notification letter, codenamed "HO-14386," issued in accordance with standard SEC practice. The letter stated that agency personnel did not plan to recommend any sanctions at this stage, emphasizing that the decision did not constitute an "acquittal" and that there was no legal obstacle to reopening the case in the future.On the market front, the development had a positive impact on the AAVE price in the short term. The token rose to $194 during the day before falling to $184. From the perspective of Aave users, the decision allows the protocol to continue its operations without the risk of sudden sanctions from the US. At the same time, the reduction in regulatory uncertainty surrounding the platform's core products strengthens user confidence and expectations of short-term stability.On the other hand, the Aave case became the latest in a series of high-profile crypto investigations closed without charges throughout 2025. In December, Ondo Finance also announced the end of its multi-year SEC investigation into tokenized real-world assets and the ONDO token. The dismissal or withdrawal of cases against many major players such as Coinbase, Kraken, Robinhood, OpenSea, Uniswap Labs, Consensys, and Crypto.com signals a significant shift in the SEC's approach. This shift came alongside a leadership transformation within the institution and a move away from "regulation through litigation" to clearer policy guidance.Aave's 2026 RoadmapImmediately following the SEC decision, Stani Kulechov also shared Aave's 2026 roadmap with the public. Kulechov stated that although 2025 will be the "most successful year" to date for the platform, Aave's potential is only just beginning. The 2026 plan rests on three main pillars: Aave V4, Horizon, and the Aave App.Aave V4 aims to offer a comprehensive update, from lending and borrowing pools to the user interface, liquidation parameters, and cross-chain liquidity structure. Designed with a Hub and Spoke model, this structure aims to pave the way for customizable marketplaces connected to a central liquidity pool. On the Horizon side, strong growth is targeted in the real-world assets (RWA) sector; the current net deposits of $550 million are planned to exceed $1 billion in 2026. On the mobile side, the Aave App is expected to reach a wider audience, making DeFi accessible to mainstream users. In addition to all these announcements, Kulechov also revealed that he personally purchased approximately $9.8 million worth of AAVE.

SHIB Comment and Price Analysis - December 16, 2025
SHIB/USDT Technical OutlookShiba Inu (SHIB) has been drawing attention again in recent days. Coinbase has launched futures trading for SHIB. This is an important step that could increase investor interest. In addition, cards that allow payments with SHIB have started to be used in some regions. This makes it easier for the token to be used in daily life. The fact that whales continue to accumulate SHIB shows that some investors trust its long-term potential.From a technical perspective, the price has been moving within a descending channel for some time, and recent price action is hovering close to the lower band of the channel. Reactions occur, but every upward attempt faces selling pressure as it approaches the upper trend line. This indicates that the downside pressure has not yet completely ended and that the market is still not fully under buyers’ control.In the short term, the 0.00000775 – 0.00000780 band is in a critical support position. The price is currently trying to hold just above this region. Since this area has previously produced reactions, it remains technically important. As long as this support is preserved, the potential for a reaction rally within the descending channel remains on the table.In the upside scenario, the first area to watch is the 0.00000835 – 0.00000850 band. This region corresponds to both a horizontal resistance and the mid-band of the channel. If this area is surpassed, it is possible for the price to attempt a move toward the 0.00000880 – 0.00000920 range. The truly critical zone, however, is the 0.00000960 – 0.00001020 line where the upper band of the descending channel passes. Without a high-volume break above this area, it is difficult to say that the trend has been broken.On the downside, if closes occur below 0.00000775, selling pressure accelerates again and the price may slide toward the 0.00000720 – 0.00000700 band. Since this region is the lower extension of the channel, it acts as a last line of defense. In summary, SHIB is at a decision zone within the descending channel. If support holds, a reaction may come; if it breaks, the decline deepens. What will clarify the direction here will be the breakout within the channel. Falling Channel Structure These analyses, which do not provide investment advice, focus on support and resistance levels that are thought to create short- and medium-term trading opportunities depending on market conditions. However, the responsibility for trading and risk management belongs entirely to the user. In addition, it is strongly recommended to use stop loss for the positions shared.