
SHELL Technical Analysis
Analyzing SHELL chart on a daily time frame, we can clearly see that there is a descending channel pattern. The price of the coin bounced from the lower border of the channel and has now reached the upper border of it. This level intersects with the short-term downtrend line and the horizontal resistance level $0.1450–$0.1500, which worked as a resistance previously. We will get the first signal of the trend shift technically if we can see daily closings above the range between the levels $0.1450–$0.1500.
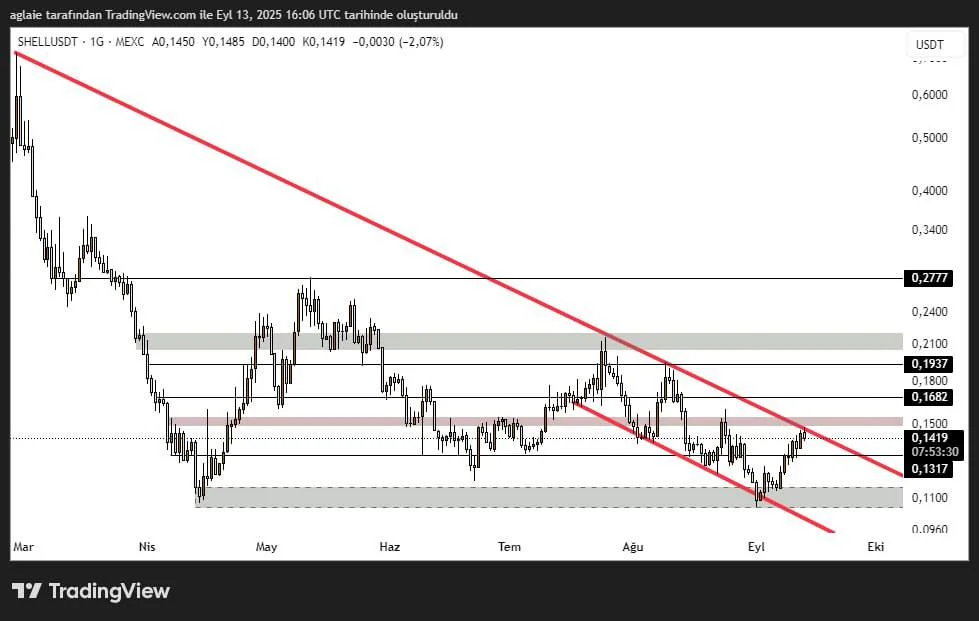
It is clearly seen on the chart that the level $0.1317 has played a crucial role for some time via support/resistance flips. SHELL is currently trading at around the level $0.1420, and the next horizontal resistance levels $0.1682, $0.1800, and the zone between the levels $0.1937–$0.2100 would be the targets if the price can hold above $0.15. The door for a wider bullish structure on the weekly chart could be opened if we see a daily close above $0.1937.
According to a bearish scenario, the price could pull back to the support area $0.1317–$0.1350 if it gets rejected from the resistance and the channel’s upper border. We should be following this zone in particular as it aligns with both the channel’s midline and horizontal support. The range between the levels at $0.1200–$0.1100 could be retested in case of a deeper correction.
These analyses, not offering any kind of investment advice, focus on support and resistance levels considered to offer trading opportunities in the short and medium term according to the market conditions. However, traders are responsible for their own actions and risk management. Moreover, it is highly recommended to use stop loss (SL) during trades.


