
Ethereum (ETH) Technical Analysis
ETH seems to have formed a classical symmetrical pattern on the 4-hour chart as it is moving within a descending trendline and a horizontal support. ETH is currently trading close to the upper border of the triangle, which may indicate that a breakout is very close. The price is trading around the level $4,410 for the time being. A strong move with volume from this level toward the upper border could trigger an upward breakout.
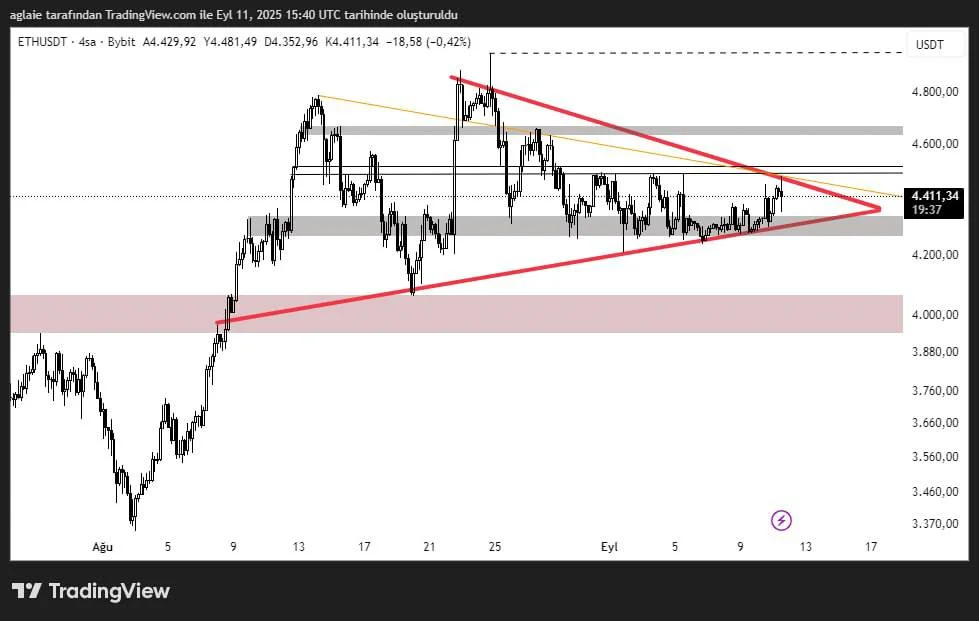
The range between the levels $4,600–$4,650 seems to be a key horizontal resistance following the breakout. The first target could be the $4,800–$5,000 ATH level if the range gets broken upward. On the other hand, the area between the levels $4,200–$4,300 stands as a strong support. If this support gets broken downward, the price could pull back to the level at $4,000.
We see that trading volume has decreased during the consolidation period, and this period suggests there could be a sharp move later. As we get closer to the end of the triangle formation, a rise in volume might confirm the direction of the breakout.
These analyses, not offering any kind of investment advice, focus on support and resistance levels considered to offer trading opportunities in the short and medium term according to the market conditions. However, the user is responsible for their own actions and risk management. Moreover, it is highly recommended to use stop loss (SL) during the transactions.


