
SAGA Technical Analysis
Analyzing SAGA chart on a daily time frame, we can see a symmetrical triangle pattern forming for more than three months, and the price is currently testing the upper border of the formation – $0.275–$0.28 – and this resistance zone is strong.
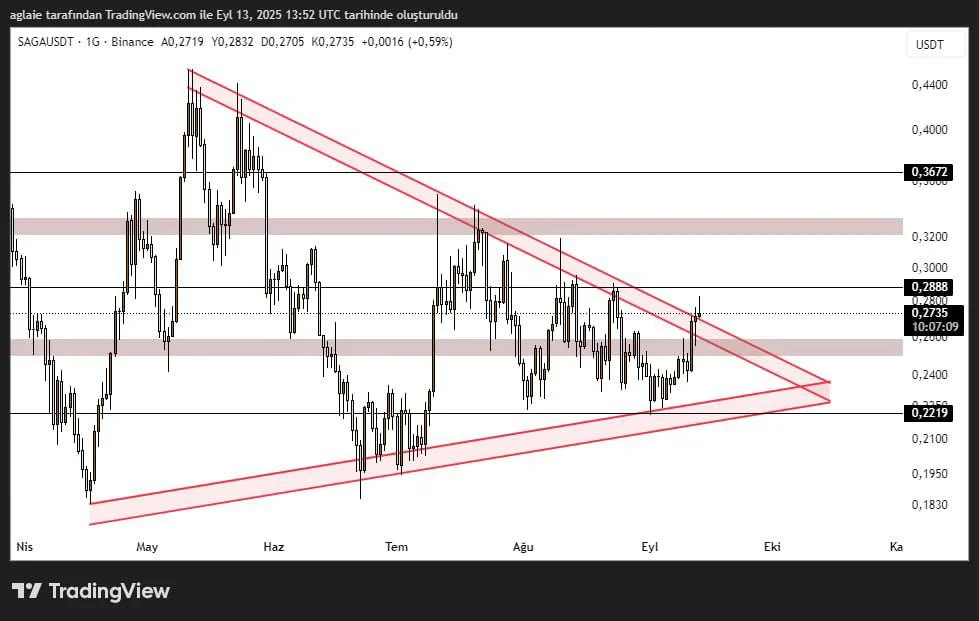
According to the formation, the lower border of it is forming higher lows around the level $0.2219, and this suggests that buyers are stepping in at higher levels during each pullback of the price. It can be stated that a breakout of the formation above is highly likely.
SAGA is currently trading around $0.2735. We have the first resistance level at $0.32 in case the price holds above the formation. This resistance level has been tested a few times in the past two months, and it has worked well. We can expect the price to surge to the level $0.3672 and then to $0.44 if the price manages to break above the resistance.
According to a bearish scenario, a drop to the range between the levels at $0.260–$0.2480 is likely to signal a correction toward the lower border of the triangle formation. If the price fails to hold above this area, SAGA may retest the key support zone at $0.22–$0.23.
Summary:SAGA is trying to break out of the consolidation it has been in for a long time. Both the technical structure and macro news flow support bullish momentum. However, this breakout must be confirmed with volume. Otherwise, a pullback toward the lower boundary of the triangle remains a risk.
These analyses, not offering any kind of investment advice, focus on support and resistance levels considered to offer trading opportunities in the short and medium term according to the market conditions. However, traders are responsible for their own actions and risk management. Moreover, it is highly recommended to use stop loss (SL) during trades.


