Daily Market Summary with JrKripto 2 April 2025
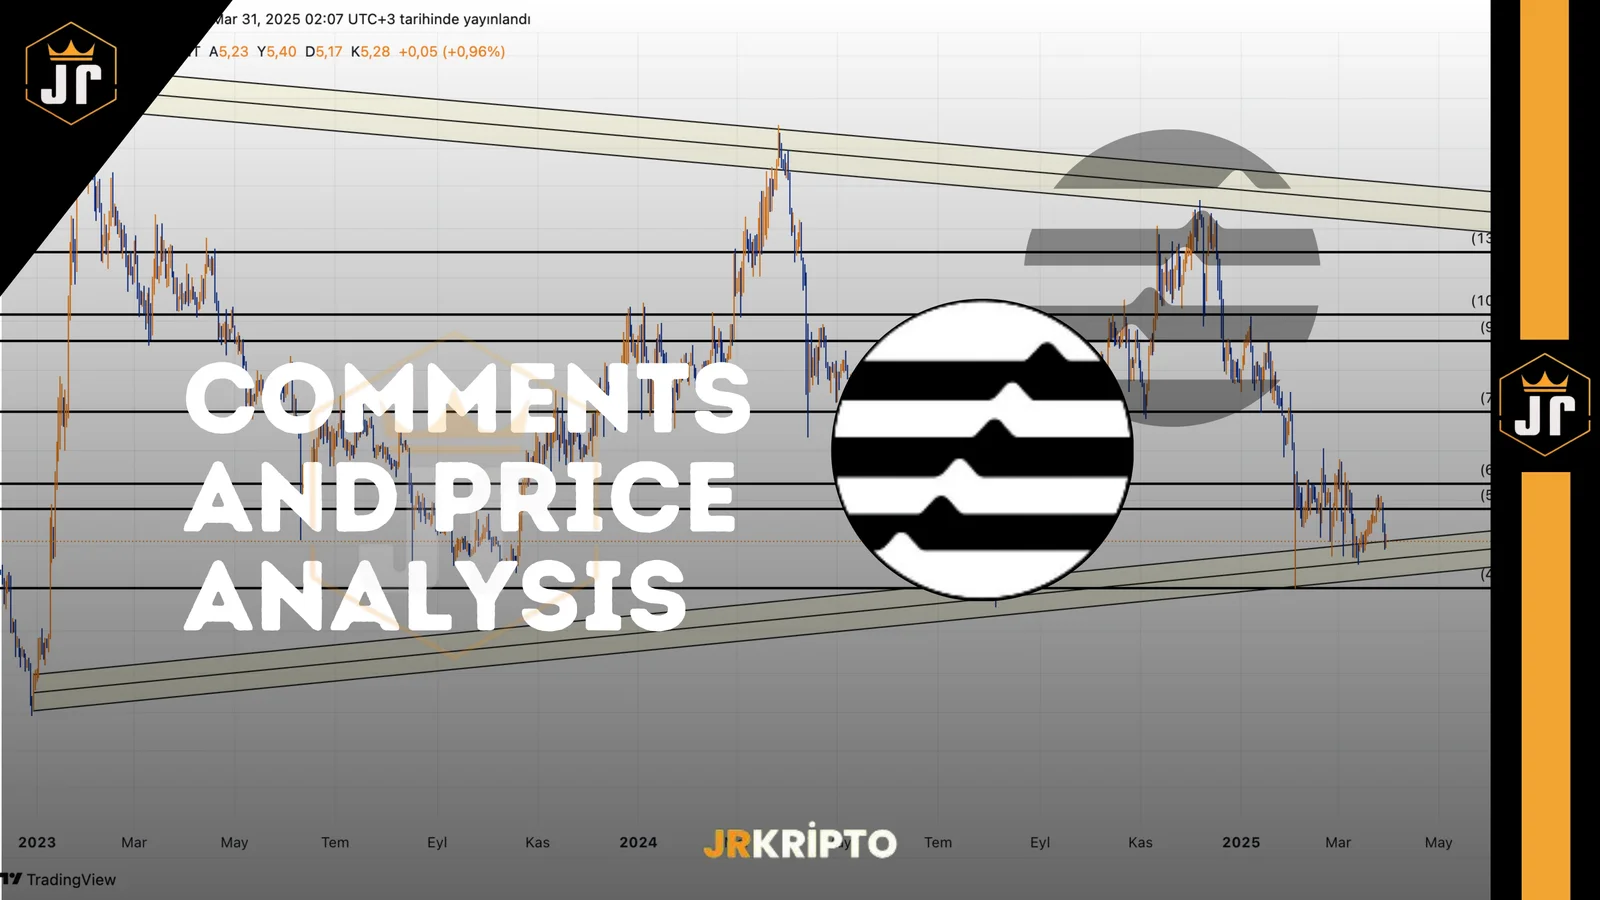
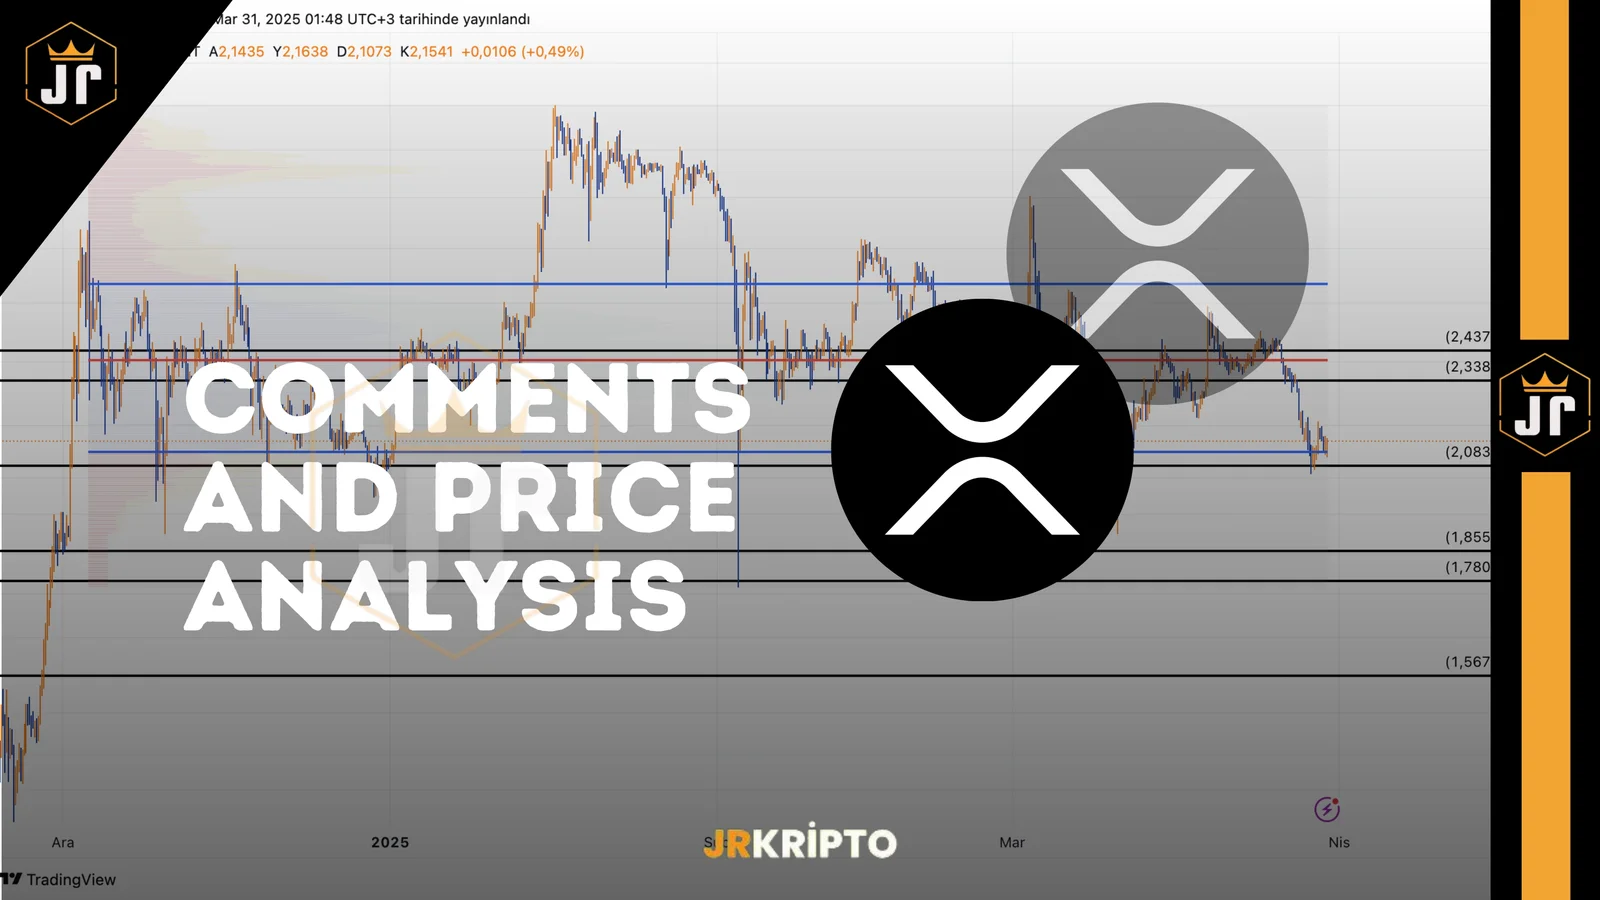
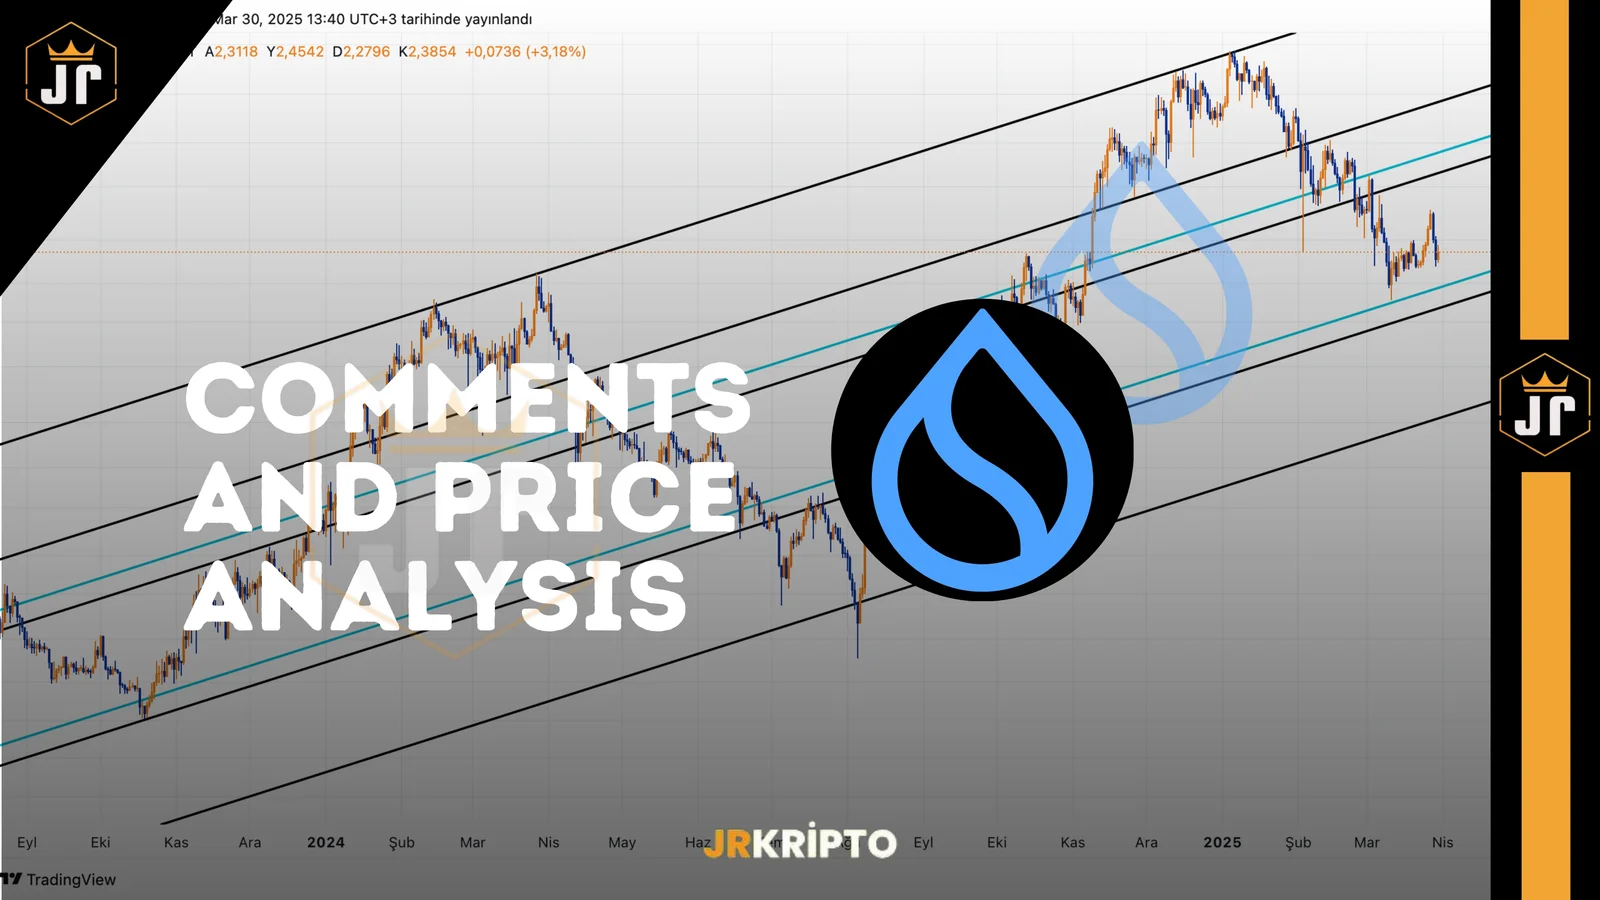
You can find our article “Daily Market with JrKripto” below, where we have compiled the most important developments in global and local markets. Let's analyze the general market conditions together and take a look at the latest assessments.Bitcoin (BTC) is currently trading at $84,500. While the $79,100 - $80,763 area stood out as a strong support area, BTC retreated, hanging below the $85,600 level. If permanence cannot be achieved above the $85,600 level, a pullback towards the $83,763 level may occur. However, if the $85,600 level is exceeded again, it may be possible for the rise to continue to the $90,700 level.Ethereum (ETH) is trading at $1,870. While the $1,900 region is being followed as a critical support point, a drop to the $ 1,800 level may be seen if it goes below this level. A recovery towards the $2,000 level can be expected after the $1,900 level is exceeded in upward movements. A close above $2,000 could allow ETH to accelerate towards the $2,250, $2,534 and $2,721 levels.Crypto NewsWith a new funding of $ 40 billion, OpenAI has increased its total valuation to $ 300 billion.Grayscale submits s-3 file for Digital Large Market Fund ETFMastercard is developing a method that will allow consumers, merchants and financial institutions to make transactions with digital assets.Mexican President Sheinbaum said the response to the US tariffs will be announced on April 3."Bitcoin is one of the greatest means of storing value, it's instantly liquid and it's an incredible hedge against the real estate market," Eric Trump said.BlackRock has been registered as a crypto asset firm with the UK Financial Conduct Authority (FCA).Gamestop's revenue from promissory notes amounted to $ 1.48 billion to be used to buy Bitcoin.Circle has filed for an initial public offering.CryptocurrenciesThose Who Have Risen The Most:EOS → increased by 16.3% to $0.7967.MEW →increased by 15.5% to $0.0031.DEXE →jumped 9.6% to $14.28.WAL-MART rose 8.6% to $0.5696.AKT →rose 8.3% to $1.26.The Ones Who Fell The Most:ZETA → fell 12.0% to $0.2549.KAITO → fell by 11.4% to $0.9250.IP → fell 11.2% to $4.15.COMP → fell 10.3% to $43.23.SNX → fell by 9.7% to $0.6781.Other Data:Fear Index:Bitcoin: 39 (Fear)Dominans:Bitcoin: 62.67% ▲ 0.26%Ethereum: 8.42% ▼ 0.94%Data to Follow Today15:15 - US/ ADP Non-Agricultural Employment (March)Expectation: 118KPrevious: 84K17:30 - US | Energy Information Administration Crude Oil InventoriesExpectation: -0,400MPrevious: -3,341M23:00 - USA | President Trump's SpeechGlobal MarketsUS stock markets have been following a positive trend ahead of the wide-ranging tariffs that President Donald Trump will announce on Wednesday, April 2. While the markets are following a volatile course due to global trade war concerns, it is expected that the new taxes will take effect after the announcement.European Commission President Ursula von der Leyen announced that Europe has a “strong plan to retaliate if necessary,” while the leaders of South Korea, China and Japan agreed to cooperate ahead of Trump's announcements on Sunday. These developments increase the risk of continued volatility in global markets.Stock indexes ended the day in an increase despite ISM manufacturing data that fell short of expectations. In March, the ISM manufacturing industry index fell to 49.0 and moved into contraction territory. The new orders index fell 3.4 points month-on-month to 45.2, the lowest level since August. In contrast, the price index rose to 69.4, indicating that cost pressures are increasing.Looking at the index performances, the S&P 500 rose 0.38%, the Nasdaq rose 0.87%, while the Dow Jones lost 0.03%. While 9 of the 11 main sectors in the S&P 500 gained value, the best performers were the consumer sector with 1.14%, telecommunications with 1.02% and technology with 0.95%. The weakest sectors were healthcare, which fell by 1.75%, and finance, which lost 0.16%.The most important agenda of the day will be Trump's tax policy statements. ADP private sector employment data and factory orders will be followed in the economic data flow. Asian indices are tracking negatively, while European stock markets are expected to start the day with a decline.The Most Valuable Companies and Their Stock PricesApple (AAPL) → market capitalization of $3.35T, price per share of $223.19, an increase of 0.48%Microsoft (MSFT) → market capitalization of $2.84T, price per share of $382.19, an increase of 1.81%NVIDIA (NVDA) → market capitalization of $2.69T, price per share of $110.15, an increase of 1.63%Amazon (AMZN) → market capitalization of $2.04T, price per share of $192.17, an increase of 1.00%Alphabet (GOOG) → market capitalization of $1.92T, price per share of $158.88, an increase of 1.70%Borsa IstanbulAlthough the foreign markets are slightly positive during the period when Borsa Istanbul is closed, the weight of the non-economic agenda continues at home. For this reason, it is expected that volatility and periodic pressures will continue in BIST. While it is important to keep market risks limited in the short term, targets above 14 thousand remain valid in the medium and long term. For the BIST100 index, 9.850, 10.000 and 10.200 levels are monitored as resistance, while 9.420, 9.250 and 9.100 levels are monitored as support points.In the data calendar of the day, the March PMI data will be announced internally. In Europe, the agenda is calm, while in the US, private sector employment growth, durable goods orders and factory orders will be followed. In the continuation of the week, inflation data in Turkey and critical data such as non-agricultural employment, unemployment rate and average hourly earnings in the United States will be on the agenda. While Turkey's 5-year CDS premium started the day at 319 basis points, retail prices increased by 3.79% month-on-month and 46.23% year-on-year in March, according to Istanbul Chamber of Commerce (ITO) data. According to TÜRK-IŞ's March data, the hunger limit increased by 1.25% per month to TL 23,615. Paying April April June period The Treasury announced the domestic borrowing strategy and while it is planned to pay a total of TL 692.6 billion in domestic debt during this period, domestic borrowing is targeted at TL329.5 billion against the TL 293.3 billion in domestic debt servicing in April.While BIST is expected to make a cautious and horizontal opening after the holiday holiday, the banking sector's February aggregate results, which are scheduled to be announced yesterday at noon, will be closely monitored. February January, the banking sector achieved a net profit of TL 47.3 billion with a contraction of 38%, while in February, the profit is expected to increase by more than 35% per month and reach around TL 65 billion. The BIST100 index recovered from 9.415 level on the last trading day and closed at 9.659, but reaction movements are still limited. while the December of 9.738-9.895 is monitored as a resistance, a new move towards 10.197 can be supported if this level is exceeded. The 9.594-9.473 region should be followed as support, and the 9.221-8.870 December may be on the agenda if it falls below this level. Today, the customs tariffs announced by the United States in foreign markets will be followed. In general, the BIST100 is expected to make a cautious start to the first trading day after the holiday.The Companies with the Highest Market Capitalization in Borsa Istanbul:QNB Finansbank (QNBTR) → Market capitalization of TL 1.16 trillion, price per share is TL 312.00, a decrease of 9.96%.Aselsan Electronic Industry (ASELS) → Market value of TL 546.74 billion, price per share is TL 118.70, a decrease of 1.00%.Garanti Bank of Turkey (GARAN) → Market capitalization of TL 495.60 billion, price per share is TL 116.80, a decrease of 1.02%.Turkish Airlines (THYAO) → market value of TL 429.18 billion, price per share is TL 306.25, a decrease of 1.53%.Koç Holding (KCHOL) → Market value of TL 414.87 billion, price per share is TL 161.10, a decrease of 1.53%.Precious Metals and Foreign Exchange PricesGold: 3801 TL Silver: 41.28 TL Platinum: 1197 TL Dollar: 37.94 TL Euro: 41.01 TL Hope to meet you again tomorrow with the latest news! translate one-to-one