Space ID (ID) Technical Analysis: Is the Horizontal Jam Ending?
The Space ID Coin is exhibiting a horizontal squeeze within the channel formation, which has been falling in recent weeks. The IDUSDT pair is currently priced at 0.2506, and this level indicates a technically important decision zone. The price is based on both the upper band of the falling channel and the horizontal resistance zone. Therefore, it is quite possible that volatility will increase in the coming days.
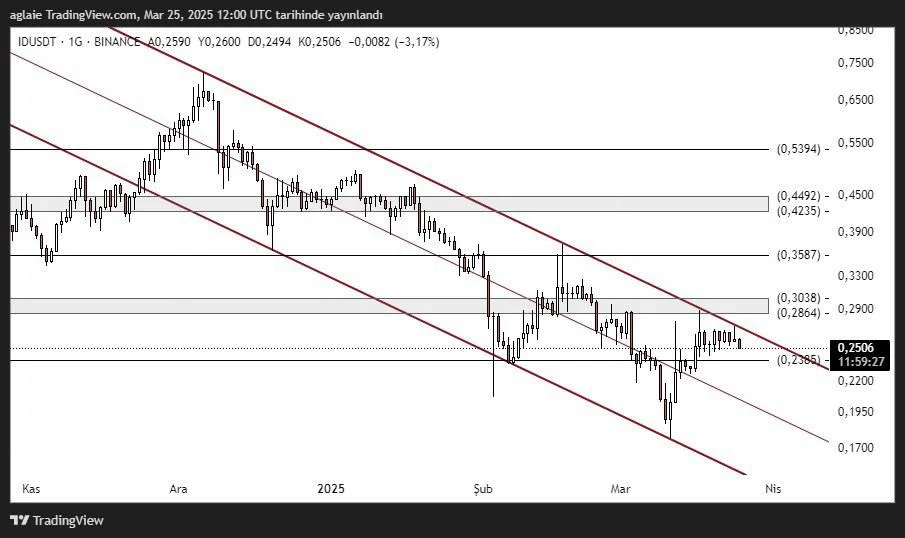
When we look at the past price movements, we see that Space ID Coin has received a strong reaction from the 0.2200 level. This region stands out as the support where the recent dips are formed and buyers are active. The current chart structure indicates the need for a break in order for the rise to continue.
Outstanding Technical Levels For IDUSDT
Support Levels:
- 0.2365 (Short-term support)
- 0.2200 (Main support)
- 0.1950 (Lower band of the channel)
- 0.1700 (Oversold zone)
Resistance Levels:
- 0.2864 – 0.3038 (Horizontal resistance + above channel)
- 0.3587 (Medium-term target region)
- 0.4235 – 0.4492 (Long-term resistance)
- 0.5394 (Main resistance)
At the moment, the price is trying to stay above the 0.2365 support. Maintaining this level may lay the groundwork for the price to accelerate back to the 0.2864 – 0.3038 band. In particular, this region is considered to be a strong breaking area for both horizontal resistance and intersection with the upper boundary of the falling channel.
What Does the Falling Channel Structure Tell?
The falling channel on the chart shows that Space ID Coin has been under pressure for a long time. However, the contacts made to the upper band of this channel began to become frequent. This may mean that the trend is weakening and preparations are being made for a possible break.
Although there is no significant increase in the volume side yet, the price making high dips can be considered as a bullish signal. If a close above 0.2864 occurs, a technical trend change may be on the agenda for Space ID Coin. This may also trigger new waves of purchases.
Strategy Suggestions For Investors
1. Short-Term Follow-up: The positive scenario remains valid as long as the hold above 0.2365 continues.
2. Channel Breakage: Closures above 0.3038 may trigger an increase in the medium term.
3. Stop Level: Closures below 0.2200 mean a transition to a risky zone.
Conclusion: The Breakdown in Space ID Coin Is Approaching
The Space ID Coin rested on the upper band of the falling channel, holding on to a strong support area. Technical indicators indicate that buyers are about to gain strength. If the 0.2864 – 0.3038 December breaks volumetrically in the coming days, a medium-term positive trend may start in the IDUSDT parity.
This compression in the channel structure can be a harbinger of a potential trend transformation. From this point of view, Space ID Coin may be on the verge of a new ascension story.
These analyses, which do not offer investment advice, focus on support and resistance levels that are thought to create trading opportunities in the short and medium term according to market conditions. However, the responsibility for making transactions and risk management belongs entirely to the user. In addition, it is strongly recommended to use stop loss in relation to shared transactions.
Author: Ilaha