Politics
This page lists the latest Politics news and market analysis. Browse articles, expert insights, and updates in this category on JrKripto. Stay informed with in-depth coverage of cryptocurrency trends and developments.
News
Politics News
Politics News
Browse all Politics related articles and news. The latest news, analysis, and insights on Politics.
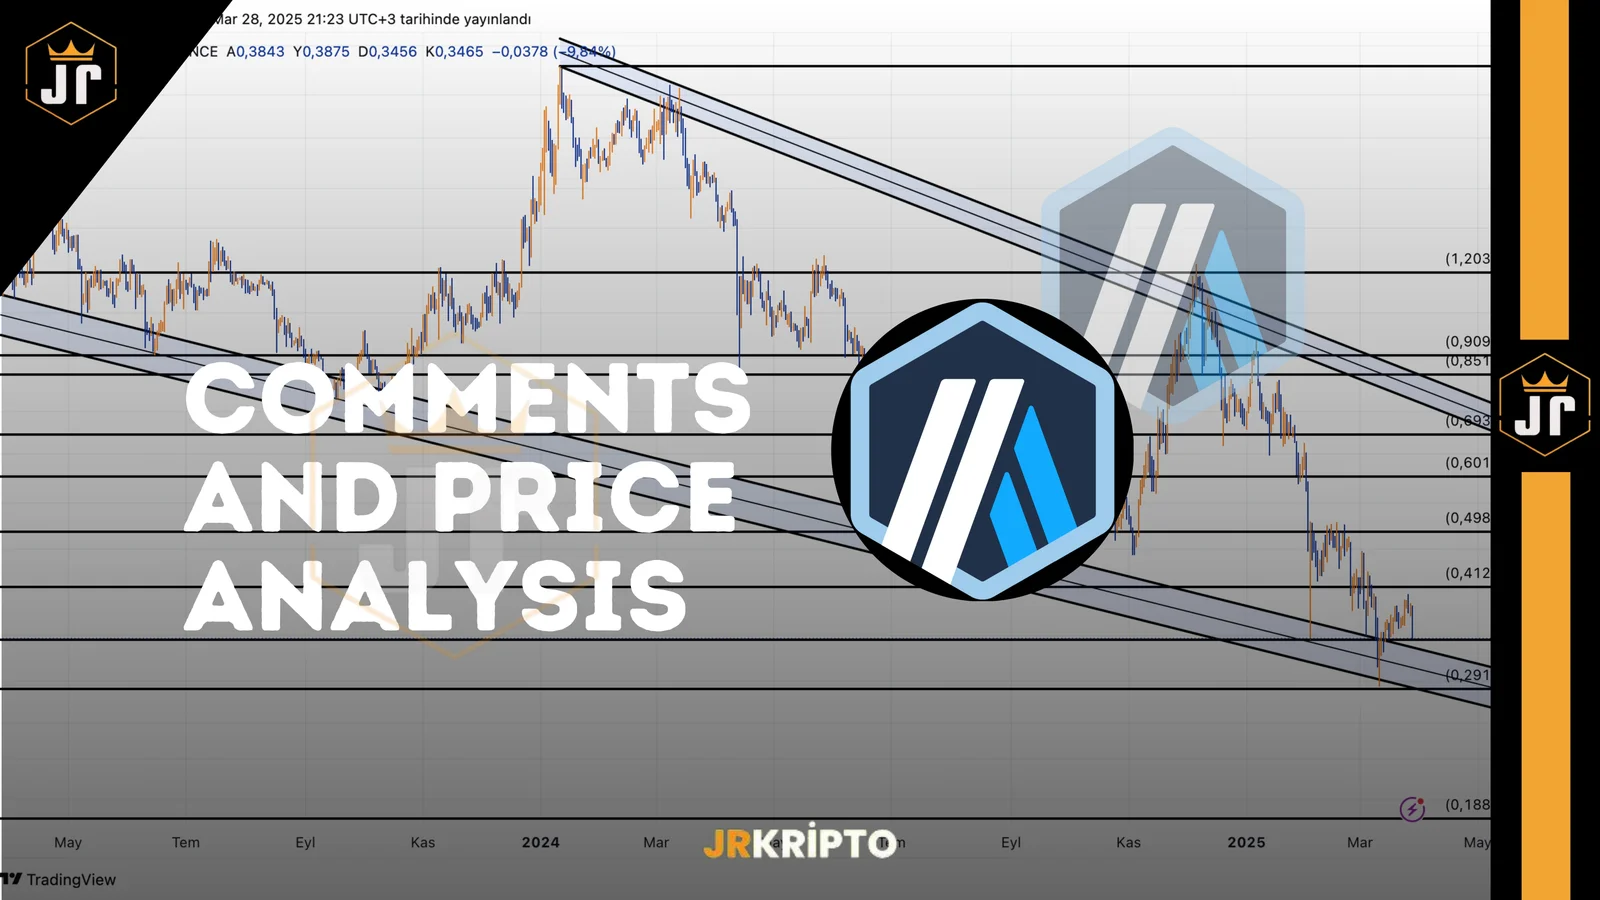
ARB: Comment and Price Analysis 28.03.2025
Arbitrum (ARB) Technical Analysis Arbitrum has been moving within a sideways and tight price range in recent weeks. Following a rebound from the $0.30 level, the price is currently trading at $0.3494. This movement brings us to a critical point—the descending trendline resistance. At the same time, this area coincides with the $0.3983 resistance level, making it a significant decision zone. ARB Trend Structure One of the key observations on the chart is that the price has previously tested this trendline multiple times and faced rejection. However, this time, higher lows are forming, and the selling pressure appears to be weakening. This suggests that a potential breakout could be stronger than before. Resistance Levels: $0.3983 (Trendline breakout level) $0.4801 – $0.5100 (Target zone after breakout) $0.6042 $0.7158 – $0.7603 Support Levels: $0.2700 (Main support zone) $0.3050 (Intermediate support) The $0.3983 level should be closely monitored. If the price breaks above this zone and achieves a daily close above it, the descending trendline will be breached. In this scenario, the price could first rally towards $0.4800 and then potentially reach $0.5100. If this breakout occurs, a positive movement will occur in the long term. If we take a look at the chart in the longer term, we see a chart like the one below. ARB Daily Graphic From a broader perspective, the downtrend remains intact. However, the price appears to have found support at the channel’s lower boundary, which is typically a zone where upward reactions occur. To see a move towards the channel’s midline, the short-term descending trend must be broken, and the $0.4579 resistance level must be surpassed. Conclusion: Arbitrum is at a decision point in the short term. The price movement near the descending trendline will determine whether a new bullish phase begins or if the price pulls back to support levels for a more sideways and cautious movement. In the long term, short-term price movements will be critical. For a sustained uptrend and breakout, we need positive price action at the key levels identified in the short-term analysis. Disclaimer:This analysis does not constitute investment advice. It focuses on support and resistance levels that may present potential short- to mid-term trading opportunities depending on market conditions. However, all responsibility for trading decisions and risk management lies entirely with the user. The use of stop-loss orders is strongly recommended for any trade setup shared.
Bitcoin Move from the US: 1 Million BTC Reserve Plan Is on the Way
One of the significant developments in the United States is a new bill that proposes the adoption of Bitcoin as a strategic reserve asset. Ohio Senator Bernie Moreno stated that this bill should be passed no later than August.Speaking at the Blockchain Summit, Moreno emphasized that for the U.S. to maintain its global financial leadership, Bitcoin and digital assets must now become part of the national strategy, and he stressed the need for the bill to be enacted quickly.A National Reserve Plan for 1 Million BTCKnown as the "Bitcoin Act," this proposal aims to establish a national reserve of 1 million Bitcoin within the next five years. The bill was introduced by Republican Representative Nick Begich and Senator Cynthia Lummis, and is also based on an executive order issued by President Donald Trump regarding a strategic Bitcoin reserve.In his speech at the event in Washington, D.C., Moreno stated that not only Bitcoin but also market structure and stablecoin regulations need to be addressed within the next five months. In a post on Twitter, he expressed hope for the bill’s passage, stating that the U.S. will become a global standard in the crypto space.Will the Bill Pass? Will the U.S. Buy Bitcoin This Year?The bill appears to have bipartisan support and the backing of President Trump. However, it remains unclear whether the U.S. government will actually purchase Bitcoin within this year. As of now, there is no official timeline for the passage of the bill, and the government has not yet taken concrete steps in this direction.In Summary:Bernie Moreno has called for legislation to establish a strategic reserve of 1 million BTC.The bill aims to create a national Bitcoin reserve over five years.It aligns with an executive order by President Trump.Pressure is mounting for the bill to be passed by August.It is still uncertain whether the U.S. will purchase Bitcoin this year.

Daily Market Summary with JrKripto 28 March 2025
You can find today’s “Daily Market with JrKripto,” where we compile the most important developments in the global and local markets, below.Let’s analyze the overall market conditions together and take a look at the latest evaluations.Bitcoin (BTC) is currently trading at $85,200. The $79,100 – $80,763 zone stands out as a strong support area, while BTC has pulled back slightly after slipping below the $85,600 level. If the price fails to hold above $85,600, the decline may continue toward $83,763. However, if the $85,600 level is regained, the uptrend could continue toward $90,700.Ethereum (ETH) is trading at $1,910. ETH is currently below the $2,000 level, with $1,900 being followed as a critical support zone. If this area is lost, the price could retreat as far as $1,800. In upward moves, the $2,000 level may be tested again. Closures above this level could create momentum toward $2,250, $2,534, and $2,721.Crypto NewsThe U.S. Securities and Exchange Commission (SEC) has officially announced the dismissal of lawsuits filed against Kraken, Consensys, and Cumberland, and published the relevant notices.BlackRock’s Global Allocation Fund disclosed $47.4 million in Bitcoin ETF holdings.Bpifrance, the French state bank, launched a €25 million fund for new French crypto tokens.Circle and Ice will explore the integration of USDC and USYC into financial markets.Senator Moreno called for the passage of a bill to purchase 1 million #Bitcoin by August.CryptoTop Gaining Cryptocurrencies:WAL → +18.1%, reached $0.4635FAI → +13.1%, reached $0.02664SAFE → +11.8%, reached $0.5773AGENTFUN → +9.2%, reached $2.23GRASS → +7.9%, reached $1.64Top Losing Cryptocurrencies:MEOW → -17.9%, dropped to $0.00253DEEP → -17.2%, dropped to $0.07453KET → -16.2%, dropped to $0.2174NTGL → -15.8%, dropped to $0.00090FARTCOIN → -15.6%, dropped to $0.4932Other DataDominance:Bitcoin: 62.07% ▲ 0.53%Ethereum: 8.44% ▼ 2.23%Daily Net ETF Inflows:BTC ETFs: $89.00 millionETH ETFs: -$4.20 millionKey Data to Watch Today15:30 – U.S. | Core Personal Consumption Expenditures (PCE) Price Index (MoM, February)Forecast: 0.3%Previous: 0.3%15:30 – U.S. | Core PCE Price Index (YoY, February)Forecast: 2.6%Previous: 2.6%Global MarketsGlobal stock markets came under selling pressure after U.S. President Trump announced a 25% tariff on all cars not manufactured in the U.S. U.S. markets, fluctuating ahead of key economic data, ended the day with losses. The S&P 500fell 0.33%, the Nasdaq dropped 0.53%, and the Dow Jones lost 0.37%.Among the 11 sectors in the S&P 500, 8 closed in the green. Consumer staples rose 1.00%, while healthcare and discretionary sectors also posted slight gains. Losers included energy (-0.85%), telecommunications (-0.84%), and technology (-0.75%)—the weakest performers.The U.S. economy grew by 2.4% on an annualized basis in Q4 2024, slightly above the previously announced 2.3%forecast. The biggest contribution came from consumer spending, while housing investments and public spending also supported growth. However, non-residential fixed investments declined. Net exports added +0.26 percentage points to GDP.Labor market data was also monitored. Weekly jobless claims came in at 224,000, slightly below expectations of 225,000. The four-week average dropped by 4,750 to 224,000. Continuing jobless claims fell by 25,000 to 1.86 millionas of March 15. The insured unemployment rate remained steady at 1.2%.The U.S. trade deficit fell by $7.7 billion in February to $147.9 billion. Goods exports rose by 4.1%, while importsdecreased by 0.2%. In housing, pending home sales increased 2.0%, exceeding expectations (1.0%) and significantly improving from the previous month (-4.6%).The Central Bank of Mexico cut its policy rate by 50 basis points to 9.0%, in line with expectations.Today, markets will closely monitor important data, including the Core PCE index, one of the Fed’s key inflation indicators. The headline figure is expected to rise 0.3% MoM and 2.5% YoY. Also on investors’ radar are the University of Michigan Consumer Sentiment Index, ECB inflation expectations, and UK GDP data.Asian markets started the day negative, and European markets are also expected to open lower.Top Companies by Market Cap and Share PriceApple (AAPL) → $3.36T market cap, $223.85/share, ▲ 1.05%Microsoft (MSFT) → $2.90T market cap, $390.58/share, ▲ 0.16%NVIDIA (NVDA) → $2.72T market cap, $111.43/share, ▼ 2.05%Amazon (AMZN) → $2.13T market cap, $201.36/share, ▲ 0.11%Alphabet (GOOG) → $1.99T market cap, $164.08/share, ▼ 1.83%Borsa IstanbulVolatility and weak momentum continue on Borsa Istanbul. The Central Bank of Turkey’s reserves declined by $8 billion gross and $12 billion net. Additionally, a $440 million outflow from foreign investors occurred last week, and this trend is believed to be ongoing. Reducing short-term risks and focusing on strong companies in the mid-to-long term may be more prudent.Today, confidence indices in Turkey and Europe, and the Core PCE data in the U.S., which the Fed closely monitors, will be released. Inflation is expected to rise from 2.6% to 2.7%, potentially delaying rate cut expectations. Turkey’s 5-year CDS rose to 319 basis points, with concerns over U.S. debt repayment capacity contributing to the increase.In February, the foreign trade deficit was $7.8 billion. Exports fell 1.6% YoY to $20.8 billion, while imports rose 2.4%to $28.5 billion. The unemployment rate fell to 8.2%, while broad unemployment rose to 28.4%. The 2-year bond yield rose to 45.5%, and the 10-year yield to 33.5%.Although BIST-100 opened higher yesterday, it closed lower due to cautious foreign sentiment toward banking stocks and the CBRT’s interest rate policies. Garanti Bank, defense, and gold mining stocks outperformed.After the holiday, the market will focus on banking sector profit data on Wednesday and March inflation data on Thursday. March inflation is expected to be around 3%, and a pre-holiday sell-off may occur.Technically, BIST-100 tested 9,831 yesterday and closed at 9,613. A break above the 9,738–9,895 resistance range could support a move toward 10,197. The 9,594–9,473 zone serves as support, and if breached, the index may decline toward 9,221–8,870.In summary, uncertainty and volatility persist in the markets, so caution is advised. Focusing on solid companies may be beneficial. Upcoming economic data will be key in determining market direction.Top Gaining Stocks:DAGHL → ▲ 9.95% to 55.25 TLSKTAS → ▲ 9.93% to 4.54 TLCEMAS → ▲ 9.70% to 3.28 TLSANEL → ▲ 9.00% to 23.98 TLPOLHO → ▲ 8.19% to 14.26 TLTop Losing Stocks:ISMEN → ▼ 13.15% to 41.20 TLPAPIL → ▼ 10.00% to 30.24 TLOSMEN → ▼ 10.00% to 9.18 TLDYOBY → ▼ 9.98% to 20.74 TLKUYAS → ▼ 9.96% to 37.42 TLTop Market Cap Companies on Borsa Istanbul:QNB Finansbank (QNBTR) → 1.29 trillion TL market cap, 372.00 TL/share, ▼ 3.38%Aselsan (ASELS) → 533.52 billion TL market cap, 116.50 TL/share, ▼ 0.43%Garanti Bank (GARAN) → 517.02 billion TL market cap, 116.60 TL/share, ▼ 5.28%Turkish Airlines (THYAO) → 425.73 billion TL market cap, 305.50 TL/share, ▼ 0.97%Koç Holding (KCHOL) → 409.04 billion TL market cap, 160.10 TL/share, ▼ 0.74%Precious Metals and Exchange RatesGold: 3,751 TLSilver: 42.18 TLPlatinum: 1,210 TLDollar: 38.01 TLEuro: 41.01 TLSee you again tomorrow with the latest updates!

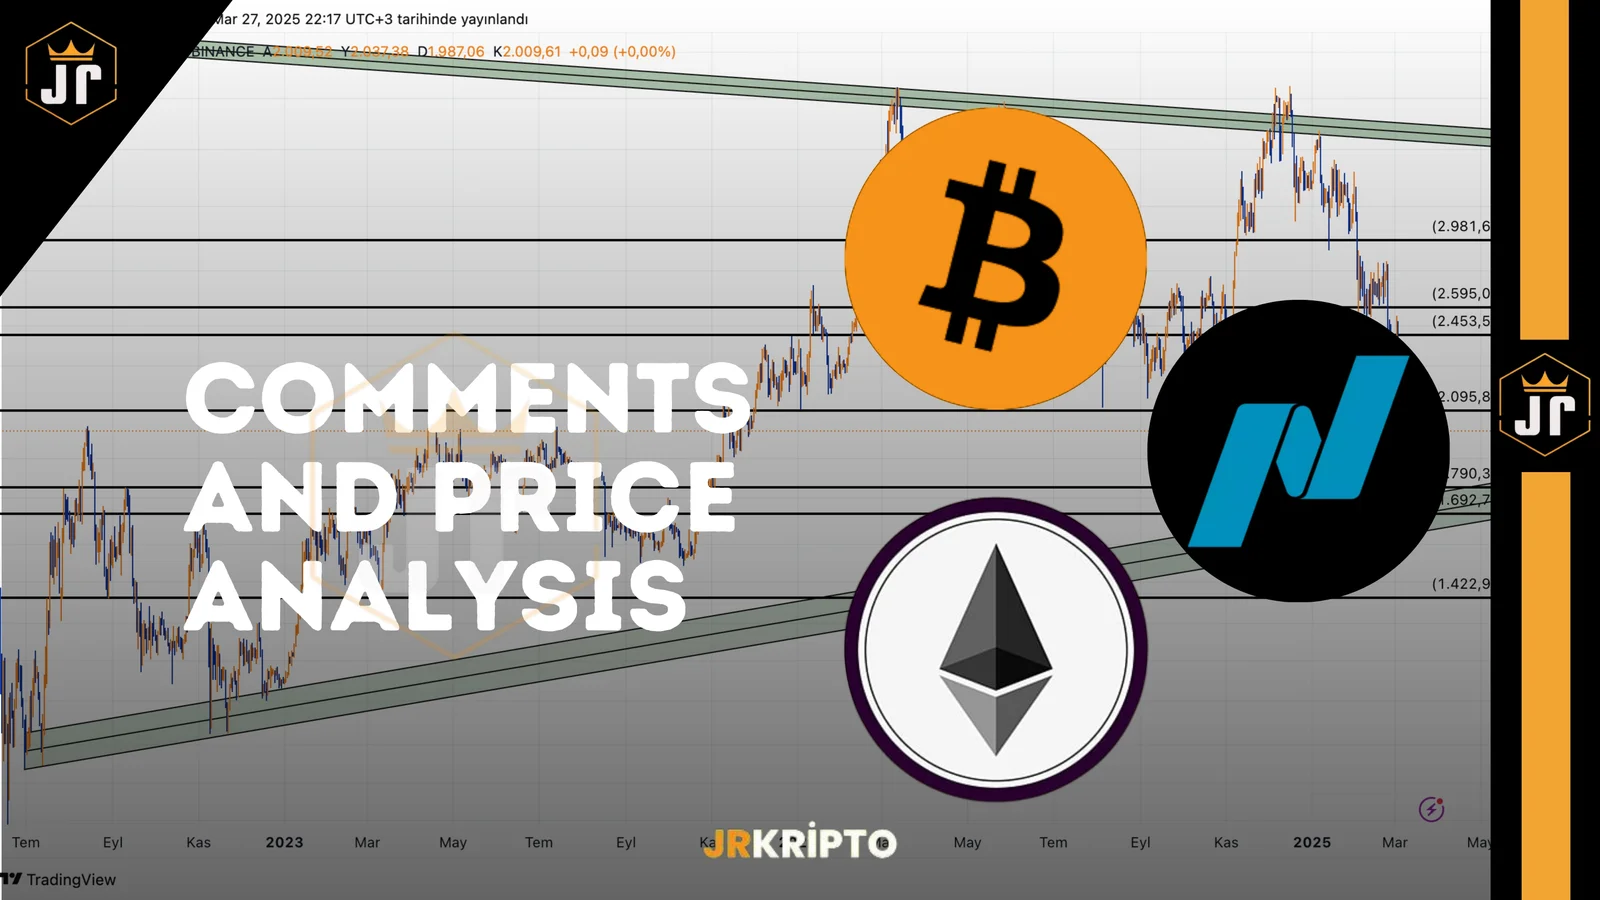
BTC, ETH and NASDAQ: Comments and Price Analysis 27.03.2025
Bitcoin (BTC) and Ethereum (ETH) Technical Analysis: Key Levels and Market DirectionThe cryptocurrency market continues to be shaped by the price movements of Bitcoin (BTC) and Ethereum (ETH) in particular. Currently, the market is moving around critical levels, with key support and resistance zones that will determine future price action in the coming days. So, which levels need to be broken for a bull market to begin? At which zones could the price reverse? Here’s our latest technical analysis!Bitcoin (BTC): Key Levels for the Start of a Bull MarketBitcoin continues to receive strong buying interest around the $80,691 level. This area acts as a critical line of defense for BTC and has served as a strong support so far. If the price holds above this level, the likelihood of the bull trend continuing is quite high.However, if the $80,691 level is lost, selling pressure may increase, making a pullback toward the $73,336 area likely. This zone is one of the main turning points of the major uptrend that started from $15,500 for BTC, and any reaction from this level should be monitored closely. Let’s not forget that BTC previously initiated a 150% rally from the $73,336level. BTC Main Resistances Ahead for Bitcoin: How Far Can We Rise?The most important resistance BTC will face on its upward moves is $87,500. This area is a critical zone, both as an SR Flip (Support-Resistance Flip) and a POI (Point of Interest).If BTC can break above the $87,500 level with strong volume, the price may move toward $92,591.A strong close above $92,591 is expected to push BTC into the $95,745 – $97,213 liquidity zone.Price action above $97,213 has the potential to carry BTC toward the $110,000 level.Breaking through these levels could open the door to new all-time highs and put the $130,000 target on the table.Ethereum (ETH): The Keys to Upside and Target LevelsEthereum is trading at important support and resistance zones that will define the market trend. For ETH to sustain its uptrend, it must defend specific areas and break through key levels. ETH $1,692 – $1,574: Strong Demand ZoneAt these levels, ETH may attract institutional buying interest. If the price can hold above $1,692, a strong recovery movement can be expected.However, losing this support could increase selling pressure and pull the price down to $1,574. This zone will be a key defense line that will determine Ethereum’s trend.$2,083 – $2,108: Resistance Flip Area (SR Flip)The first major barrier ahead of Ethereum is the $2,083 – $2,108 range.If ETH can break this zone with strong volume, upward momentum will accelerate.If it fails to stay above this zone, the price could return to lower support levels.The strength of buyers in this area will be one of the most crucial factors determining ETH’s trajectory.$2,534 – $2,723: Major Resistance and Breakout ZoneThis level is a critical resistance zone where Ethereum could establish a new upper trend structure.If the price holds here and encounters strong buying interest, a new upward movement toward $3,402 could begin.However, if strong rejection occurs at this level, the price may be pulled back to lower support areas.$3,402: Institutional Focus ZoneThis zone is carefully monitored by institutional investors. If ETH can maintain itself above $3,402, the $5,000 level may become inevitable.A strong breakout above this level could lead Ethereum into a price discovery phase, where new all-time highs may be tested.$5,000 and the Layer 2 EffectIf Ethereum reaches the $5,000 level, it could lead to massive capital inflows into Layer 2 projects such as OP, STRK, ZKSYNC, and ARB. This would cause serious price movements in projects within the Ethereum ecosystem.Key Levels That Will Determine Market DirectionIf Bitcoin loses the $80,691 support, $73,336 may be tested.If $87,500 is broken, it opens the door to $92,591, followed by $110,000.If Ethereum holds $1,692 – $1,574, a strong recovery could begin.A break above $2,083 – $2,108 could accelerate the uptrend.Sustained price action above $2,534 – $2,723 could lead to new highs.If $3,402 is broken, $5,000 becomes the next target.In conclusion, the market's direction will depend on how the price behaves around these levels.NASDAQ Technical Analysis and Market DirectionThe NASDAQ (NDX) index, which has high correlation with Bitcoin, stands out as one of the key factors determining overall risk appetite in the market. Price movements in NASDAQ also send important signals for Bitcoin and other risk assets. Let’s now examine key support and resistance levels for NASDAQ. NASDAQ Short-Term Resistance Zone: 20,269 – 20,475This range should be followed as NASDAQ’s short-term resistance area.If the price sustains above 20,269 – 20,475, positive price movements are expected to continue.A strong breakout above this zone with volume could increase buyer appetite in NASDAQ and across the market.However, if strong selling emerges at these levels, short-term corrections may be seen.Intermediate Support: 19,692The 19,692 level stands out as an important intermediate support for NASDAQ.Closing above this level is critical for the index to stay within its upward trend.If the price dips below this area, stronger support levels may be tested.However, if the level receives strong buying interest, an upward movement is expected to resume.Major Support Zone: 19,115 – 18,910This area has been a region of strong buyer dominance for NASDAQ.If the price drops to this level and buyers regain control, it could act as a major support and initiate an upward reversal.If this area breaks, selling pressure may deepen and lower levels could be tested.NASDAQ – ExpectationsIf 20,269 – 20,475 is broken, the uptrend could strengthen.If 19,692 is maintained, the index is expected to remain positive.The 19,115 – 18,910 zone is where buyers tend to enter; losing this could trigger a larger market correction.NASDAQ’s reaction at these levels will be critical for determining the direction of Bitcoin and other risk assets. You can build your strategy by closely monitoring price action.Disclaimer: These analyses do not constitute investment advice. They focus on support and resistance levels that may present trading opportunities in the short and medium term based on market conditions. However, trading and risk management decisions are solely the responsibility of the user. The use of stop-loss orders is strongly recommended.
TOTAL, TOTAL2, TOTAL3: Comments and Price Analysis 27.03.2025
The Big Picture in the Crypto Market: Analysis of TOTAL, TOTAL2 and TOTAL3 When analyzing the crypto market, the TOTAL, TOTAL2 and TOTAL3 indices are the most critical indicators that allow us to understand the general situation of the market. TOTAL (Overall Crypto Market Value) → Shows the market value of all crypto assets. TOTAL2 (Altcoin Market Value Excluding Bitcoin) → Reflects the total value of all altcoins except Bitcoin. TOTAL3 (Altcoin Market Value Excluding Bitcoin & Ethereum) → Measures the market value of altcoins other than Bitcoin and Ethereum. These three data sets allow us to understand at what stage the market is and where investment opportunities may occur. Now let's examine each of them in detail. TOTAL – The General Health of the Crypto Market The TOTAL metric evaluates the overall market health by measuring the total market value of the 125 largest coins in the cryptocurrency market. This data, which includes Bitcoin, Ethereum and major altcoins, shows what level of liquidity is in the entire market and when bullish or bearish trends may start. TOTAL 2.86T - Decision Point: The Region where the Market Trend is Determined This level can be the determinant of a bullish or bearish trend. The fact that weekly or 2-day closures come above this level confirms that buyers are dominating the market. If the volume purchases continue, large funds and corporates may break this level, triggering the inflow of fresh money into the market. If we stay below 2.86T, there may be retreats and corrections in the crypto market. 2.68T - Accumulation and Demand Zone This is a support level that investors should pay attention to in the short term. If the market consolidates and gathers strength in this region, we may see upward movements again. If volume purchases do not come, it is likely that the price will sag to lower levels. 2.51T - Decline Scenario: The Buying Zone of Large Funds If the 2.86T level is not exceeded, the price may be withdrawn here. It is a region where institutional investors can make big purchases. It could be an area of opportunity for long-term buyers. 3.16T - Profit Selling Area & New Highs If the 2.86T level is exceeded strongly, its TOTAL value may rise to 3.16T. When this region is reached, it is likely that investors will realize profits. But if a volume break comes, we may see new highs in the crypto market TOTAL2 - The Pulse of the Altcoin Market The TOTAL2 metric measures the total market value of all altcoins except Bitcoin. This indicator is one of the most important data to understand whether the altcoin season has arrived. TOTAL2 1.09T - Decision Level in the Altcoin Market The fact that weekly closures occur above this level indicates the beginning of a strong upward trend in the altcoin market. If we stay above this level, we can see big rises in Ethereum and major altcoins. However, if the seller pressure is strong, the price may return to support levels again. 989B - 956B - Corporate Demand Zone This region is a critical level where large investors and funds will show great interest. If the price receives a strong reaction from here, we may see a big recovery in the altcoin market. 1,3T - Profit Realization and Withdrawal Area It attracts attention as a region where altcoin investors will make profit purchases. If the volume purchases continue, new peaks may be opened in the altcoin market. However, if we encounter resistance at these levels, it is possible for the price to fluctuate for some time. TOTAL3 - The Signal of the Altcoin Season The TOTAL3 metric shows the total market value of all altcoins except Bitcoin and Ethereum. This chart is very important for us to understand whether the altcoin season has arrived. TOTAL3 846B - Critical For Altcoins If the weekly closes remain above this level, we may see hard rises of between 20 Dec-50% in altcoins. A break of this level indicates that there will be a large flow of capital into the market. 787B - 779B - The Area of Interest of Large Funds It is the region where institutional investors can make intensive purchases. If a strong recovery comes from this region, we could see a big bullish wave in the altcoin market. However, if the sellers remain strong here, the price may move horizontally for a while. 961B - 981B - Profit Realization & New Peak Potential This region is an area where investors will consider taking profits. If the price breaks this zone with a strong volume, we may see new ATH levels in the altcoin market. However, if we are rejected in this region, there may be withdrawals in altcoins in the short term. TOTAL → Indicates the health of the overall market. If we exceed 2.86T, the journey to new heights can begin. TOTAL2 → Determines the status of the altcoin market except Bitcoin. If the 1.09T breaks, we could see a big altcoin bull. TOTAL3 → Gives the signal of the altcoin season except Bitcoin and Ethereum. The 846B breakage activates altcoins. It is very important to follow these levels in order not to miss opportunities in the market. By following these levels closely, you can see the opportunities and possible risks in the market in advance. These analyses, which do not offer investment advice, focus on support and resistance levels that are thought to create trading opportunities in the short and medium term according to market conditions. However, the responsibility for making transactions and risk management belongs entirely to the user. In addition, it is strongly recommended to use stop loss in relation to shared transactions.
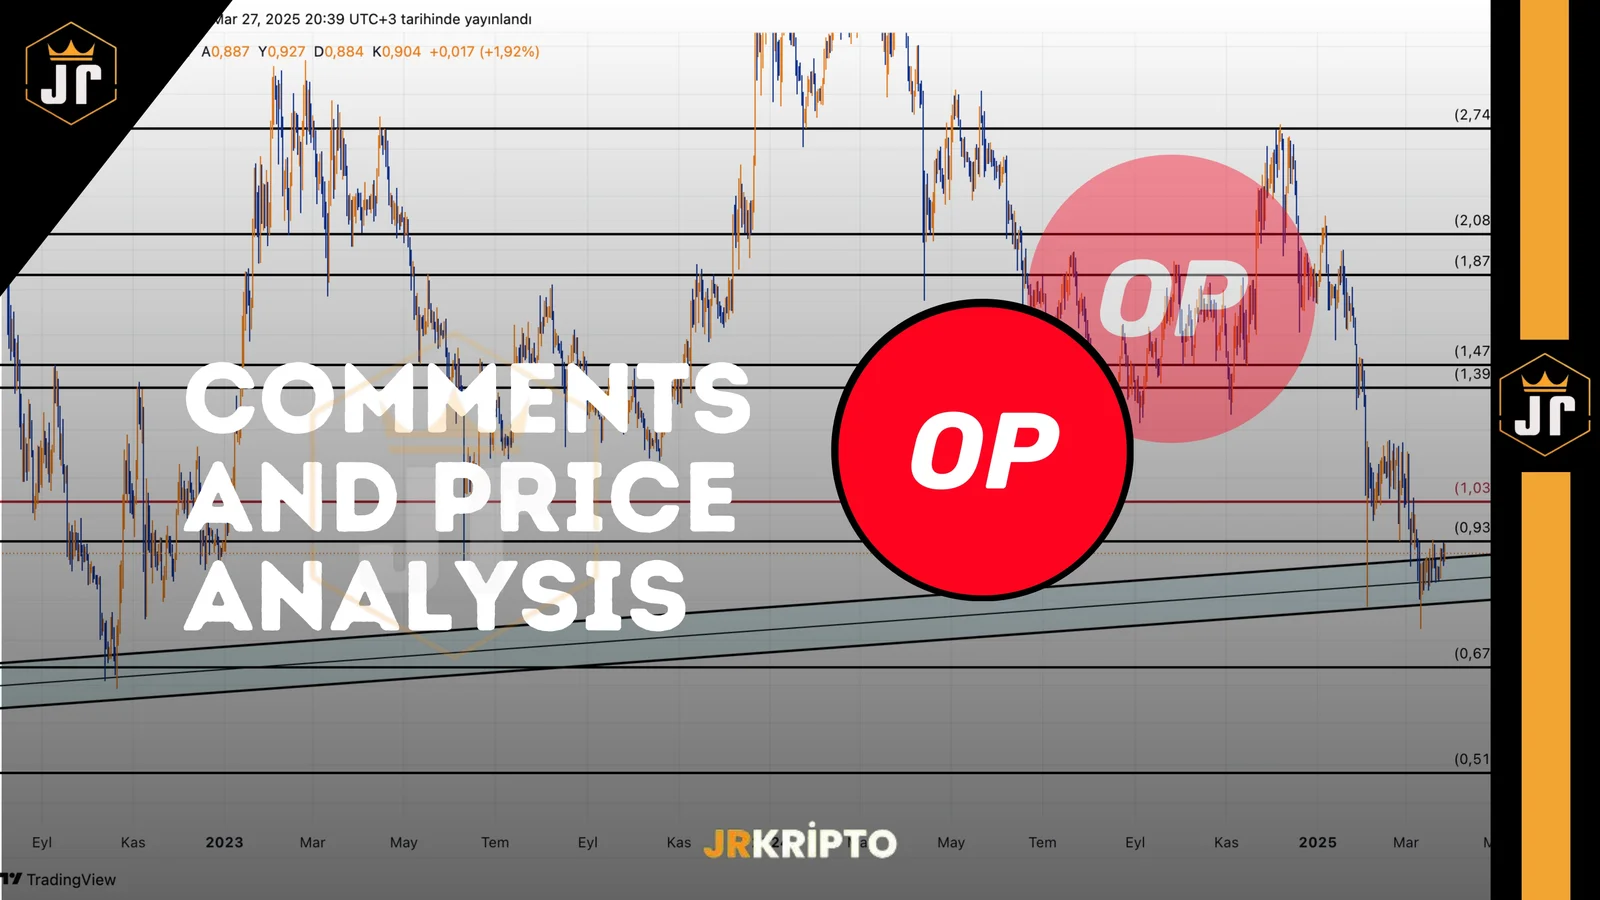
OP: Comments and Price Analysis 27.03.2025
Optimism (OP) Technical AnalysisOptimism has been maintaining its descending channel structure for a while. Currently trading at 0.887$, the price is approaching the upper boundary of the channel. This level is technically critical for a potential breakout. The gradual recovery that started around the 0.742$ level has continued steadily, and now all eyes are on the 0.979$ resistance. This level is significant as it not only serves as resistance but also intersects with the descending channel. OP Key Support and Resistance Levels for OPUSDTSupport Levels:0.742 – 0.770 (Strong demand zone)0.850 (Short-term support)Resistance Levels:0.979 (Critical resistance at channel intersection)1.162 – 1.228 (Important medium-term resistance)1.434 (Previous reversal level)1.676 – 1.771 (Strong resistance zone, crucial for trend reversal)The price is currently very close to the 0.979$ resistance. A breakout with strong volume could signal the end of the descending channel and the beginning of a new upward movement. Otherwise, there’s a risk of a pullback toward support areas.From a technical indicator perspective, the RSI shows a slight upward move, which may signal a shift in momentum. While volume isn’t particularly strong yet, any breakout around this level may indicate that accumulation has started.Strategic Suggestions for InvestorsThe 0.979$ level is important. A daily close above this level could be the first signal of a breakout. Following a breakout, the first target would likely be the 1.16-1.22 zone. However, daily closes below 0.850$ should be watched closely.In summary, Optimism is approaching the end of its descending channel. If the price can surpass the 0.979$ level and hold above it with daily closes, it could mark the start of a new uptrend. If not, a retracement back to the 0.77- 0.74 range remains possible. This makes the current period a critical phase for OP. The next few days will provide clearer direction.Disclaimer:This analysis does not constitute investment advice. It focuses on support and resistance levels that may present potential short- to mid-term trading opportunities depending on market conditions. However, all responsibility for trading decisions and risk management lies entirely with the user. The use of stop-loss orders is strongly recommended for any trade setup shared.
Daily Market Summary with JrKripto 27 March
You can access the "Daily Market with JrKripto" summary, where we compile daily important developments in cryptocurrency, global and local markets, below.Come on, let's analyze the general situation in the markets together and take a look at the most up-to-date evaluations.Bitcoin (BTC) is currently trading at $ 86,444. According to technical analysis, $ 82,000 stands out as a strong support area. If the price drops below this level, a pullback to $ 80,000 and below may occur with the deepening of the decline. In upward movements, $ 88,000 is followed as a resistance point. If BTC exceeds this level and maintains its permanence above it, an upward movement towards $ 90,000 and above may be seen.Ethereum (ETH) is currently trading at $ 2,366. While the $2,250 level stands out as a support zone, if this level is broken, the risk of a pullback to $2,200 and below may increase. In upward movements, $2,500 stands out as a resistance point. If ETH breaks this level, it may gain strong momentum towards the $2,650 level.Crypto NewsSEC accepts Grayscale Spot Ethereum ETF's staking permit application.Avalanche's Visa-based credit card Avalanche Card is now available.Ondo Finance ($ONDO) announced a partnership with Mastercard.SEC also ends OpenSea investigation; Illuvium Labs cuts 40% of its workforce.Nvidia earnings reports came in above expectations.CryptocurrenciesTop RisersKAITO → up 33.5% to $2.72.SAFE → up 19.8% to $0.6169.GRASS → up 17.0% to $2.02.AB → up 14.2% to $0.0126.POPCAT → up 13.3% to $0.2666.Top FallersBTSE → down 14.7% to $1.21.LCX → down 10.5% to $0.2132.QNT → down 9.3% to $100.27.XDC → down 8.3% to $0.0825.TKX → down 8.2% to $30.31.Total Daily Net ETF InflowsBTC ETFs: -$754.60METH ETFs: -$94.30MData to Watch Today16:30 | 🇺🇸 US - Gross Domestic Product (GDP) (Q4)Expected: 2.3%Previous: 3.1%16:30 | 🇺🇸 US - Jobless ClaimsExpected: 222KPrevious: 219KGlobal MarketsNvidia announced its earnings and forecasts after the stock market closed, with revenue beating expectations. US indices opened the day with strong buying after last week’s sell-off, but were followed by a sell-off after Trump announced a 25% tariff on the EU. Trump also stated that tariffs on Mexico and Canada would go into effect in April. The S&P 500 Index rose by 0.01%, the Nasdaq by 0.26%, while the Dow Jones lost 0.43%. In terms of sectors, technology (0.89%), infrastructure (0.38%) and telecom closed positive, while essential consumption (1.86%), healthcare (0.69%) and real estate (0.59%) lost value. New home sales in the US decreased by 10.5% in January, falling above expectations (expectation: -2.6%) and reaching 657 thousand units. The median home sales price increased by 3.7%. MBA home loan applications fell by 1.2% for the second week in a row. The 30-year fixed home loan interest rate fell to 6.88%. Today, markets will follow the second estimate of the 4th quarter growth data in the US, durable goods orders, weekly unemployment benefits applications and pending home sales data. The US economy grew by 2.3% in the fourth quarter according to initial estimates, with consumer spending making the biggest contribution. US futures are trending positive after Nvidia's strong balance sheet. Asian stock markets are expected to open positively, while European stock markets are expected to open negatively.The Most Valuable Companies and Stock PricesApple (AAPL) → Market value $3.61T, share price $240.36, -2.70% down daily.NVIDIA (NVDA) → Market value $3.22T, share price $131.28, +3.67% up daily.Microsoft (MSFT) → Market value $2.97T, share price $399.73, +0.46% up daily.Amazon (AMZN) → Market value $2.27T, share price $214.35, +0.73% up daily.Alphabet (GOOG) → Market value $2.12T, price per share $174.70, daily %-1.51 decrease.Borsa IstanbulToday, the Economic Confidence Index for February and the final foreign trade statistics of the Turkish Statistical Institute for January will be announced. According to the provisional data of the Ministry of Trade, exports increased by 5.8% annually in January to $21.2 billion, while imports increased by 10.2% to $28.8 billion.The BIST100 index closed positively for the first time since Friday. Aselsan's strong balance sheet and the positive divergence of the banking index were effective in this increase. The talks between the Russian and US delegations to be held in Istanbul today are being closely monitored by the markets. Positive movements were observed yesterday in the stocks of companies that could benefit from a possible peace between Russia and Ukraine, and interest in these stocks continues todayIt can be expected.Closing above the 9600 level in the index may end the decline in the short term and support a return to the 9600-10000 band. Closing above the 9600 level will be monitored to maintain the strength of yesterday's reaction.BIST100 closed at 9573 yesterday with a reaction from the 9422 level. However, the continuation of the movement below the averages indicates that the weak course continues. For a new optimism in the index, it is necessary to rise above the 9650-9715 levels. Otherwise, the weak outlook may continue. The 9221-8618 band is in a strong support position as the November 2024 bottom zone.The Most Increased Stocks:VSNMD → increased by 9.96% to 93.30 TL.PAPIL → increased by 9.95% to 13.70 TL.DAGHL → increased by 9.92% to 24.82 TL.SEGY0 → increased by 9.90% to 4.55 TL.BULGS → increased by 8.85% to 18.95 TL.Stocks That Decreased the Most:BNTAS → decreased by -46.02% to 5.56 TL.ICUGS → decreased by -9.98% to 19.03 TL.TDGYO → decreased by -9.98% to 15.24 TL.GRSEL → decreased by -8.06% to 220.10 TL.AYES → decreased by -4.49% to 8.93 TL.Companies with the Highest Market Value on Borsa IstanbulQNB Finansbank (QNBTR) → 850.9 billion TL market value, 259.00 TL per share, +1.97% increase.Türkiye Garanti Bankası (GARAN) → 538.86 billion TL market value, 131.3 TL per share price, +2.34% increase.Türk Hava Yolları (THYAO) → 439.19 billion TL market value, 320.50 TL per share price, +0.71% increase.Aselsan Elektronik Sanayi (ASELS) → 382.13 billion TL market value, 83.70 TL per share price, -0.12% decrease.Koç Holding (KCHOL) → 380.38 billion TL market value, 150.5 TL per share price, +0.33% increase.Precious Metals and Currency PricesGold: 3455 TLSilver: 37.26 TLPlatinum: 1142 TLDollar: 36.45 TLEuro: 38.21 TLHope to meet again tomorrow with the latest news!

Daily Market Summary with JrKripto 27 March 2025
You can find today’s “Daily Market Recap with JrKripto,” where we compile the most important daily developments in global and local markets, below.Let’s analyze the overall market conditions together and take a look at the latest evaluations.Bitcoin (BTC) is currently trading at $87,400. The $79,100 – $80,763 range stands out as a strong support zone. BTC held this level, surpassed the $85,600 resistance, and continued its upward trend. If the upward movement persists, the $90,700 level will be a critical resistance point. However, in the case of a pullback, $85,600 will be followed as the first support level.Ethereum (ETH) is trading at $2,020. The $1,900 level is being maintained as a strong support, and ETH received an upward reaction from this area. After breaking the $2,000 resistance, the bullish momentum accelerated, with the next target set at $2,250. If this level is breached, the price may accelerate toward $2,534 and $2,721. On the downside, the $2,000 support will be monitored. Closures below this level could bring the $1,900 support back into focus.Crypto NewsFidelity, a $6 trillion asset manager, will launch its own crypto stablecoin.Injective announced a partnership with Google Cloud.The state of Wyoming will launch its own stablecoin this year.GameStop to issue $1.3 billion in bonds to purchase Bitcoin.Trump: "I will be very fair and kind on April 2."Top Gainers in CryptocurrenciesZETA → up 23.3%, now at $0.40336NTGL → up 9.5%, now at $0.00109613SAFE → up 9.1%, now at $0.512805SUI → up 8.9%, now at $2.78FLUID → up 8.7%, now at $5.60Top Losers in CryptocurrenciesSATS → down 12.3%, now at $0.02678821GIGA → down 11.6%, now at $0.02047937AI16Z → down 11.5%, now at $0.19139784CHEEMS → down 11.2%, now at $0.00000171HYPE → down 9.9%, now at $14.45Other DataDominance:Bitcoin: 61.68% ▼ 0.17%Ethereum: 8.69% ▲ 0.07%Daily Net ETF FlowsBTC ETFs: $89.60 MillionETH ETFs: -$5.90 MillionKey Data to Watch Today15:30 – USA | Gross Domestic Product (GDP) (quarterly) (Q4)Forecast: 2.3%Previous: 3.1%15:30 – USA | Initial Jobless ClaimsForecast: 225KPrevious: 223KGlobal MarketsU.S. stock indices ended the day lower, losing the optimism that had prevailed since the beginning of the week after new announcements regarding tariffs. Former U.S. President Donald Trump’s declaration of a 25% tariff on cars produced outside the U.S. decreased investor risk appetite. Nasdaq dropped 2.04%, S&P 500 fell 1.12%, and the Dow Jones lost 0.31%.By sector, consumer staples (1.42%), infrastructure (0.70%), energy (0.60%), and real estate (0.52%) performed positively, highlighting demand for defensive sectors. However, technology (-2.46%), telecommunications (-2.04%), and consumer discretionary (-1.67%) saw the biggest losses.Today, the final estimate for Q4 U.S. growth, weekly jobless claims, and pending home sales will be announced. The U.S. economy grew 2.3% annually in Q4, with the main contribution from consumer spending. Housing investments and public spending also supported growth. Net exports contributed 0.12 points to GDP.Asian markets are trading mixed, while European markets are expected to start the day in negative territory.Top Companies by Market Cap and Share PriceApple (AAPL) → $3.33T market cap, $221.53/share, ▼ 0.99%Microsoft (MSFT) → $2.90T market cap, $389.97/share, ▼ 1.31%NVIDIA (NVDA) → $2.78T market cap, $113.76/share, ▼ 5.74%Amazon (AMZN) → $2.13T market cap, $201.13/share, ▼ 2.23%Alphabet (GOOG) → $2.02T market cap, $167.14/share, ▼ 3.27%Borsa IstanbulBorsa Istanbul fell below the 9,700 level yesterday, witnessing a capital outflow of approximately 500 million TL. Momentum in the market remains weak, and political developments continue to influence volatility, which is expected to stay high.Today, markets will monitor the Central Bank of Turkey’s reserve data and foreign investor activity in stocks and bonds at 14:30. It’s estimated that around $25 billion in reserves were used during recent currency fluctuations. A larger-than-expected reserve loss would negatively impact TL assets, while a smaller loss could be seen positively.On the global side, markets are watching U.S. GDP, jobless claims, and pending home sales data. Additionally, a U.S. Congressional Budget Office (CBO) warning that the country may run out of funds to pay its debt by August or September is affecting global risk appetite. Turkey’s 5-year CDS rose to 308 basis points following this.According to the Central Bank’s March inflation expectations, market participants' 12-month inflation forecastdropped to 24.6% (-0.7 pts), real sector forecast declined to 41.1% (-0.8 pts), while household expectations rose slightly to 59.3% (+0.1 pts).In the bond market, the 2-year yield increased to 44.6% (+1.6 pts) and the 10-year yield to 32.4% (+1.1 pts).Today, Turkey's foreign trade and unemployment data for February will be released. According to preliminary data from the Ministry of Trade, exports in February declined 1.5% YoY to $20.8 billion, while imports rose 3.8% YoY to $28.9 billion. Consequently, the trade deficit widened by $1.4 billion YoY to $8.2 billion.Yesterday, Borsa Istanbul saw a bearish session. While bank stocks experienced profit-taking, gold mining stocks stood out positively. A slight upward bias is expected today.The BIST 100 index tested 9,750 during the day and closed at 9,650. Technically, the 9,784 – 9,895 range is the nearest resistance, and if breached, the index could move toward 9,990 and 10,197. Support levels are 9,594 – 9,451, with a potential retest of 9,221 – 8,870 if these break.Upcoming critical data includes BDDK’s banking sector data on April 2 and March inflation figures on April 3, both likely to influence market direction.Top Gainers on Borsa IstanbulGEDZA → ▲ 10.00%, to 29.04 TLYBTAS → ▲ 10.00%, to 226,030.00 TLVSNMD → ▲ 9.99%, to 191.60 TLINVES → ▲ 9.98%, to 232.50 TLDERHL → ▲ 9.97%, to 45.68 TLTop Losers on Borsa IstanbulCASA → ▼ 10.00%, to 62.10 TLKENT → ▼ 10.00%, to 765.00 TLATEKS → ▼ 9.98%, to 73.10 TLDYOBY → ▼ 7.97%, to 23.56 TLDURDO → ▼ 7.29%, to 3.94 TLTop Companies by Market Cap on Borsa IstanbulQNB Finansbank (QNBTR) → 1.17 trillion TL, 380.00 TL/share, ▲ 8.57%Aselsan (ASELS) → 528.96 billion TL, 116.50 TL/share, ▲ 0.43%Garanti Bank (GARAN) → 500.64 billion TL, 120.80 TL/share, ▲ 1.34%Turkish Airlines (THYAO) → 427.45 billion TL, 311.75 TL/share, ▲ 0.65%Koç Holding (KCHOL) → 419.69 billion TL, 164.10 TL/share, ▼ 0.85%Precious Metals and Exchange RatesGold: 3,716 TLSilver: 41.26 TLPlatinum: 1,197 TLUSD/TRY: 37.99EUR/TRY: 41.15See you again tomorrow with the latest updates!

Critical Move from the Financial Giant: Fidelity Launches Its Own Stablecoin
Fidelity Investments, one of the world’s largest asset managers with approximately $6 trillion in assets under management, has announced plans to launch a new stablecoin, marking a significant expansion into the crypto space. According to The Financial Times, the stablecoin will be issued through Fidelity Digital Assets, the company’s dedicated digital asset platform.Fidelity Enters the Stablecoin Market as U.S. Regulation LoomsThis development comes as the United States prepares to roll out comprehensive stablecoin regulations. Fidelity’s move positions it to compete directly in a market currently dominated by leaders like Tether (USDT) and Circle (USDC).In addition to the stablecoin, Fidelity is also introducing a new Ethereum-based share class called "OnChain" for its U.S. dollar money market fund. The company has filed with the U.S. Securities and Exchange Commission (SEC), noting that this product will track transactions of the $80 million Fidelity Treasury Digital Fund (FYHXX). If approved, the offering is expected to launch by May 30.Fidelity's Stablecoin Initiative: Key HighlightsThe new stablecoin will be launched via Fidelity Digital AssetsThe company is developing an Ethereum-based financial product linked to its money market fundThe stablecoin aims to compete in a market currently led by USDT and USDCThe timing aligns with upcoming U.S. stablecoin regulations, making it a strategic moveStablecoin Industry Heats Up Post-U.S. ElectionFidelity isn’t alone in ramping up efforts in the stablecoin space. Following Donald Trump’s return to the presidential spotlight, U.S. financial firms have accelerated their digital currency initiatives.One such example is World Liberty Financial (WLFI), a DeFi project backed by Trump allies, which recently announced its own stablecoin: USD1.Meanwhile, the proposed GENIUS Act is expected to lay the foundation for the U.S. stablecoin regulatory framework, introducing standards for asset backing and strict anti-money laundering (AML) compliance.Even Federal Reserve Board Member Christopher Waller acknowledged the growing importance of stablecoins in the financial ecosystem, referring to them as "real dollars" in a digital form.Additionally, firms like Custodia and Vantage Bank are exploring Ethereum-based stablecoin issuance, highlighting a broader industry shift toward tokenized financial products.Looking Ahead: A More Regulated Stablecoin EraFidelity’s entry into the stablecoin market is more than a competitive move—it’s a signal of growing institutional confidence in tokenized finance. With regulatory clarity expected in the next two months, the U.S. stablecoin industry appears poised to enter a more transparent and regulated phase.As the landscape evolves, Fidelity's reputation and scale could significantly influence the direction of the stablecoin market, potentially setting new standards for security, transparency, and compliance in digital finance.

GameStop Updates Its Investment Strategy by Adding Bitcoin to its Treasury Reserves
In a bold strategic shift, GameStop has announced that it will include Bitcoin (BTC) among its treasury reserve assets. This move marks a pivotal moment in the video game retailer’s financial transformation and signals its adoption of a more dynamic, crypto-forward corporate strategy.The company’s board of directors unanimously approved the decision to allocate a portion of its cash reserves for purchasing Bitcoin. This mirrors the corporate Bitcoin investment model previously adopted by companies like MicroStrategy, highlighting a growing institutional embrace of digital assets.Back in February, CNBC reported that GameStop was planning to invest in Bitcoin and other cryptocurrencies. The company has now confirmed those reports and expanded on them—revealing that its crypto investment plans are not limited to its existing cash reserves. Future funds raised through debt issuance or stock offerings may also be partially allocated to Bitcoin and USD-backed stablecoins.As of February 1, GameStop held approximately $4.8 billion in cash on its balance sheet. Interestingly, the company has not set an upper limit for its Bitcoin investments, suggesting a flexible and market-responsive treasury strategy.This decision is seen as part of a broader transformation led by CEO Ryan Cohen, who has prioritized cost reduction, operational restructuring, and the development of new revenue streams to ensure GameStop’s long-term sustainability.Key Highlights of GameStop’s Bitcoin Investment StrategyUnanimous board approval for allocating cash reserves to BitcoinPlanned crypto investments using both current cash and future fundraisingNo upper limit on Bitcoin holdings, reflecting a flexible policyAligned with CEO Ryan Cohen’s transformation vision for the companyThis move positions GameStop alongside a growing list of corporations embracing crypto assets, reaffirming the rising trend of institutional adoption in the digital asset space. As more companies explore Bitcoin as a treasury hedge or growth asset, GameStop’s entry could further legitimize crypto in the corporate finance world.

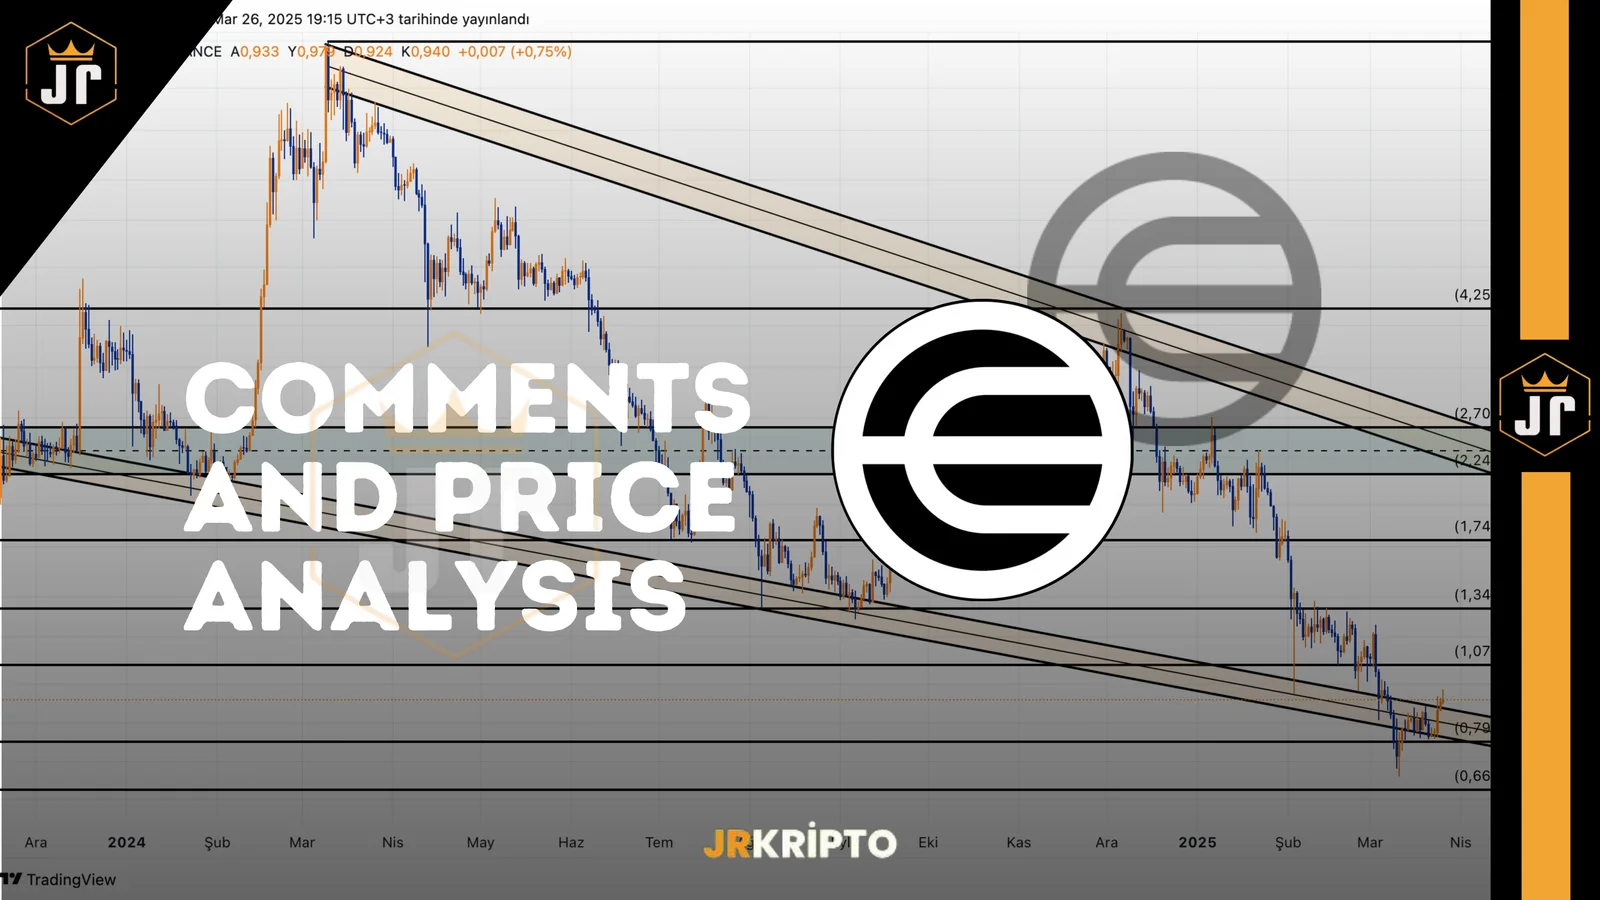
WLD: Comments and Price Analysis 26.03.2025
Worldcoin (WLD) Technical Analysis: On the Verge of Breaking the DowntrendWorldcoin (WLD) has managed to climb back up to its descending trendline after experiencing heavy selling pressure in recent months. The current price sits at $0.926 USDT, a critical level from a technical standpoint, as it aligns with the resistance of the downtrend that has been in place since December.If WLD fails to break this trendline, renewed downward pressure could emerge. However, a successful breakout would signal a potential trend reversal in the short term. WLD Key Technical Levels for WLD/USDTSupport Zones:$0.750 – Psychological support$0.701 – Major bottom levelResistance Zones:$1.022 – Downtrend resistance + short-term horizontal resistance$1.291 – $1.392 – Medium-term resistance range$1.720 – Area of previous heavy selling$2.126 – $2.292 – Long-term target zone$2.895 – $4.220 – Broad time-frame potential resistance areaThe red descending trendline on the chart represents a well-established resistance that has been tested multiple times, but not broken. In technical analysis, the more a trendline is tested, the stronger the breakout can be once it occurs.Currently, WLD is very close to this trendline. A daily close above it would confirm a bullish breakout. Otherwise, the price could retrace back to the $0.750 – $0.701 support zone.What Are the Technical Indicators Suggesting?RSI is in the neutral zone but has started to point upward, signaling potential momentum shift.Volume has noticeably increased over the past few days, indicating rising interest and suggesting any breakout may be supported by strong buyer activity.Suggested Strategy for TradersWatch for Breakout Confirmation: Wait for daily closes above $1.022 to validate the move.Risk Management: A close below $0.750 would invalidate the bullish scenario.Stepwise Targeting: If the trendline breaks, consider targeting the $1.291 – $1.720 range progressively.These strategies aim to help traders seize potential opportunities while minimizing risk as the price action unfolds.Worldcoin at a Pivotal Decision PointThe WLD/USDT pair is currently testing the descending trendline. The next movement from this level will be crucial in determining the direction. A breakout with strong volume could lead to a quick rally toward $1.29 and even $1.72 in the short term.However, if the price fails to break above and remains below the trendline, we may see continued consolidation or a pullback. That’s why this zone marks a key decision point for Worldcoin investors.Disclaimer: This analysis does not constitute financial advice. It is intended to highlight potential trading opportunities based on support and resistance zones under current market conditions. All trading decisions and risk management remain the responsibility of the individual. Use of stop-loss orders is strongly recommended.
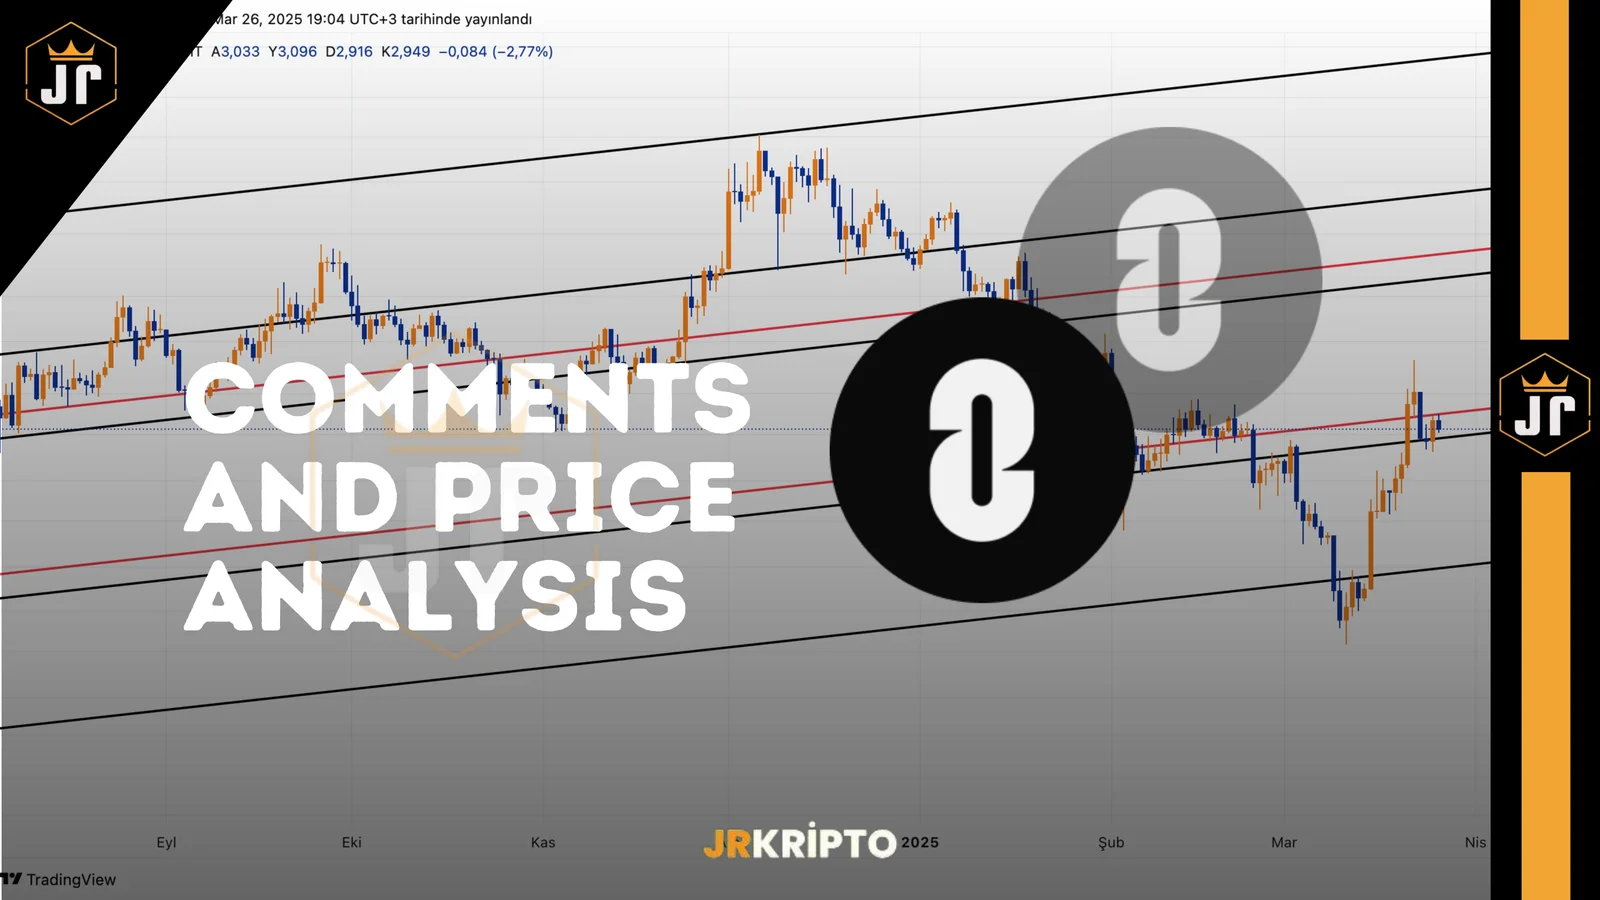
ZRO: Comments and Price Analysis 26.03.2025
LayerZero (ZRO) Technical Analysis: Breakout Confirmed—Is a Bullish Trend Underway?LayerZero has recently broken out of its long-standing descending channel, drawing significant attention in the crypto market. The ZRO/USDT pair is currently trading around $2.951, and this breakout marks a critical technical event. Breakouts from descending channels often signal the start of a new bullish trend.Previously, ZRO had fallen as low as $1.492, where it encountered strong buying interest and quickly rebounded, pushing above the channel’s upper boundary. The price is now testing the previous resistance zone between $2.774 and $2.591 as a new support. ZRO Key Technical Levels for ZRO/USDTSupport Zones:$2.774 – $2.591 – Key breakout support zone (previous resistance)$2.098 – Short-term support$1.492 – Previous bottom levelResistance Zones:$3.360 – Initial short-term resistance$4.069 – $4.357 – Medium-term resistance range$5.381 – Mid-to-long-term resistance$7.567 – Major long-term resistanceHolding above $2.774 is critical for ZRO to continue its move toward $3.360 and then $4.069, both of which have historically acted as strong reaction zones.What Does the Channel Breakout Indicate?The breakout from the descending channel confirms a shift away from bearish pressure, marking a potential trend reversal for ZRO/USDT. This has positively impacted market sentiment, giving the price room to move within a more bullish structure.Increased volume during the breakout further supports the move, while momentum indicators like RSI are showing upward divergence from the neutral zone—reinforcing the likelihood of continued upside.Suggested Strategy for TradersHold Above Support: Maintaining daily closes above the $2.774 – $2.591 zone keeps the bullish outlook intact.Target Resistance: The next key level is $3.360, which may act as a short-term target.Risk Management: A close below $2.591 could invalidate the bullish scenario, indicating the breakout may have been temporary.Post-breakout pullbacks are often healthy and provide better entries. If buyers step in again near the support zone, the bullish case for LayerZero could strengthen significantly.Is a Trend Reversal Underway for LayerZero?LayerZero may have officially ended its downtrend and entered a bullish structure. The technical breakout and support holding behavior suggest renewed upward potential. A confirmed break above $3.360 in the coming days could shift focus to medium-term targets and initiate a broader rally in ZRO/USDT.Disclaimer: This analysis does not constitute financial advice. It highlights potential support and resistance levels that could offer short- to medium-term trading opportunities under current market conditions. All trading decisions and risk management are the sole responsibility of the trader. Using stop-loss orders is strongly recommended.
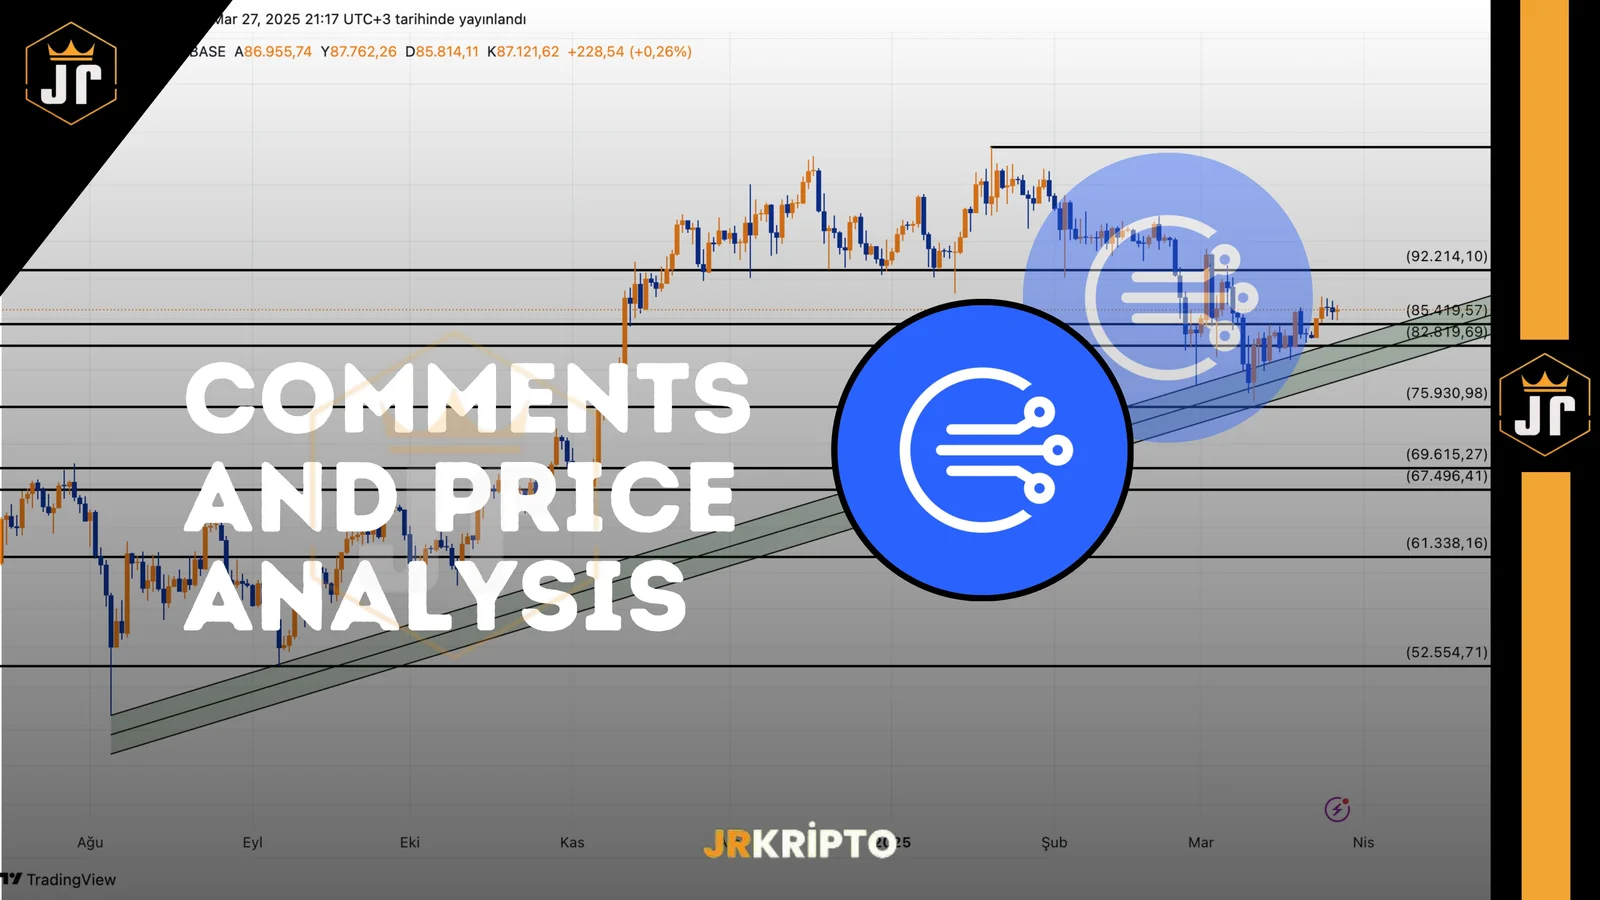
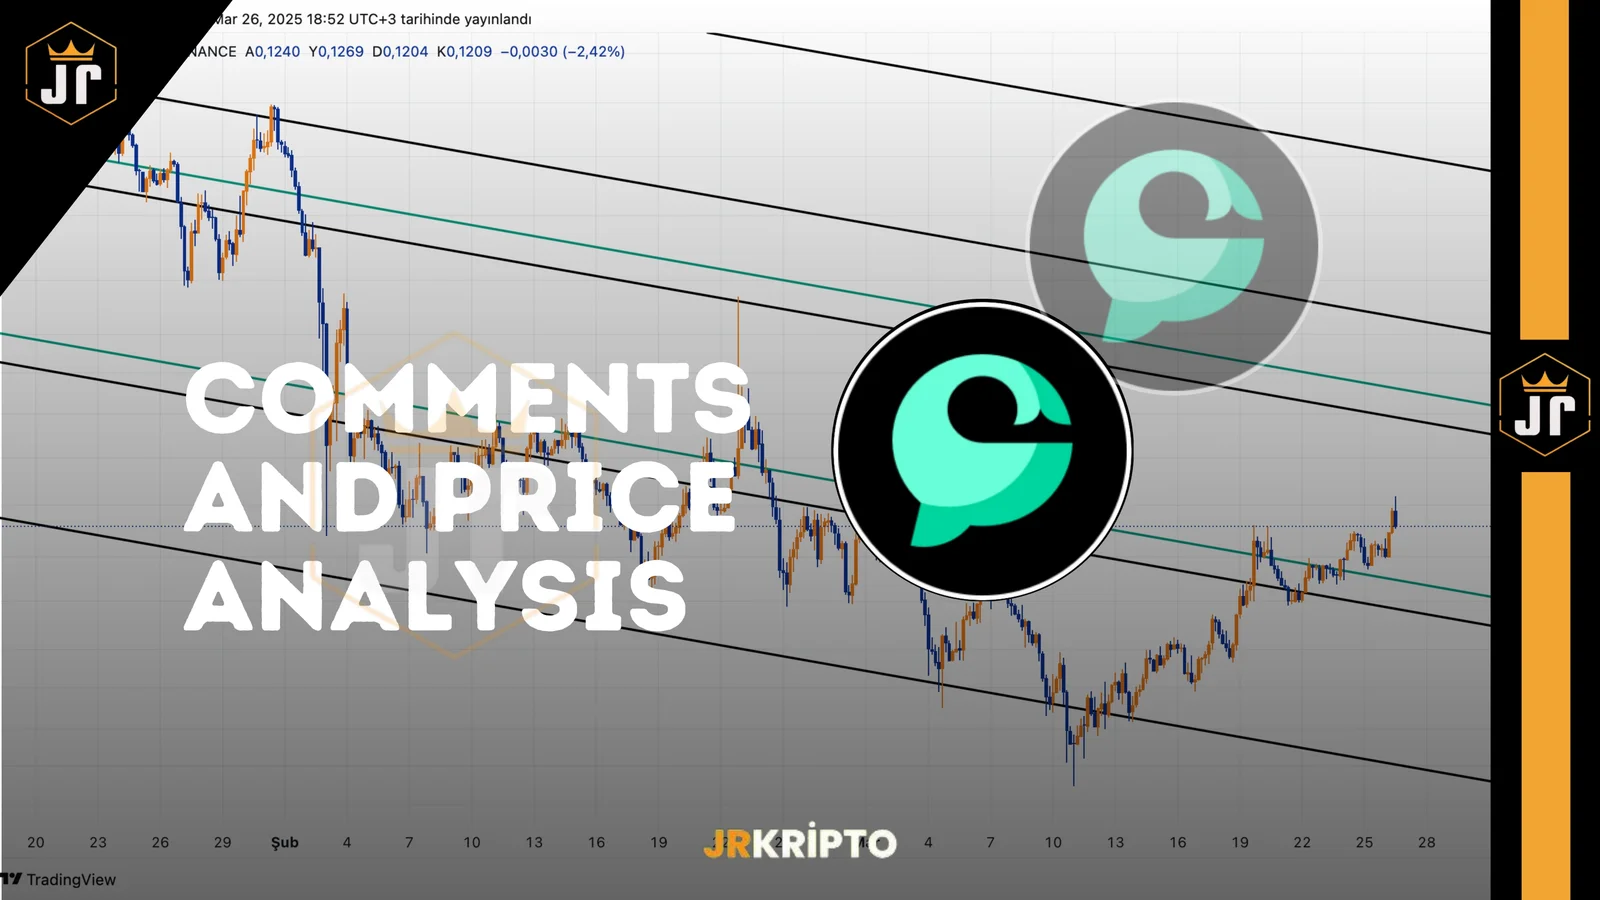
CETUS: Comments and Price Analysis 26.03.2025
Cetus Protocol (CETUS) Technical Analysis: Approaching a Key Breakout ZoneCetus Protocol is showing signs of a potential upward move within a long-standing descending channel pattern. Currently, the CETUS/USDT pair is trading at $0.1233, hovering near both the upper boundary of the channel and a key horizontal resistance level—suggesting a possible breakout is on the horizon.Since January, CETUS has been in a downtrend but has begun to recover from the $0.0788 support zone. A series of consecutive bullish daily closes and the break of lower low formations signal a potential shift in short-term momentum favoring buyers. CETUS Key Technical Levels for CETUS/USDTSupport Zones:$0.1160 – $0.1050 – Channel support zone$0.0870 – $0.0788 – Recent bottom levelsResistance Zones:$0.1474 – $0.1592 – First major resistance block$0.1979 – Previously tested resistance$0.2460 – $0.2658 – Medium-term resistance area$0.3377 – $0.4000 – Long-term upside targetsAs long as the price holds above $0.1160, the upward potential remains intact. The $0.1474 – $0.1592 zone will be critical in determining the direction of the next major move.What Happens If the Channel Breaks?The current narrowing channel structure often precedes sharp moves. Right now, the price is testing the channel’s upper band. A confirmed breakout above this level could spark a swift rally in the short term.What Should CETUS Traders Watch?Daily Close Above $0.1250: A close above this level would confirm a bullish breakout.Maintain Key Support: A close below $0.1160 would indicate renewed weakness.Staggered Targeting Strategy: Track key resistance levels from $0.1474 up to $0.1979 progressively.Rather than chasing impulsive moves, traders should wait for confirmed breakouts and set clear stop-loss levels to manage risk effectively.The First Steps of a Potential CETUS RallyCetus Protocol is technically nearing the end of its descending channel structure. Price action and indicators suggest growing potential for a short-term breakout to the upside. If the price manages a daily close above the channel, the first target for the CETUS/USDT pair will be around $0.1474.The overall outlook is increasingly positive, and the technical structure appears to be gearing up for a potential trend reversal—potentially marking the beginning of a new bullish wave for CETUS.Disclaimer: This analysis is not financial advice. It is intended solely for informational purposes, focusing on support and resistance zones that could offer short- to medium-term trading opportunities under current market conditions. All trading decisions and risk management are the sole responsibility of the trader. Using stop-loss strategies is strongly recommended.
Avalanche's Visa-Based Credit Card, Avalanche Card, Has Been Launched.
Avalanche Card: Visa-Backed Crypto Credit Card LaunchedThe Avalanche ecosystem has taken a significant step to facilitate the everyday use of cryptocurrencies. The new Visa-backed crypto credit card, Avalanche Card, has been launched in partnership with Rain. This card allows users to spend their digital assets such as USDC, USDT, AVAX, and Wrapped AVAX (wAVAX) directly, without converting them into any fiat currency.A New Era in Crypto SpendingThe Avalanche Card enables crypto payments in physical and online stores using Visa’s global payment network. The card is seen as a major innovation, especially in regions with limited access to financial services such as Southeast Asia, Africa, and Latin America.John Wu, President of Ava Labs, commented on the new product:"With Avalanche Card, cryptocurrencies become a powerful tool for everyday financial transactions. Mainstream adoption of digital assets will accelerate by offering practical solutions similar to traditional credit card usage."Cuy Sheffield, Head of Crypto at Visa, also highlighted the card’s convenience, saying:"Thanks to Visa’s wide acceptance network, crypto holders can now easily use their digital assets for daily purchases."No Need for Fiat ConversionOne of the most notable features of the Avalanche Card is that users can spend their crypto without having to pre-convert it into fiat currency. This provides a major advantage, particularly in regions where traditional banking infrastructure is lacking.Backed by the Avalanche Foundation, this innovative product aims to increase real-world usage of blockchain-based financial services. Sheffield added:"This step is a significant advancement in expanding access to digital payments in areas with limited financial inclusion."Avalanche Card and Its Impact on the Crypto EcosystemThe Avalanche network, known for its high transaction speed and scalability, provides a robust infrastructure for decentralized applications (dApps) and financial solutions. Thanks to the Avalanche Consensus Mechanism, the network enables near-instant transaction finality, making it more practical to use crypto assets for everyday transactions.The Avalanche Card is seen as a significant step toward integrating cryptocurrencies into the traditional financial system. Users will be able to pay with this card anywhere Visa is accepted. Additionally, the card will work in conjunction with a self-custody wallet, where each asset will have a unique address.This development could mark an important turning point in the mainstream adoption of cryptocurrencies in the financial world. The Avalanche Card aims to prove that cryptocurrencies can be used not just as investment tools, but also for daily spending.
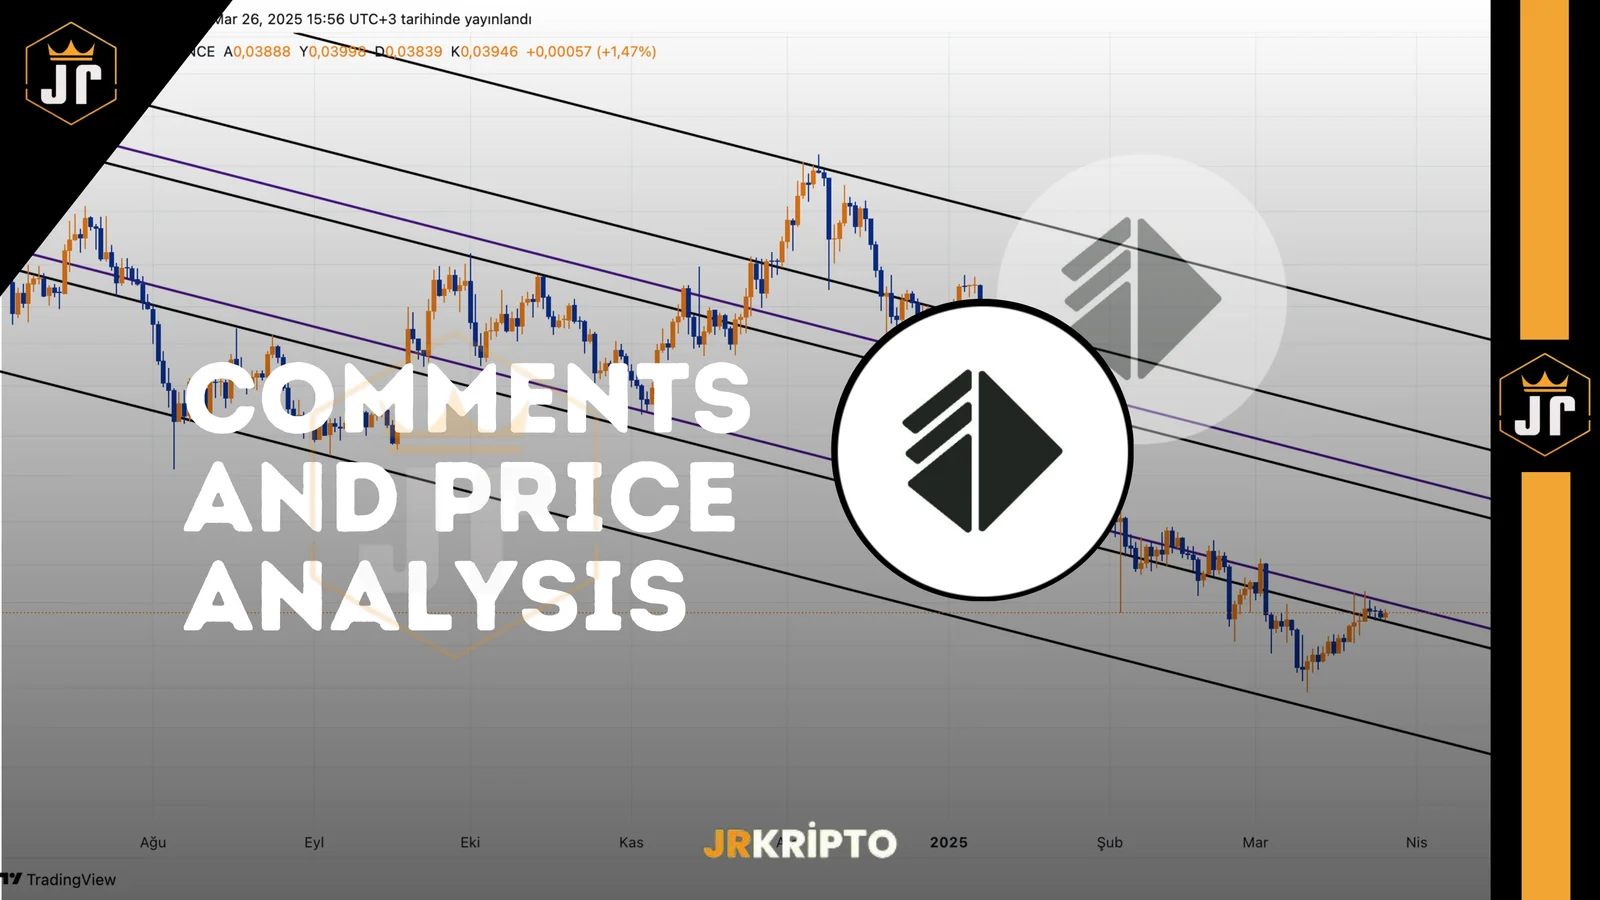
ALT: Comments and Price Analysis 26.03.2025
AltLayer (ALT) Technical Analysis: Testing the Channel ResistanceAltLayer has been trading within a descending channel pattern for quite some time. As of now, the ALTUSDT pair is priced at $0.03983, which is hovering close to both the upper boundary of the descending channel and a short-term horizontal resistance zone. The technical setup suggests that a breakout above this level could trigger a potential recovery move.Price Action OverviewOver the past few months, AltLayer has been forming lower highs and lower lows amid ongoing bearish pressure. However, recent price consolidation near the upper edge of the channel indicates that the downward momentum might be weakening. This sideways movement could be a precursor to a trend reversal.Key Technical Levels for ALTUSDTSupport Zones:$0.02950 – Lower boundary of the channel$0.03500 – Short-term support$0.04451 – May flip to support after a confirmed breakoutResistance Zones:$0.04451 – Channel top + horizontal resistance$0.05741 – $0.06252 – Medium-term resistance range$0.07854 – Previously a strong reaction area$0.09896 – $0.10744 – Major resistance zone$0.13859 and $0.20908 – Long-term target levelsIf the price manages to break above the $0.04451 resistance, the next target will be the $0.05741 – $0.06233 range. This area is crucial from both a technical and psychological standpoint, having served as a reversal zone in past price movements.Descending Channel & Market StructureThe descending channel in the chart highlights AltLayer’s controlled yet steady decline. Such formations often signal potential for sudden directional shifts. The frequent touches on the channel’s upper boundary increase the likelihood of an upward breakout.Strategy for TradersBreakout Confirmation: A close above $0.04451 could trigger a bullish scenario.Volume Analysis: Breakouts with strong volume are more sustainable; low-volume rallies may be false signals.Support Monitoring: A close below $0.03500 would signal a continuation of the downtrend.AltLayer at a Critical JunctureAltLayer is currently testing the upper limit of its descending channel. Technical indicators point toward the potential for short-term bullish momentum if this level is breached with strong volume. A confirmed breakout above $0.04451would set the first upward target at around $0.05759.The current price compression and horizontal consolidation within the channel suggest that a new trend could be forming. As such, AltLayer is at a technically pivotal level, and the price action in the coming days will be crucial in determining its direction.Disclaimer: This analysis does not constitute financial advice. It is intended for informational purposes only and highlights potential support and resistance zones based on market conditions. All trading decisions and risk management are the sole responsibility of the trader. Stop-loss usage is strongly recommended when entering any position.