Open Campus (EDU) Technical Analysis
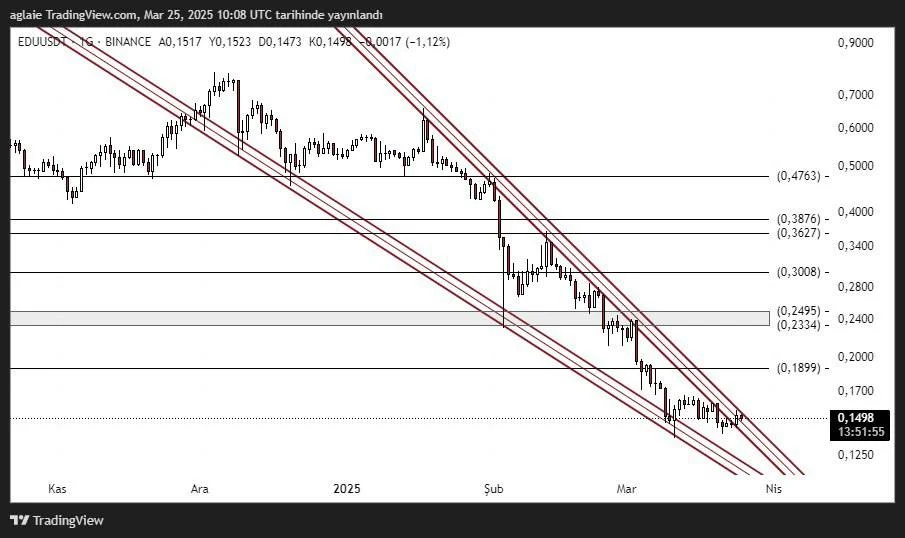
The EDU/USDT pair has been priced in a descending channel for a long time. According to the current chart data, the price is at 0.1498 levels. This indicates that it is very close to critical support areas.
The fact that EDU Coin is under pressure attracts the attention of investors. Especially the hardening declines in the recent period reveal the strength of the downward trend in technical terms. However, the structures formed on the chart may now give a possible return signal due to the approach to the lower band of the falling channel.
Critical Technical Levels For EDU/USDT
Support Levels:
- 0.1250 (Channel lower limit)
- 0.1490 – 0.1500 (Psychological threshold)
Resistance Levels:
• 0.1899 (Initial technical resistance)
• 0.2334 – 0.2495 (Channel upper band and horizontal resistance)
• 0.3008 (Wide-time target region)
• 0.3627 – 0.3876 (Key area for trend reversal)
• 0.4763 (Long-term main resistance)
According to the EDU/USDT technical analysis, the price is trying to hold on to the 0.1500 support. This region is very critical both in terms of being close to the channel subband and working as a support in the past. If this level is broken downwards, the 0.1250 region can be tested.
What Does the Channel Formation Tell?
The striking element on the chart is that the falling channel is in a very narrow structure. Such structures are usually considered as accumulation zones. In other words, investors can start to collect positions during periods when the price is suppressed but at the same time creates a bottom.
Especially when the volume indicators and momentum data such as RSI are examined, it seems that the oversold zone has been reached for EDU Coin. This indicates that short-term reaction purchases may be possible. However, in order for these reactions to be permanent, the price must first break the resistance of 0.1899 in volume.
What Should be the Investor Strategy in EDU Coin?
Trend Break Tracking: Daily closures above 0.1899 should be monitored.
Volume Confirmation: If there is no increased volume in upward movements, the rise may be short-lived.
Conclusion: Footsteps of the Rise in EDU Coin
EDU Coin may be nearing the end of a long-standing downtrend. Technical indicators and channel structure indicate a possible turn signal. The price reaching the bottom regions offers an important opportunity for investors. Especially if permanence is achieved above the 0.1500 level, the probability of a short-term recovery may strengthen.
If the first upward break is experienced at the 0.1899 level, a rapid recovery may begin in the EDU/USDT parity. This may cause the price to accelerate towards the resistances of 0.2334 and 0.3008, respectively. While the chart presents a positive picture for patient investors, it indicates that EDU Coin may become the center of attention again.
These analyses, which do not offer investment advice, focus on support and resistance levels that are thought to create trading opportunities in the short and medium term according to market conditions. However, the responsibility for making transactions and risk management belongs entirely to the user. In addition, it is strongly recommended to use stop loss in relation to shared transactions.
Author: Ilaha