APT Coin Technical Analysis
APT Coin has experienced high volatility over the past year. After peaking at $14.13 in early 2024, the price steadily declined and reached $5.63 by March 2025. However, this downward trend might present a long-term accumulation opportunity for investors who follow market cycles closely.
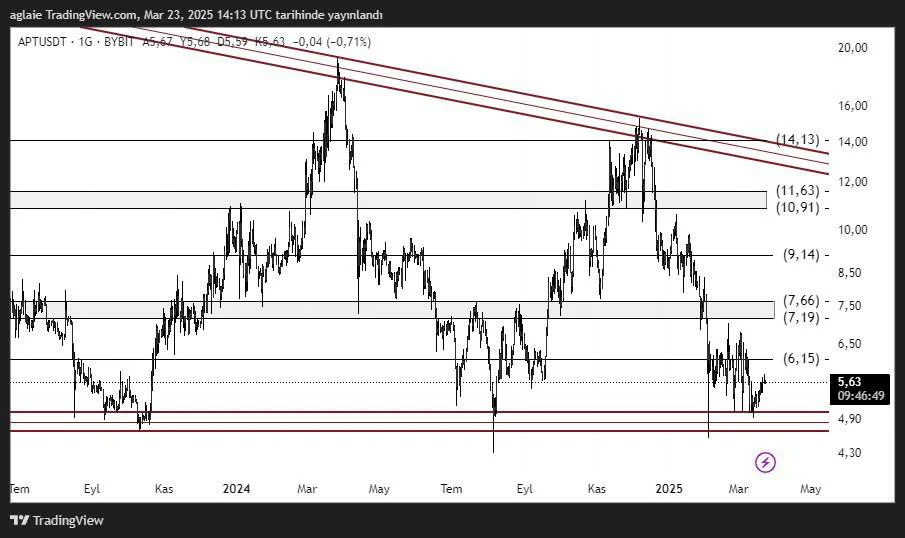
Upon analyzing the chart, $4.90 stands out as a strong support level. The price has bounced from this zone multiple times, indicating demand. On the upside, the $6.15 level serves as the immediate resistance — a zone that has previously acted as both support and resistance.
In the medium term, the $7.19 – $7.66 range is a significant resistance area. If this is broken, the next targets would be $9.14, $10.91, and $11.63. The long-term major resistance remains at $14.13.
Key price levels for APT Coin:
- Support Zone: 4.90$ - 5.37$
- First Resistance: 6.15$
- Mid-Term Resistance: 7.19$ - 7.66$
- Other Resistances: 9.14$ - 10.91$ - 11.63$ - 14.13$
The technical outlook suggests potential sideways movement in the short term. However, the broader bull market expectation across the crypto sector might uplift APT as well. Especially if Bitcoin remains strong, altcoins like APT could benefit significantly.
Disclaimer:
This analysis does not constitute investment advice. It focuses on support and resistance levels that may present potential short- to mid-term trading opportunities depending on market conditions. However, all responsibility for trading decisions and risk management lies entirely with the user. The use of stop-loss orders is strongly recommended for any trade setup shared.
Author: Ilahe