Starknet (STRK) Technical Analysis and Price Interpretation
The STRK/USDT pair is maintaining its long-standing falling channel formation. As can be clearly seen on the chart, the price entered a hard downward correction after a peak of $ 0.8205 and fell to $ 0.1349. In this process, especially the 0.3420 - 0.3836 band worked as a strong resistance zone.
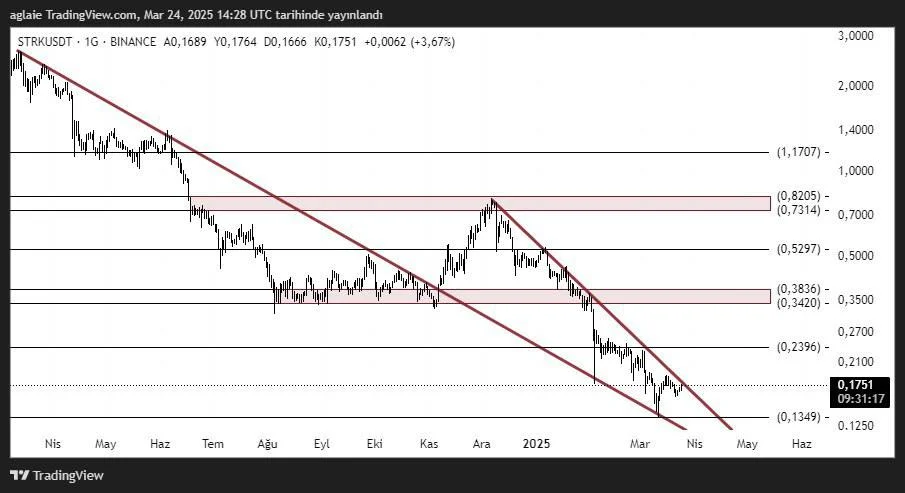
As of now, the price is at the level of 0.1751 and is quite close to the channel subband. This may also lead to a potential reaction rise to the agenda. Technically, the levels to be considered are:
Prominent Support and Resistance Levels:
- Support: 0.1349 / 0.1500
- Resistance: 0,2396 / 0,3420 / 0,3836
The first target in an upward break may be the 0.2396 level. If this level is exceeded, the 0.3420 – 0.3836 band will become important. However, since this region corresponds to both the horizontal resistance and the channel upper band, refraction can be challenging.
The RSI and volume indicators for STRK Coin are also close to the oversold zone. This supports the potential for a reaction in the short term. However, a volumetric break is necessary for a permanent rise.
For Starknet (STRK) investors, this period may be one of the low-risk areas for buying. In particular, the 0.15 – 0.17 band should be followed as support. In the event of an upward break of the channel, medium-term goals will be on the agenda again.
These analyses, which do not offer investment advice, focus on support and resistance levels that are thought to create trading opportunities in the short and medium term according to market conditions. However, the responsibility for making transactions and risk management belongs entirely to the user. In addition, it is strongly recommended to use stop loss in relation to shared transactions.
Author: Ilaha


