Altcoin
This page lists the latest Altcoin news and market analysis. Browse articles, expert insights, and updates in this category on JrKripto. Stay informed with in-depth coverage of cryptocurrency trends and developments.
News
Altcoin News
Altcoin News
Browse all Altcoin related articles and news. The latest news, analysis, and insights on Altcoin.
BNB Comment and Price Analysis - August 25, 2025
BNB Technical OutlookAnalyzing BNB on a daily time frame, we see that the ascending channel structure is still standing. The main trend is upwards and thus seems positive. What is more, the price has reached $885 — all-time high (ATH) level as of today. BNB is currently trading around this level. Rising Channel Structure The price has broken the resistance level at $861, above which we have another upper resistance range between the levels at $892 – $928, which is both the upper border of the channel and where sellers could step in. Approaching the $900 level could mean hitting trend resistance. If this level gets broken, a technical target equal to the channel width can be calculated. This target points to $1500 in the medium term.We should be monitoring the following support levels in case of a pullback:$861$830$790These analyses, not offering any kind of investment advice, focus on support and resistance levels considered to offer trading opportunities in the short and medium term according to the market conditions. However,traders are responsible for their own actions and risk management. Morover, it is highly recommended to use stop loss (SL) during trades.
Grayscale Takes Action: Avalanche on the ETF Agenda
A notable development has occurred in the cryptocurrency markets. Grayscale Investments, one of the world's largest digital asset managers, has filed an exchange-traded fund (ETF) application for Avalanche (AVAX) with the United States Securities and Exchange Commission (SEC). The S-1 form, published on the SEC's official website, is considered a significant step in Grayscale's goal of diversifying its investment products in the cryptocurrency space.Grayscale's ETF strategy expandsGrayscale has long been known for its Bitcoin and Ethereum products. The recent conversion of the Grayscale Bitcoin Trust (GBTC) to a spot Bitcoin ETF further increased the company's market influence. Now, the company aims to offer investors a new option by focusing on the Avalanche ecosystem.Avalanche stands out among smart contract platforms alternative to Ethereum with its high transaction speeds and low costs. Grayscale's initiative to include this network among its ETF offerings could facilitate access to AVAX for institutional and individual investors. This means that crypto investment products will not be limited to Bitcoin and Ethereum but will expand to a broader range.Grayscale's application for Avalanche signals the continuation of the company's ETF initiatives for crypto assets. The company has previously filed similar applications for Bitcoin (BTC), Ethereum (ETH), Solana (SOL), and Cardano (ADA), along with Polkadot (DOT), Ripple (XRP), and Dogecoin (DOGE). While these applications are under review by the SEC, Grayscale regularly submits new applications to offer investment instruments covering various crypto assets to traditional markets.Why was Avalanche selected?Avalanche has recently attracted attention with its increasing adoption in DeFi and NFT applications. Its multi-chain architecture offers fast and flexible solutions to both developers and users. These technical advantages have enabled AVAX to rank among the top 15 cryptocurrencies by market capitalization.While Grayscale's application is a significant development, the SEC's decision remains uncertain. The approval of Bitcoin and Ethereum spot ETFs in the US was a significant milestone for crypto investment funds. However, the regulatory framework for other altcoins like AVAX remains unclear.The SEC has previously classified some altcoins as securities. Therefore, the decision regarding the Avalanche ETF will be critical for the future of the altcoin ecosystem in general. If approved, similar applications for Solana and other major altcoins are likely to follow quickly. However, it's worth noting that the SEC has recently extended or postponed the decision process for many altcoin ETFs.What's the latest on the AVAX price?News of Grayscale's Avalanche ETF application has generated excitement among AVAX investors. The launch of such a product could accelerate the inflow of institutional capital into the Avalanche ecosystem. Investing in AVAX through the ETF, particularly by large US-based funds, could put upward pressure on the price.On the other hand, if the SEC issues a negative decision, expectations could be disappointed, leading to short-term volatility in the AVAX price. AVAX is currently priced at $24.18, down 6.35% over the last 24 hours. A closer look at the chart reveals that the price is fluctuating between $24 and $26, suggesting short-term selling pressure.
Galaxy Digital, Jump Crypto, and Multicoin Capital Make $1 Billion Move into Solana
A new development has drawn attention in the cryptocurrency markets. According to a Bloomberg report citing anonymous sources, leading digital asset companies Galaxy Digital, Jump Crypto, and Multicoin Capital are preparing to raise a massive $1 billion fund for Solana (SOL). This initiative could herald a new era in a market that has previously been accustomed to institutional investments focused solely on Bitcoin and Ethereum.Solana's Treasury PlanThe plan involves acquiring a publicly traded company and establishing a Solana-focused digital asset treasury. According to the report, the three companies are working with investment banking giant Cantor Fitzgerald on this massive fund. Furthermore, the Solana Foundation is reportedly supporting this initiative, creating an atmosphere of institutional approval within the ecosystem.This development demonstrates renewed confidence in Solana's growing ecosystem. Multicoin Capital co-founder Kyle Samani's statement, "Solana is a project that solves the fundamental limitations of blockchain scalability," particularly reveals why investors are considering allocating such a large fund to Solana.Potential Market ImpactsThe launch of such a large fund could significantly increase Solana's market value. Similar institutional investments have been known to cause significant price fluctuations in the short term. Investor confidence could be reflected not only in the SOL price but also in the total value locked in the ecosystem (TVL).Indeed, according to market data, Solana is trading around $200 and has gained 6.6% in the last 30 days. CoinMarketCap reports that SOL is trading at $202.03, has a market capitalization of $109.18 billion, and represents 2.81% of the total crypto market. Trading volume has increased by 75% in the last 24 hours. This data demonstrates that even rumors can cause significant market volatility. Speculation in the Crypto CommunityWhile no official announcement has yet been made from Galaxy Digital, Jump Crypto, and Multicoin Capital, the crypto community is discussing this potential major acquisition. Users on platforms like Reddit and X (Twitter) argue that this venture will strengthen Solana's long-term position, while others question the veracity of the reports. Nevertheless, it is known that previous investments from these three companies played a critical role in Solana's early development.For example, Multicoin Capital led Solana's $20 million Series A funding round in 2019. This funding was considered a milestone in the network's development. Therefore, a new multi-billion dollar venture could further highlight Solana's advantages of scalability and low transaction costs.
ENA Comment and Price Analysis - August 24, 2025
ENA/USDT Technical AnalysisAnalyzing ENA chart, we can see that the long-term downtrend has been broken above, as mentioned in the previous ENA analysis. After that, the price pulled back, completed the retest, and made a strong bounce. After the retest, the upward move gained momentum.The coin is currently trading around $0.72 and testing its first short-term resistance. If this level gets broken above, the price could swiftly move toward $0.80. Holding above $0.80 would open the way to the $0.93–$0.95 area, and later the psychological $1.00 resistance.On the downside, the first support is at $0.66, while the main defense zone is between $0.60–$0.62. This zone is strong because it is both a retest area and a horizontal support. As long as the price stays above this region, the bullish structure will remain intact.ENA has confirmed its breakout and retest, showing that the bullish potential may continue in the medium term. Dish Formation Summary:Market structure turned positive after the trend breakout.Current price: $0.72Support levels: $0.66 → $0.62 → $0.60Resistance levels: $0.72 → $0.80 → $0.93 → $1.00Retest confirmed, bullish scenario remains strong.These analyses, not offering any kind of investment advice, focus on support and resistance levels considered to offer trading opportunities in the short and medium term according to the market conditions. However,traders are responsible for their own actions and risk management. Morover, it is highly recommended to use stop loss (SL) during trades.

BIO Comment and Price Analysis - August 22, 2025
BIO/USDT Technical AnalysisThe strong rally of over 300% in August, which has raised the possibility of a cup formation, is the most notable structure on the BIO chart. With this sharp move, BIO gained strong momentum and is currently trading around $0.23. Dish Formation In the short term, the $0.26 – $0.30 range stands out as the first key resistance zone. This area could bring profit-taking and some price pressure. However, considering the current hype and strong trend, buyers may remain dominant even around this resistance.A move toward $0.45 could complete the cup formation in the medium term. If this pattern is confirmed, BIO may show even greater potential both technically and psychologically. A breakout above $0.45 could open the way toward $0.61 as the next major target.On the downside, $0.19 is the first support level, followed by $0.14 and $0.11. The overall bullish structure will remain valid as long as the price holds above these areas.These analyses, not offering any kind of investment advice, focus on support and resistance levels considered to offer trading opportunities in the short and medium term according to the market conditions. However, traders are responsible for their own actions and risk management. Moreover, it is highly recommended to use stop loss (SL) during trades.
ETHFI Comment and Price Analysis - August 22, 2025
ETHFI/USDT Technical AnalysisThere is a standing symmetrical triangle formation on the ETHFI chart, yet the price has slipped below the support level, suggesting that the bearish scenario has strengthened.The current price is hovering around $1.31. Since the mid-band of the formation at $1.12 has been broken to the downside, this level has now turned into a resistance zone. Following this breakdown, the first trend support stands at $1.09, while more critical horizontal levels are seen at $0.95 and $0.88. If these areas fail to hold, we could see a deeper move toward the $0.80 range.On the upside, a recovery would require the price to climb back above $1.12. Without sustainable consolidation above this level, upward moves will remain weak. However, in the case of a strong reversal, targets at $1.35 – $1.43, followed by $1.56 and $2.05, could come back into play. Symmetrical Triangle Formation SummaryFormation: Triangle FormationKey resistance: $1.12Support levels: $1.09 → $0.95 → $0.88 → $0.80Upper targets: $1.35 → $1.56 → $2.05
The 7-Year Bitcoin Whale Awakens: Billions Flow into ETH
One of the major Bitcoin whales, known for its silence in the crypto market, has resurfaced after seven years of inactivity. According to data from blockchain analysis firms, the owner of the giant wallet sold a significant amount of Bitcoin (BTC) and redirected these assets to Ethereum (ETH). This move sparked both surprise and curiosity in the market.A massive Bitcoin inheritance flowed into ETHAccording to analysis firm Lookonchain, the wallet in question acquired 100,784 BTC seven years ago. These funds, which remained dormant for a long time, were reactivated in a series of transactions in recent days. The whale sold some of his BTC holdings, raising 62,914 ETH (approximately $270 million) from the spot market. Not content with this, the investor opened a long position of 135,265 ETH (approximately $580 million). According to Spot On Chain's summary, in just the last two days, these whales sold a total of 4,621 BTC at an average price of $113,265. They then bought and staked approximately 82,398 ETH at $4,292. These transactions, combined with the massive long positions opened on the Hyperliquid exchange, create a strong message of confidence in Ethereum. Multiple wallets, one strategyInterestingly, the on-chain data isn't limited to a single wallet. Lookonchain has identified at least six different wallets believed to belong to the same investor or group. These wallets currently hold 83,585 BTC (approximately $9.45 billion). This means the whale's total reserves remain substantial.Arkham Intelligence data also confirms these transactions. Shared screenshots show that BTC, which has been entering exchanges like HTX since 2018, has been transferred to Hyperliquid hot wallets in recent weeks, followed by ETH purchases.The timing is strikingThe whale's shift from Bitcoin to Ethereum coincides with a critical period in the market. Bitcoin fell to $112,000 today, testing a two-week low. Meanwhile, Ethereum is gaining strength, gradually approaching its 2021 ATH of $4,878.This scenario reinforces the logic behind investors' short-term shift towards Ethereum over Bitcoin. The trend in spot crypto ETFs also supports this. According to SoSoValue data, on Thursday alone, Bitcoin ETFs saw a net outflow of $194.3 million, while Ethereum ETFs saw a net inflow of $287.6 million.In recent weeks, not only this wallet but also other "sleeping" Bitcoin whales have begun to reactivate. Billions of dollars worth of BTC are being transferred from wallets that have been dormant for years. With the market near historic highs, whales' strategies could reshape investor expectations for the future.

EIGEN Comment and Price Analysis - August 22, 2025
EIGEN Technical AnalysisWhen we analyze EIGEN, we can clearly see that there is a perfect narrowing triangle pattern. The price has maintained the contraction area through higher lows and lower highs. This triangle formation has the potential for a sharp upward move following the breakout. Symmetrical Triangle Formation The coin is trading around the level at $1.313 currently. We have the horizontal support level below between the levels at $1.20 – $1.21. Triangle formation will be valid as long as this support zone is maintained.The formation’s upper border seems to be the level at $1.45. If this level gets broken, then the levels at $1.75 and $1.87 could be the next price targets ahead. In the event of a stronger breakout, we can talk about the level $2.29 in the medium term.On the other hand, the levels at $1.12 and $0.92 should be followed as critical areas in case the price breaks below the first support level at $1.20.These analyses, not offering any kind of investment advice, focus on support and resistance levels considered to offer trading opportunities in the short and medium term according to the market conditions. However, traders are responsible for their own actions and risk management. Moreover, it is highly recommended to use stop loss (SL) during trades.
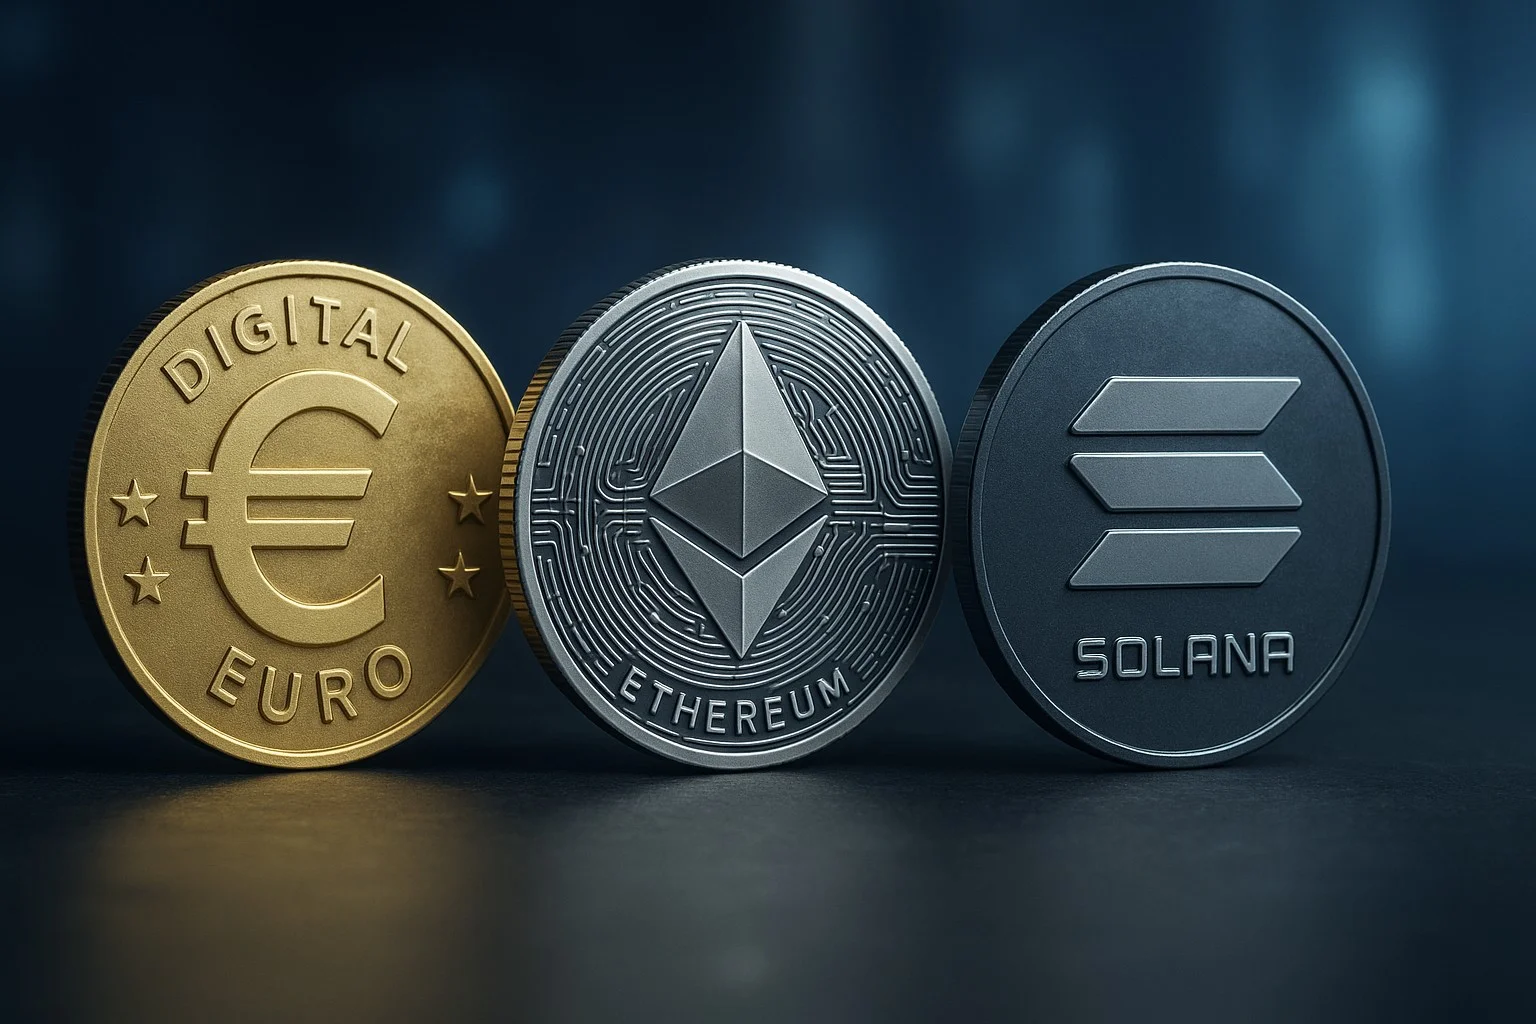
EU Considers Ethereum and Solana for Digital Euro
The European Union (EU) has decided to accelerate its digital euro project. This move is driven by the recently passed GENIUS Act in the US, which provides full legal clarity to the $288 billion stablecoin market. This development from Washington has prompted the European Central Bank (ECB) to rapidly revise its digital euro plans, which it has been developing for years.US move alarms EuropeAccording to the Financial Times, the GENIUS Act, passed by Congress, has caused significant panic in Brussels. An anonymous EU official stated that the law's approval "shocked many people," and now everyone is saying, "Let's speed up, let's push harder."The long-discussed digital euro was initially designed to operate on a private system entirely under the ECB's control. However, the US's rapid implementation of the legislation has fundamentally changed European strategy. The idea of running the digital euro on public blockchains like Ethereum or Solana is now on the table.The possibility of a public blockchain is growing stronger.The ECB has been cautious about the idea of a public blockchain until now, primarily due to privacy concerns. Every transaction and wallet activity can be transparently viewed on networks like Ethereum and Solana. However, with trillions of dollars worth of dollar-pegged tokens from US-based giants like Circle and Tether dominating the market, it's believed the EU should also look to a similar solution that can be used globally.An EU official told the FT that the public blockchain option is now being "considered much more seriously." If the ECB opts for a private system, the digital euro would be more similar to China's central bank digital currency (CBDC) model. If a public blockchain is chosen, this step would bring Europe closer to the US dollar-based stablecoin ecosystem. The Euro's Global Role at RiskECB Executive Board Member Piero Cipollone stated in April that the US's stablecoin moves threatened Europe's financial position. He warned that this could lead to a "shift of euro deposits to the US" and an increase in the use of dollars in international payments. Cipollone stated that "Europe cannot afford to be overly dependent on foreign payment solutions" and emphasized the need to accelerate efforts towards a digital euro.Currently, the largest euro-pegged stablecoin in the market is Circle's EURC token. However, its market capitalization is only around $225 million. By comparison, the total value of dollar-pegged stablecoins is in the hundreds of billions of dollars. This imbalance is seen as one of the biggest threats facing the ECB.Banks Are Also Getting InvolvedLarge banks in the US, such as JPMorgan and Citi, are also preparing their own digital token projects. This represents steps that will further increase the dollar's dominance in global markets. However, Europe is concerned that this trend will harm its own financial system. ECB officials say they are still evaluating various options for the digital euro. The institution's statement stated that "various technologies, including centralized and decentralized systems, are being examined." While a final decision has not yet been made, it is now clear that public blockchain solutions like Ethereum and Solana are serious candidates.
What is Conflux (CFX)?
The blockchain world is constantly expanding with new and exciting projects. Among these projects, one name has gained a strong foothold and attracted attention, particularly in the Asian market: Conflux (CFX). So, what is Conflux and what sets it apart? In this guide, we'll delve deeper into Conflux, exploring every aspect of this innovative blockchain network, from its technical structure and ecosystem to its history and future. If you're looking for a high-performance, regulatory-compliant platform that pushes the boundaries of blockchain technology, you're in the right place. Conflux is shaping the future of the digital world by offering groundbreaking solutions in areas like decentralized applications (dApps), DeFi, and NFTs. If you're ready, let's step into the fascinating world of Conflux together.Conflux's Definition and OriginsConflux (CFX) is a public layer-1 blockchain network distinguished by its high scalability, security, and compatibility. Conflux offers innovative solutions to the scalability challenges faced by traditional blockchains, providing an ideal infrastructure for applications requiring high transaction volumes. The network's native cryptocurrency is the CFX token, which serves various functions, including payment of transaction fees within the network, ensuring network security, and participation in governance processes.Conflux was founded in 2018 by leading scientists and technology experts in China. The project is led by researchers and academics from Tsinghua University, led by Turing Award winner Andrew Yao. This strong academic background supports the robustness of Conflux's technical infrastructure and innovative approach. If you're wondering when Conflux coin was launched, the project's mainnet, Tethys, launched in October 2020. This date is considered Conflux's official launch in the blockchain world. As of the launch date, the network's primary goal was to provide a highly efficient and regulatory-friendly blockchain solution focused on the Asian market. By complying with the regulatory environment in China, it aims to be a secure and stable platform for both local and global projects.Conflux is positioned as a key player in the Layer-1 blockchain ecosystem. Layer-1 blockchain projects are basic blockchains with their own independent networks and consensus mechanisms. Conflux falls into this category, distinguishing itself from other Layer-1 projects with its unique Tree-Graph consensus algorithm. This algorithm enables parallel processing of blocks, providing high transaction speed and efficiency. Thus, Conflux offers an alternative solution to the congestion and high transaction fees faced by popular Layer-1 networks like Ethereum. Its regulatory compliance, particularly in China, plays a key role in the adoption of blockchain technology in the Asian market.Conflux's History: Major MilestonesBehind every major project are significant milestones and turning points that have brought it to its current state. The history of Conflux coin is rich in this regard. The project's successes from its inception to the present have solidified its place in the blockchain ecosystem. Launch Date and Mainnet Launch: Following extensive research and development, Conflux officially launched its mainnet, Tethys, in October 2020. This launch was a major step toward making Conflux's vision a reality. With the launch of the mainnet, developers and users had the opportunity to experience Conflux's high-performance infrastructure. This demonstrated that the project had moved beyond theoretical work and reached the capacity to host real-world applications. The Conflux 3.0 mainnet upgrade is scheduled for August 2025, with the goal of reaching a transaction throughput of 15,000 transactions per second (TPS).Recognized as a Chinese government-compliant blockchain project: Conflux stands out as one of the few public blockchain projects to receive government support by complying with China's regulatory environment. For example, in January 2021, the Shanghai Government invested $5 million in Conflux and used the network for stablecoin testing. This marked the first major step in the project's local adoption. Then, in March–April 2024, Conflux assumed a strategic role at the national level by leading the "Ultra-Large Scale Blockchain Infrastructure Platform" project implemented as part of China's Belt and Road Initiative. These developments not only strengthened Conflux's status as "the only public blockchain network with regulatory approval in China" but also gave it a unique advantage in the Asian market.First major partnerships: Conflux has signed significant partnerships to solidify its position in the blockchain ecosystem. These partnerships have helped the project expand its use cases and reach more users. For example, Conflux Network partnered with China Telecom, one of China's largest telecommunications providers, to develop blockchain-enabled SIM cards. This partnership represents a major step forward in integrating blockchain technology into daily life by integrating Web3 identity tools into national telecom networks. Also noteworthy was Conflux's announcement of an NFT partnership with Little Red Book, considered "China's Instagram," in January.Major protocol updates and performance improvements: Conflux is constantly developing its network and implementing significant protocol updates to improve its performance. These updates aim to improve the network's security, efficiency, and developer experience. The Conflux 3.0 upgrade, in particular, is a major step forward, aiming to increase the network's throughput to 15,000 transactions per second (TPS). These performance improvements make Conflux more attractive for DeFi, NFT, and other high-throughput applications. The network's unique Tree-Graph consensus algorithm enables parallel processing of blocks and transactions, resulting in low confirmation times and high TPS.All-Time Highs: Like every cryptocurrency, the CFX token has experienced price fluctuations depending on market conditions. The CFX coin price and past performance are important indicators for investors. Conflux (CFX) reached its all-time high price (ATH) of $1.70 on March 26, 2021. This peak reflects the project's popularity and market interest at the time. However, due to the nature of the cryptocurrency market, prices are constantly fluctuating, and past performance is no guarantee of future results. An examination of Conflux's price history reveals significant price fluctuations parallel to the project's development. Why is Conflux Important?More than just another Layer-1 project in the blockchain world, Conflux stands out with its unique advantages and innovative approaches. Let's take a closer look at the key factors that make it so important…High TPS and Low Transaction FeesOne of the biggest problems with traditional blockchain networks is scalability issues that arise with increasing user numbers and transaction volume. Networks like Ethereum can experience high transaction fees (gas fees) and slow transaction confirmation times during busy periods. Conflux is a high-speed blockchain network designed to address these issues. Thanks to its unique Tree-Graph consensus algorithm, it can process blocks and transactions in parallel. This gives Conflux a high transaction throughput of up to 15,000 transactions per second (TPS). High TPS prevents network congestion, while low transaction fees provide a more economical experience for users. These features make Conflux an attractive option, especially for interactive applications like DeFi and NFTs. Regulatory Compliance (License to Operate in the Chinese Market)One of Conflux's most distinctive features is that it is the only public blockchain network with regulatory compliance in the People's Republic of China. China is known for its strict regulations regarding blockchain technologies. In this environment, Conflux's government approval demonstrates the project's reliability and long-term potential. This regulatory compliance provides Conflux with a unique opportunity for projects seeking to operate in the Asian market, particularly in China. This allows major Chinese technology companies and institutions to develop blockchain-based solutions using Conflux's infrastructure. This position positions Conflux in a strategic position within the global blockchain ecosystem.Advanced Security and Hybrid Consensus Algorithm (Tree-Graph)Conflux utilizes an innovative hybrid consensus algorithm: Tree-Graph to maintain the highest level of network security. This algorithm combines Proof-of-Work (PoW) and Proof-of-Stake (PoS) mechanisms. PoW ensures the security and decentralization of the network, while PoS increases transaction finality and efficiency. Tree-Graph allows for parallel block processing and provides enhanced protection against attacks such as double-spending. This allows Conflux to deliver high performance without compromising security. The Tree-Graph consensus mechanism is one of the key technical features that distinguishes Conflux from other Layer-1 blockchain projects. Tree-Graph A suitable infrastructure for DeFi, NFT, and enterprise solutionsConflux's high scalability, low transaction fees, and advanced security features make it an ideal platform for a wide range of use cases. Decentralized finance (DeFi) applications, NFT marketplaces, and enterprise blockchain solutions can all benefit from the advantages offered by the Conflux network. Conflux offers a fast and low-cost transaction environment for DeFi projects and an efficient infrastructure for NFT creators and collectors. Furthermore, thanks to its compliance with the Chinese government, it offers a reliable option for companies seeking to develop enterprise-level blockchain solutions. This makes the question of what Conflux coin is useful for a multifaceted approach. The Conflux ecosystem is constantly expanding in the Web3 and DeFi spaces, making it a strong foundation for future innovations.EVM Compatibility: eSpaceAnother notable feature of Conflux is its EVM-compatible domain, called eSpace. Running on the same network as Core Space, eSpace is fully compatible with the Ethereum Virtual Machine, allowing developers to develop applications directly using Ethereum tools like MetaMask, Hardhat, or Remix. This allows dApps on Ethereum to be ported to Conflux with virtually no modifications. This architecture maintains the scalability and low cost advantages of Conflux while providing a compatible bridge to the Ethereum ecosystem. Secure asset transfers between Core Space and eSpace are also possible through a mechanism called CrossSpaceCall. The Conflux Ecosystem and Future PotentialConflux is more than just a blockchain network; it boasts a vibrant and growing ecosystem. This ecosystem includes decentralized applications (dApps), DeFi protocols, NFT marketplaces, and various Web3 projects. Conflux's high performance and regulatory compliance provide a suitable environment for these projects to thrive.Many innovative dApps and projects are being developed on the Conflux network, including DeFi platforms, games, social media applications, and enterprise solutions. For example, Moonswap, Conflux's native DEX (decentralized exchange), offers users fast trading with low fees. Furthermore, Conflux-based NFT marketplaces provide artists and collectors with the opportunity to securely buy and sell their digital assets. These projects demonstrate the diversity and potential of the Conflux ecosystem. Conflux ecosystem. Source: Conflux/Medium Conflux is taking significant steps to ensure interoperability between different blockchain networks. Cross-chain bridges like Conflux ShuttleFlow allow users to easily transfer their assets between Ethereum, Binance Smart Chain, and other popular networks. This compatibility allows Conflux to integrate with the broader blockchain ecosystem and offers greater flexibility for users. Cross-chain compatibility plays a critical role in Conflux's future growth and adoption.Conflux has a continuously evolving roadmap. The project focuses on improving network performance, expanding the ecosystem, and exploring new use cases. Major updates, particularly the Conflux 3.0 upgrade, will further enhance the network's capacity and capabilities. Conflux's vision is to drive global adoption of Web3 and make blockchain technology accessible to everyone. With its strategic position in the Chinese market and strong academic support, Conflux appears poised to remain a major player in the blockchain world. Conflux's Developers and CommunityThe success of a blockchain project is directly linked not only to its technical infrastructure but also to its development team and supporting community. Conflux has a strong foundation in this regard.Conflux Network boasts an experienced core team of scientists, researchers, and business leaders who are experts in their fields. Among the project's founders are world-renowned and Turing Award-winning Professor Andrew Yao. Yao is known for his groundbreaking work in computer science and brings academic depth to the Conflux project. The team also includes experienced individuals such as CTO Ming Wu and research director Guang Yang. This strong leadership team shapes Conflux's technical vision and roadmap. As the founder of Conflux coin, Andrew Yao and his team embody the project's academic roots and innovative approach.University-backed research roots (Tsinghua University): One of Conflux's most notable features is the strong research support it receives from a prestigious academic institution like Tsinghua University. The project was developed by researchers from Tsinghua University's Yao Class, led by Andrew Yao. This academic background has enabled Conflux to develop robust and innovative technology based on scientific foundations. This university collaboration allows the project to continuously incorporate the latest research findings and technical advancements. This makes Conflux a project driven not only by commercial considerations but also by the pursuit of scientific excellence.In addition to a strong team of developers, Conflux also boasts a growing, active community worldwide. This community contributes to the project's development, developing new applications and supporting network adoption. Conflux Network also offers various ecosystem funds and grant programs to grow its ecosystem and encourage new projects. These funds encourage developers to build innovative dApps, DeFi protocols, and NFT projects on the Conflux network. Global community governance and transparent communication strengthen Conflux's decentralized structure and contribute to the project's long-term sustainability. Conflux aims to build an ecosystem that enables creators, communities, and markets to connect globally by encouraging cross-border and multi-chain collaboration.Frequently Asked Questions (FAQ)Below are some frequently asked questions and answers about Conflux:What is Conflux, and when was it released? Conflux is a highly scalable, secure, and compliant layer-1 blockchain network. Its mainnet, Tethys, launched in October 2020. It aims to provide high-throughput and regulation-friendly solutions, focusing primarily on the Asian market.Who developed Conflux? Conflux was developed by researchers and academics at Tsinghua University, led by Turing Award-winning Professor Andrew Yao. The project is backed by a strong academic and technical team.What consensus algorithm does Conflux use? Conflux uses the unique Tree-Graph consensus algorithm. This hybrid algorithm combines Proof-of-Work (PoW) and Proof-of-Stake (PoS) mechanisms, providing high security, scalability, and efficiency.What does the CFX token do? The CFX token is the native cryptocurrency of the Conflux network. It offers various functions, including payment of transaction fees within the network, ensuring network security (staking), participation in governance processes, and use in dApps.Is Conflux suitable for investment? Conflux offers potential advantages such as high scalability, compliance with the Chinese government, and a robust ecosystem. However, like any cryptocurrency, investing in the CFX token carries market risks. It is important to conduct thorough research and seek financial advice before making an investment decision.What are the application areas for Conflux? Thanks to its high-performance infrastructure, Conflux has a wide range of application areas, including DeFi (decentralized finance), NFT (non-fungible tokens), Web3 applications, and enterprise blockchain solutions. It stands out particularly in the Asian market for its regulatory compliance.

Ripple Prepares to Enter Japan's Stablecoin Market with RLUSD
Blockchain company Ripple is preparing to take a new step with Japanese financial giant SBI Holdings, with whom it has had a long-standing strategic partnership. The company plans to launch its Ripple USD (RLUSD) stablecoin in the Japanese market in the first quarter of 2026. According to the statement, distribution will be carried out through SBI VC Trade, SBI's cryptocurrency arm.RLUSD, which Ripple launched at the end of 2024, is backed 1:1 by US dollar reserves, short-term US Treasury bonds, and cash equivalents. With a market capitalization of $666 million, the stablecoin boasts a daily trading volume of approximately $70 million.A new era in JapanSBI VC Trade CEO Tomohiko Kondo described the launch of RLUSD in Japan as "a major step forward in the reliability and ease of use of stablecoins." According to Kondo, this move will not only increase investor options but also accelerate the convergence of financial and digital technologies. Ripple Vice President Jack McDonald also emphasized that the partnership is based on harmony and trust. McDonald stated that RLUSD aims to be "a reliable and efficient bridge between traditional finance and decentralized finance." He also stated that they believe this partnership will set a new standard not only in Japan but also in the global stablecoin market.Growth in the Stablecoin MarketRLUSD's move into Japan coincides with significant global momentum in the stablecoin market. According to market data, the supply of USD-pegged stablecoins rose from $256 billion at the beginning of August to $266 billion by the end of the month. Experts expect the market to reach trillions of dollars in size in the coming years. Total stablecoin supply. Source: The Block The GENIUS Act, passed in the US in 2025, established a new foundation of trust in the stablecoin ecosystem. Following this regulation, new projects, such as World Liberty Financial's USD1 token, listed on Coinbase, have seen rapid growth. Ripple's RLUSD stands out in this second wave of growth, particularly with its focus on institutional transactions and regulation.Ripple transparently discloses its data by publishing monthly reports from independent auditors for RLUSD.A Trust Test in AsiaRLUSD recently received approval from the Dubai Financial Services Authority and began its use as a payment instrument in the Dubai International Financial Centre. It also served as a significant boost to confidence by being selected for the Bullish Exchange's $1.15 billion IPO in the US.RLUSD was first launched in December 2024. Backed 1:1 by the US dollar and short-term government bonds, the stablecoin is primarily used in corporate payments, international money transfers, and decentralized finance (DeFi) applications. Stablecoins are generally preferred in the crypto market to provide price stability, offer safe havens in trading pairs, and expedite cross-border transactions. Ripple's RLUSD aims to be a reliable alternative for both individual users and institutional investors in this area.
TIA Comment and Price Analysis - August 22, 2025
TIA/USDT Technical AnalysisAnalyzing TIA chart, we see that downtrend is still dominant. The price of the coin tested $2.11 and then got rejected from that level. It is currently trading around the level at $1.69. This general outlook indicates that buyers are not strong enough in the short term.It is clear that the range between the levels $1.81 – $1.88 has turned into a resistance. If this resistance gets broken, the next key level will be $2.11. If TIA can hold above this key level, it is possible that the levels at $2.36 → $2.45 and $2.78 will be the next upper targets ahead.We have the first support level at $1.60 in case of a pullback. Below this level, we should be following the critical levels at $1.43 and $1.31. Falling Trend Structure Summary:Resistance zones: $1.81 – $1.88 → $2.11 → $2.36 → $2.45 → $2.78Support zones: $1.60 → $1.43 → $1.31These analyses, not offering any kind of investment advice, focus on support and resistance levels considered to offer trading opportunities in the short and medium term according to the market conditions. However, traders are responsible for their own actions and risk management. Moreover, it is highly recommended to use stop loss (SL) during trades.
AAVE Comment and Price Analysis - August 21, 2025
AAVE/USDT Technical AnalysisAnalyzing AAVE chart, we see that the long-standing downtrend since 2024 has seen another test, but no breakout to the upside has occurred yet. This trendline continues to act as a strong resistance, and the price has been rejected from that level. If a breakout above this trend occurs, a potential rise towards the $400 level could come into play from a technical perspective. However, until such a breakout happens, the medium- to long-term downward pressure should still be considered.In the shorter-term outlook, a rising wedge pattern is drawing attention. Rising wedges typically have a higher probability of breaking to the downside. If the lower boundary of this formation is broken, $268 and $254 would be the initial support levels. A stronger support area lies around $234.Daily closes above $306 are needed for the upside momentum to strengthen. In that case, $340 and $400 would become the next targets. Current AAVE View Summary:The 2024 downtrend is still acting as resistance.A rising wedge is in play, with a high risk of downside breakout.Upside breakout: Daily closes above $306 could target $340 – $400.Downside breakout: $268 – $254 – $234 support zones come into focus.These analyses, not offering any kind of investment advice, focus on support and resistance levels considered to offer trading opportunities in the short and medium term according to the market conditions. However, traders are responsible for their own actions and risk management. Moreover, it is highly recommended to use stop loss (SL) during trades.
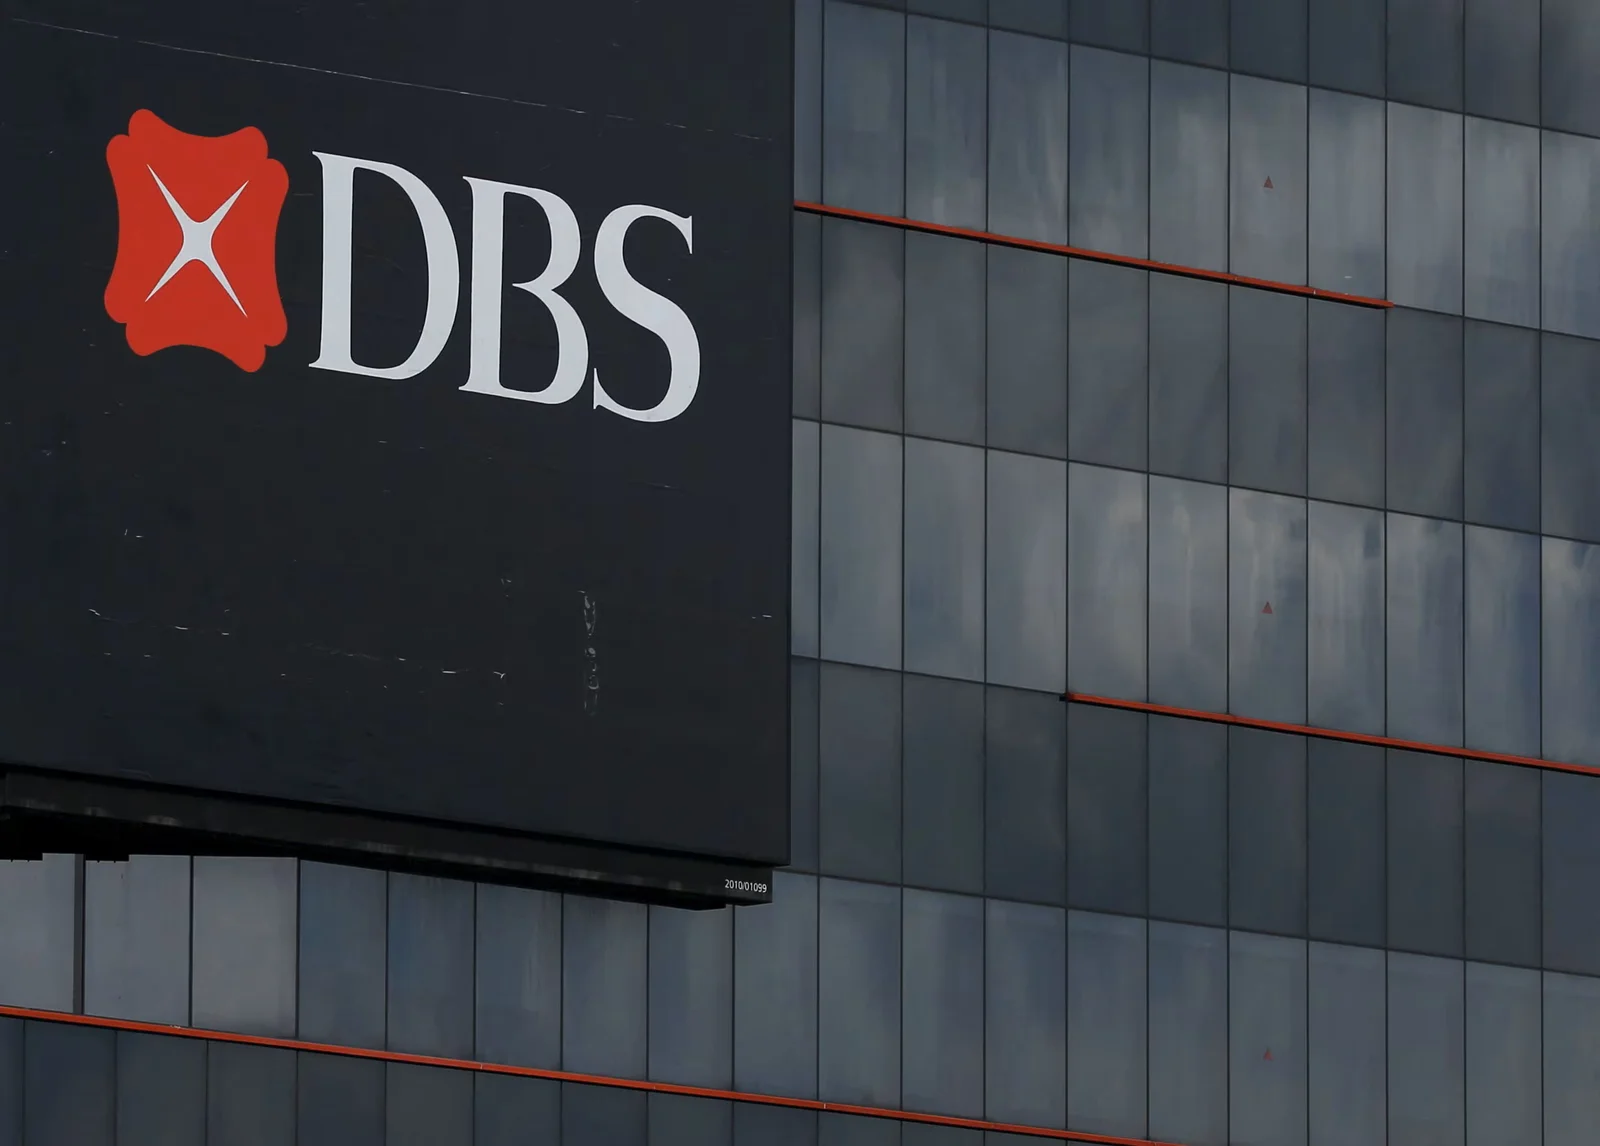
Singapore's Largest Bank DBS Launches Tokenized Investment Products on Ethereum
Singapore's largest bank, DBS, has taken a significant step to further strengthen its presence in the digital asset ecosystem. The bank announced the launch of tokenized structured notes on Ethereum, a public blockchain, for the first time. This move aims to open complex financial products, traditionally accessible only to high-net-worth investors, to a wider investor base.DBS's structured notes typically require a minimum investment of $100,000 and are often considered illiquid, tailored to private clients. However, with the bank's new tokenization model, these products will now be offered in $1,000 increments. This allows investors to trade more flexibly, manage their portfolios more easily, and react quickly to market fluctuations.Tokenization not only lowers the investment threshold but also makes products more liquid and transparent. This attracts the interest of both professional and institutional investors and reinforces Singapore's growing role as a tokenization hub. Not limited to DBS clientsThe bank's first tokenized products announced will be structured notes indexed to crypto assets. These products are designed to provide cash returns when cryptocurrency prices rise while limiting potential losses when they decline.Crucially, these products will be accessible not only to DBS's own clients but also to a broader investor base through third-party platforms. Singapore-based digital investment platforms ADDX, DigiFT, and HydraX are among the prominent partners in this distribution process.Demand is growing rapidlyDBS highlights the significant increase in institutional demand for digital assets recently. According to bank data, DBS clients alone executed over $1 billion in crypto-related options and structured notes in the first half of 2025. Trading volume increased by approximately 60% from the first quarter to the second quarter of the year.This growth is particularly linked to the proliferation of family offices and professional investors in Singapore. By 2024, the number of single-family offices in the country is expected to exceed 2,000, a 43% increase. This serves as a significant catalyst for wealthy investors to turn to digital assets.Why Ethereum?DBS has decided to launch its tokenized products on Ethereum, a public network. The bank states that Ethereum is preferred due to its global reach, mature ecosystem, and security. While many financial institutions have previously opted for more closed and private blockchains, DBS's move into Ethereum is considered a strategic step in its goal of opening up to international investors.DBS launched crypto-linked structured notes along with crypto options in 2024 and subsequently attracted attention with its stablecoin initiatives. Now, it plans to expand its range of tokenized products. The bank aims to tokenize not only crypto-based products but also equity-linked and credit-linked structured notes in the future.Li Zhen, Head of Digital Assets at DBS, stated, “Asset tokenization is the next frontier in financial market infrastructure. This step aims to meet the institutional appetite for digital assets.”
ONDO Comment and Price Analysis - August 21, 2025 | JrKripto
ONDO Technical AnalysisOndo has been drawing attention recently by maintaining its upward trend structure. As seen on the chart, the price is still moving above the trendline, and this structure remains strong. Sustained movement above $0.90 indicates that the trend is intact and the upward movement could continue. In this scenario, the following levels can be targeted respectively: $0.95 → $0.9960 → $1.0137.If the price dips below $0.90 and holds there, the upward trend will weaken, and pullbacks towards the $0.8861 – $0.8390 support zones may come into play. Rising Trend Support and Resistance ZonesSupports:First support: $0.9019 (intersection with the trendline)Lower support: $0.8861Stronger support: $0.8390Resistances:Initial resistance: $0.9478Higher resistances: $0.9960 and $1.0137Main targets: $1.0707 and $1.1214These analyses, not offering any kind of investment advice, focus on support and resistance levels considered to offer trading opportunities in the short and medium term according to the market conditions. However, traders are responsible for their own actions and risk management. Moreover, it is highly recommended to use stop loss (SL) during trades.