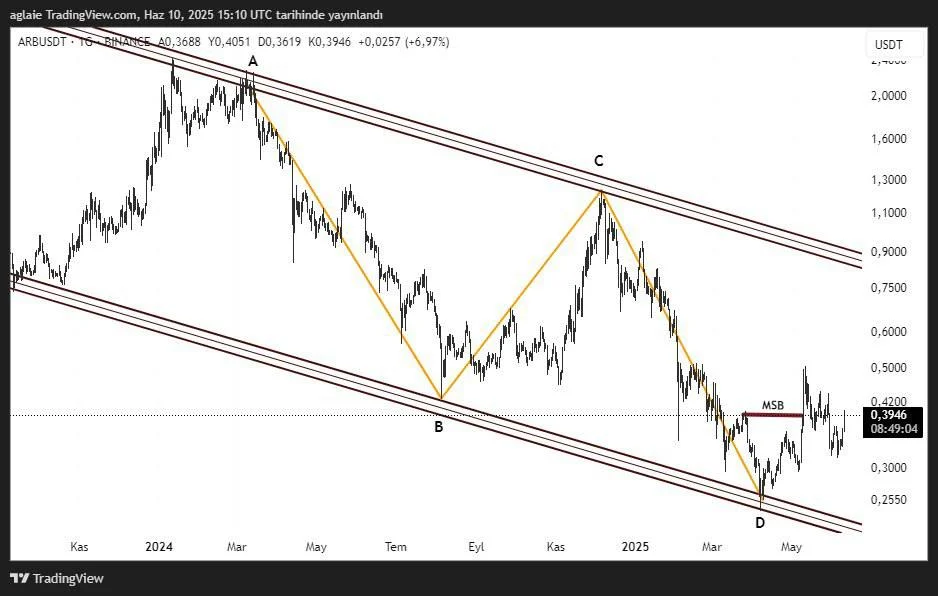
ARB Technical Analysis – ABCD Pattern Signals a Reversal in the Falling Channel
ARB has been trading within a long-standing falling channel structure, which still remains valid. However, the clearly visible ABCD pattern on the chart could be signaling a potential trend reversal. In particular, the reaction at point D and the subsequent Market Structure Break (MSB) level indicate that an upward break in the market structure may have occurred.
After bottoming around $0.255, the price quickly rallied to test the MSB level at $0.42. This area is also being followed as a short-term resistance zone. Currently, the price is moving close to this resistance at $0.3946.

For the uptrend to continue, the price must first break above $0.42. If this level is surpassed, a move toward the upper band of the falling channel may occur, potentially targeting the $0.60 – $0.75 range. Further above, the $1.10 – $1.30 zone, which overlaps with point C, stands out as a critical resistance region.
In the bearish scenario, if the price falls below $0.32, the lower band of the falling channel may become the next target, which could lead to a retest of the dip levels at point D.
In conclusion, ARB is showing a potential reversal signal within the falling channel through the ABCD pattern. If the MSB zone is broken, the uptrend could continue. However, unless this level is breached, the possibility of consolidation within the channel and renewed downward pressure remains. The $0.42 level is a critical threshold for short-term direction.
Disclaimer: This analysis does not constitute investment advice. It focuses on support and resistance levels that may present potential short- to mid-term trading opportunities depending on market conditions. However, all responsibility for trading decisions and risk management lies entirely with the user. The use of stop-loss orders is strongly recommended for any trade setup shared.


