Altcoin
This page lists the latest Altcoin news and market analysis. Browse articles, expert insights, and updates in this category on JrKripto. Stay informed with in-depth coverage of cryptocurrency trends and developments.
News
Altcoin News
Altcoin News
Browse all Altcoin related articles and news. The latest news, analysis, and insights on Altcoin.
LDO Comment and Price Analysis - August 8, 2025 | JrKripto
LDO/USDT Technical AnalysisThe downtrend structure on the LDO chart remains intact. The price has rebounded to the upper boundary of the trend, touching $1.094. This zone, serving as both channel and horizontal resistance, continues to exert selling pressure. The price is currently around $1,099. Current Trends If this area breaks above, the first target range could be the $1,255-$1,318 range. This area has served as strong resistance in the past and will be the next price action area if volume breaks out. Following this zone, the $1,464 and $1,959 levels will be on the agenda.In a potential pullback scenario, the first support range lies between $0.954 and $0.908, a zone where buying interest has emerged in the past. A breakdown below this level could bring the next support areas into focus at $0.780, $0.700, and $0.611, respectively.This analysis does not constitute investment advice. It focuses on support and resistance levels that may present trading opportunities in the short to medium term, depending on market conditions. All trading decisions and risk management remain the sole responsibility of the user. The use of a stop-loss is strongly recommended for all trades mentioned.

TIA Comment and Price Analysis - August 8, 2025 | JrKripto
TIA/USDT Technical AnalysisThe downtrend structure remains dominant on the TIA chart. The price was once again rejected at $2.11, leading to a retreat, and is currently trading around $1.743. This pullback indicates that the recent short-term upward attempt lacked strength.The $1.81–$1.88 range is now serving as resistance. As long as this zone remains unbroken, upward momentum may stay limited. A retest and breakout above this range would bring the $2.11 level back into focus as a critical threshold. A confirmed move above $2.11 could open the way for targets at $2.36–$2.45, followed by $2.78.On the downside, the first support stands at $1.60. A break below this level would make $1.43 and $1.31 the next technically significant areas to watch. Falling Trend Structure Summary:Current price: $1.743Resistance zones:→ $1.81 – $1.88→ $2.11→ $2.36 → $2.45 → $2.78Support zones:→ $1.60→ $1.43→ $1.31This analysis does not constitute investment advice. It focuses on support and resistance levels that may present trading opportunities in the short to medium term, depending on market conditions. All trading decisions and risk management remain the sole responsibility of the user. The use of a stop-loss is strongly recommended for all trades mentioned.

Stablecoin Partnership from Animoca and Standard Chartered
Animoca Brands, Standard Chartered, and HKT Launch Hong Kong's First Licensed StablecoinWeb3 investment giant Animoca Brands has formed a new joint venture called Anchorpoint Financial Limited, along with Standard Chartered Bank (Hong Kong) Limited and Hong Kong Telecom (HKT). The company aims to become one of the first licensed stablecoin companies in Hong Kong under the Stablecoin Regulation, which came into effect on August 1.The joint venture submitted its formal application to the Hong Kong Monetary Authority (HKMA) on August 1, the same day the Stablecoin Regulation came into effect. This move establishes them as the "first movers" among stablecoin companies operating under Hong Kong's new regulatory framework.Pre-regulation Preparation ProcessAnchorpoint has been shaped by the participation of all three companies in the HKMA's stablecoin sandbox program for over a year. During this period, the parties tested how stablecoins could connect traditional finance and the Web3 ecosystem. According to HKMA CEO Eddie Yue, approximately 40 companies could apply for licenses, but fewer than 10 are expected to receive approval.Stablecoins are generally known as crypto assets pegged to fiat currencies like the US dollar. Both regulators and financial institutions worldwide view stablecoins as one of the most critical components of the digital asset ecosystem. Regulation of stablecoins has also accelerated in the US under the GENIUS Act.The Strategic Importance of the Partnership“Stablecoins are one of the strongest use cases in the Web3 space, and we are just at the beginning of widespread adoption on both institutional and retail levels,” said Evan Auyang, Group Chairman of Animoca Brands. Hong Kong’s new regulations pave the way for stablecoin alternatives other than USD to enter the market in the city. This creates new opportunities that could challenge the dollar’s dominance in regional payment and clearing systems.Hong Kong’s Stablecoin Regulation introduces a comprehensive licensing system for the issuance of stablecoins pegged to fiat assets. Under this system, companies are required to:Conduct transparent reserve asset management,Keep client assets segregated,Operate stability mechanisms,Meet redemption requests at par value,Comply with AML (anti-money laundering) standards.The HKMA published its oversight guidelines and AML procedures on July 29. The application deadline for early-stage feedback is August 31, and the deadline for full applications is September 30. It was announced that misleading license statements will be subject to criminal penalties.Hong Kong experienced a notable increase in capital inflows into the digital asset market following the new regulations. In July, at least 10 publicly listed companies raised over US$1.5 billion for blockchain and digital currency projects. During this period, stablecoin-related stocks have gained 65% since the beginning of the year.Tether maintains its leadership with a market capitalization of $164 billion, while USD Coin grew 3.78% to $63.6 billion. Ethena USD saw a record 43.5% increase to $7.6 billion.If Anchorpoint successfully completes the licensing process, it is expected to become one of the first major players in Hong Kong's stablecoin market to be licensed and regulated.

Binance Agrees with BBVA: Customer Assets Can Be Held in Bank
Binance has signed a custody agreement with BBVA, Spain's third-largest bank, to enhance the security of its customers' assets. According to the Financial Times, this partnership allows the crypto exchange to hold its customers' assets in BBVA's custody infrastructure rather than directly on the exchange.Under the agreement, customer funds will remain in U.S. Treasuries held by BBVA. Binance will accept these bonds as margin for users' trades. This ensures that even in the event of a potential exchange-wide crash, the funds will remain securely under BBVA's control. This practice, known as "separation of custody and trading," is widely used in traditional finance but has not yet become standard in the crypto industry.Increased security measures after the FTX collapseThe collapse of the FTX exchange in 2022 caused a significant loss of confidence in the crypto industry, leaving billions of dollars stranded in legal proceedings. Following this incident, regulators and investors became more cautious about the storage of assets on exchanges. Following these pressures, Binance has also taken steps to move its custody services off-exchange. Having added independent custodians such as Sygnum and FlowBank to its system at the beginning of 2024, Binance has now added BBVA to this list.This development demonstrates that Binance is moving away from its previous model of holding user assets in-house and is adopting a strategic shift to mitigate risks. Furthermore, following a record $4.3 billion fine paid in the US last year for anti-money laundering violations, the exchange has accelerated its compliance and transparency efforts.BBVA's crypto attackBBVA has recently been making significant strides in the crypto space. The bank began offering Bitcoin (BTC) and Ethereum (ETH) trading and custody services through its mobile app. It also advised private banking clients to allocate 3% to 7% of their portfolios to cryptocurrencies. BBVA's strong brand recognition could provide additional confidence in Binance, particularly for institutional investors in due diligence processes. This collaboration also demonstrates the growing interest of traditional banking institutions in the crypto sector. The Trump administration's strong support for the sector in the US and the MiCA regulations enacted in the European Union are strengthening the bridges between banks and crypto platforms.Binance's move is part of the increasingly widespread "off-exchange custody" trend in the sector. In recent years, major exchanges such as Deribit, OKX, and Bitget have also developed solutions that offer automated clearing and secure transactions, where assets are held by qualified custodians.The agreement with BBVA is considered a significant step that supports both investor security and the sector's maturation. Minimizing exchange risk, particularly for institutional investors, could pave the way for a broader investor base to adopt crypto assets.Following these developments, the price of Binance's BNB increased by 2 percent.
SEC and Ripple Case Over: XRP Price Rises
The long-running legal battle between the U.S. Securities and Exchange Commission (SEC) and Ripple Labs has officially concluded. The parties have mutually agreed to withdraw their appeals, closing one of the crypto world's most controversial cases. According to a joint waiver filed with the U.S. Court of Appeals for the Second Circuit, each side will bear its own litigation costs and attorney fees.With this development, the July 2023 decision by Judge Analisa Torres in New York federal court will become final. According to the ruling, Ripple's sale of hundreds of millions of dollars in XRP to institutional investors was considered an "unregistered security sale," while retail transactions conducted through exchanges where the investor's identity is unknown were not considered securities.It's time for Ripple to "get back to work"Ripple CEO Brad Garlinghouse announced in June that they would drop the appeal, saying, "We are closing this chapter completely; we are now focusing on what matters most: building the Internet of Value." Ripple's Chief Legal Officer, Stuart Alderoty, posted on social media on August 7th, saying, "Following the Commission's vote today, the SEC and Ripple have officially withdrawn their appeals. The end... and it's time to get back to work." In December 2020, the SEC filed a lawsuit against Ripple Labs and its senior executives, Brad Garlinghouse and Chris Larsen, characterizing the company's XRP sales as an "unregistered securities offering." The litigation centered on cross-appeals, millions of dollars in legal fees, and the debate over whether crypto assets are securities or commodities.Much of the case unfolded under the shadow of the Biden administration's harsh regulatory measures against crypto and then-SEC Chairman Gary Gensler's policy of "regulation by enforcement." A partial ruling in 2023 proved a turning point. The court ruled that the version of XRP sold on exchanges was not a security, while the institutional sales were unregistered. Accordingly, Ripple was ordered to pay a $125 million fine to the SEC. This figure fell well short of the $2 billion requested by the regulator.Following the ruling, the price of XRP surged. Trading at around $3.04 before the news, it quickly gained more than 7 percent to $3.27. The price climbed by 13 percent during the day, reaching $3.37. This put the token at its highest level since July 23rd and 8 percent shy of its all-time high of $3.65, broken on July 18th. This development officially closed the case, which had lasted nearly five years and was symbolic for the future of the crypto industry. Market participants believe the Ripple decision could set a precedent for the legal status of crypto assets in the future.
EDU Comment and Price Analysis August 7, 2025
EDU Technical OutlookAnalyzing the EDU chart on a daily time frame, we see that there is a symmetrical triangle formation. As seen on the chart, price action is stuck between the downtrend line from above and the support line below. We know that such patterns usually end up with strong price movements depending on the direction of the breakout.EDU is currently trading at around $0.1251, but it rebounded from the lower border of the triangle formation at the level $0.1200 just a while ago. The level $0.1286 stands as the first resistance level. In the event of an upward breakout, the level at $0.1338 stands out as the formation's upper border.We should be following the levels at $0.1900 and then $0.2400 if this triangle pattern breaks upward, as these areas overlap with both the areas that have seen sharp reactions in past pricing and the formation's projection targets.We have the support levels at $0.1200 and $0.1136 in case the price breaks downward. Below these levels, it is possible to see a deeper correction. Narrowing Triangle Formation Summary:• Formation: symmetrical triangle on daily time frame• First resistance levels: $0.1286 → $0.1338• Triangle breakout targets: $0.1900 → $0.2400• Support levels: $0.1200 → $0.1136• The direction of the breakout will be decisive for medium-term direction.These analyses, not offering any kind of investment advice, focus on support and resistance levels considered to offer trading opportunities in the short and medium term according to the market conditions. However, traders are responsible for their own actions and risk management. Moreover, it is highly recommended to use stop loss (SL) during trades.
ID Comment and Price Analysis August 7, 2025
ID Technical OutlookWhen we analyze the ID chart, we can clearly see that the long-standing descending channel pattern is still active. The price of the coin has tested the upper border of this channel for the fourth time, and again it was rejected from there. ID is currently trading at around $0.1564 in a downtrend.The price could not break the range between the levels at $0.1900 - $0.1984, as this range has served as a very strong resistance previously. Later, the price pulled back to the support level at $0.1664 and then to $0.1487 following the price rejection at the resistance. ID is testing the support currently.We could be talking about the lower border of the descending channel around the level at $0.1343 if ID loses the support level at $0.1487.ID needs to break above the level at $0.1664 and hold above it for an upward recovery. Still, the coin will be trading within the downtrend and there will be sell pressure there. The target of the formation could technically move to the range between the levels at $0.30 - $0.33 if the channel pattern breaks upward. Still, we need to see the price close above the level $0.1984 for this scenario to realize. Falling Channel Structure Summary:• Price: $0.1564, downtrend continues within the channel• Last rejection: $0.1900 - $0.1984• Current support: $0.1487• If this level is broken, next support: $0.1343• Persistence above $0.1664 is needed for an upward recovery• If the channel breaks, target: $0.30 - $0.33These analyses, not offering any kind of investment advice, focus on support and resistance levels considered to offer trading opportunities in the short and medium term according to the market conditions. However, traders are responsible for their own actions and risk management. Moreover, it is highly recommended to use stop loss (SL) during trades.
What is Hyperliquid (HYPE)?
We've been hearing a lot about "a fully on-chain perpetual DEX" in the crypto world for a while now. Hyperliquid is one of the projects that truly embodies this definition. Launched in 2023, Hyperliquid aims to offer futures (more commonly, perpetual trading) with the speed and practicality we're accustomed to from centralized exchanges (CEX), but this time entirely on-chain. This means transactions are transparent and traceable, and your funds remain in your wallet. You don't have to entrust your assets to an exchange, nor do you have to worry about "do I need to reconfirm the gas fee before canceling this order?"The team behind the project is quite competent. Jeff Yan is the CEO and co-founder of Hyperliquid, a decentralized exchange.One of the key things that distinguishes Hyperliquid from its peers is that it has developed its own layer-1 blockchain. In other words, they built their own infrastructure from scratch, unencumbered by the constraints of Ethereum or any other chain. This allows both the order book and the matching engine to run entirely on-chain. This makes Hyperliquid one of the most up-to-date and clear examples of what a truly on-chain perpetual DEX is.Of course, this introduction is just the beginning. In the rest of this guide, we'll answer all your questions, such as "How does Hyperliquid work?", "What does the HYPE token do?", and "What is the Hyperliquid hype?" step-by-step. We'll also delve into details like what the Hyperliquid coin does, when the HYPE token was released, and the Hyperliquid governance structure. This means we'll both satisfy your technical curiosity and gain a deeper understanding of how the platform became so popular.Hyperliquid's Definition and OriginsHyperliquid is an example of an on-chain derivatives exchange running on its own dedicated layer-1 blockchain infrastructure. The core of the platform is an on-chain order book and matching engine. This way, all buy and sell orders, matching transactions, and liquidations are recorded on the blockchain. What is an on-chain perpetual DEX? To briefly explain, an on-chain perpetual DEX is a decentralized exchange offering perpetual futures services, where all orders and transactions occur on the blockchain. This model ensures transparency and traceability of transactions while offering full control over user funds.The Hyperliquid platform first appeared in 2023. At its launch, many in the industry were surprised by Hyperliquid's speed. It turns out that the Hyperliquid team built the product on a custom Layer-1 blockchain they developed from the very beginning. In other words, instead of relying on an existing blockchain like Ethereum or Solana, they directly created an independent blockchain focused on performance. They used a specialized consensus algorithm called HyperBFT to achieve this. Thanks to this algorithm, block confirmation times are reduced to sub-seconds, and tens of thousands of transactions can be processed per second. In short, Hyperliquid operates on an infrastructure designed from the ground up for high-speed transactions and low latency.Since 2020, the team, which has been running its own market-making strategies in the crypto markets, turned to the DeFi space in the summer of 2022, observing the shortcomings of decentralized exchanges. The technical issues, inefficient designs, and poor user experience they encountered led them to develop Hyperliquid. Ultimately, the idea of a fully on-chain orderbook DEX on a high-performance decentralized L1 platform was realized.This approach provided Hyperliquid with a significant advantage: offering CEX-like speed and ease of use in a decentralized environment. Users can execute their transactions with a single click, as if they were in the Binance interface, without having to confirm them with a wallet like MetaMask. Transparency is ensured as transactions are recorded on the blockchain, while orders are instantly matched thanks to Hyperliquid’s private chain in the background, turning perpetual trading into a seamless experience. Hyperliquid interface and its own "order book" Hyperliquid's History: Key MilestonesDespite its relatively short existence in the crypto world, Hyperliquid has made significant strides and gained significant momentum. Emerging at a time when decentralized derivatives markets were being reshaped, the project surpassed many of its competitors with its technical infrastructure and visionary approach. Several defining events and strategic moves stand out throughout the platform's development that brought it to its current position. These milestones are crucial for understanding both why Hyperliquid has grown so rapidly and for better understanding the vision of the team behind it. Let's examine these developments chronologically:2023: The Hyperliquid platform's mainnet launch took place. The first on-chain perpetual transactions were launched on its own proprietary blockchain.Late 2023: The total asset value locked (TVL) on the platform increased significantly, and community interest rose rapidly. Hyperliquid began to make a name for itself in the DeFi community towards the end of the year. January 2024: The Hyperliquid team officially announced the arrival of the HYPE token, the platform's native token. The community learned the first information about the upcoming airdrop and the token economy during this period.Q2 2024: Details of the airdrop program and governance model for the HYPE token were introduced. Users were given the opportunity to accumulate points as they used the platform and use these points towards future token distribution. This established a large user base even before the token's launch, laying the groundwork for participation in the platform's governance.Mid-2024: The number of listed trading pairs exceeded 150. This metric made Hyperliquid the largest perpetual DEX in the industry. Futures markets opened for many major and minor cryptocurrencies. This diversity attracted both individual and institutional investors, further increasing the platform's volume.November 2024: For those wondering when the HYPE token was released, this date is the answer. The official launch date for the HYPE token is November 28, 2024. On this date, Hyperliquid launched a massive HYPE airdrop, with a total supply of 1 billion HYPE tokens. Early adopters received 31% of the total supply (approximately 310 million HYPE) for free. This airdrop reached 94,000 users, making it one of the most widely participated distributions in crypto history and worth $1.2 billion at current prices. Around the same time, Hyperliquid officially launched its on-chain governance model alongside the token.2025: According to DeFiLlama, the total value locked (TVL) of Hyperliquid's Layer 1 blockchain, HyperEVM, reached almost $2 billion in just five months. According to Dune Analytics, since the end of May, HyperEVM has processed between 200,000 and 400,000 transactions per day. During this period, the number of daily active users (DAU) generally hovered between 15,000 and 20,000. By 2025, the HYPE price is hovering between $35-$40. Why is Hyperliquid Valuable?Key features that distinguish Hyperliquid from its peers and add value to it include:A fully on-chain architectureHyperliquid's entire transaction infrastructure, including the order book and matching engine, runs on the blockchain. This ensures transparent transactions, and user assets are not held by the platform but are secured in your own wallet. Instead of the liquidity pool logic of traditional decentralized exchanges (e.g., AMMs like Uniswap), Hyperliquid offers real-time price discovery using a fully on-chain order book DEX model.Its own dedicated layer-1 infrastructureHyperliquid runs on an independent layer-1 blockchain specifically designed for performance, meaning it is not dependent on another chain or layer-2 solution. Thanks to the customized HyperBFT consensus at the blockchain level and high scalability, it can process tens of thousands (theoretically hundreds of thousands) of transactions per second. Because it is not subject to the constraints of another chain, the platform's development direction is entirely under the control of the team and the community. High transaction speed and low latencyHyperliquid's infrastructure offers speeds comparable to those of a centralized exchange. Block times average around ~0.2 seconds, and transactions are finalized instantly. This means buy and sell orders are matched virtually without delay. During perpetual trading, price slippage is minimal, and thanks to its deep liquidity, market impact remains low even on large transactions. This performance makes Hyperliquid particularly attractive to professional traders pursuing high-frequency trading strategies.HYPE token governance and incentive mechanismHYPE is the native token of the Hyperliquid platform (also known as Hyperliquid coin). This token serves as a governance and incentive tool on the platform. HYPE holders can vote on proposed changes to the protocol, giving them a say in Hyperliquid's future. The HYPE token is also used to pay transaction fees on the network and provides staking opportunities, earning rewards for long-term holders. For example, with the staking program launched at the end of 2024, HYPE holders began earning annual returns of ~2-3%. In short, HYPE is both the administrative and economic fuel of the Hyperliquid ecosystem.Community-Driven and Fair Distribution ModelHyperliquid's development process and token economy are designed to center community interests. The project has not received any venture capital (VC) investment; it was launched entirely self-funded by the team. This allows decisions to be made based on the long-term interests of the community and the project, without external investor pressure. HYPE token distribution is also extremely community-friendly: approximately 76% of the total supply of 1 billion tokens has been allocated directly to the community. The initial genesis airdrop distributed 31% to active users, while the remaining 45% was reserved for future rewards and mining/liquidity incentive programs. The share allocated to the team and foundation does not exceed 24%, and this portion is locked long-term (team tokens are locked until the end of 2025, with a slow release scheduled for 2027-2028). This equitable distribution model ensures that control of the platform and its revenues are largely shared by users and the community. Considering the above points, the answer to the question, "What is the use of Hyperliquid coin?" on many people's minds becomes clear. The HYPE token is a critical tool that gives users a voice in the Hyperliquid ecosystem and incentivizes them to contribute. Thanks to this token, the platform combines decentralized governance with a high-performance trading experience.Who is the Founder of Hyperliquid?Who is the Founder of Hyperliquid? Hyperliquid Labs was founded by Jeff Yan and Iliensinc, two Harvard classmates. This core duo was joined by experienced individuals from prestigious educational institutions and financial giants such as Caltech, MIT, Citadel, and Hudson River Trading. The team boasts a strong profile in terms of technical knowledge, which is clearly reflected in the platform's architecture and performance.Jeff Yan, one of the founders, was also a co-founder of Chameleon Trading, a platform that previously operated in a centralized exchange format. However, the collapse of FTX in 2022 caused a major shakeup in confidence in the industry. Trust in centralized exchanges was severely damaged, and a significant gap emerged in the derivatives market. It was during this period that Jeff Yan and his team set out to develop a new structure based on decentralization. This vision paved the way for the birth of Hyperliquid.From the outset, Hyperliquid Labs chose not to seek funding from external investors, particularly venture capitalists (VCs). This choice allowed the team to remain independent and focus solely on product development, improving the user experience, and providing an efficient infrastructure. In other words, they were driven by technical excellence and the goal of creating solutions that benefit users, not by commercial pressures.Funded by their own resources and opting for direct, community-driven growth, the team holds the platform's future entirely in their own hands.While the founding team initially developed the platform with a centralized structure, they aim to transition to a fully decentralized governance system in the long term. Hyperliquid even stated from the outset that it planned a DAO model. To this end, they established voting and decision-making mechanisms through the HYPE token. As part of Hyperliquid's governance structure, significant protocol changes or updates are put to a community vote. As the project grows, the question "Who owns Hyperliquid?" increasingly becomes a question of "the community." Team members, meanwhile, maintain the protocol's technical development behind the scenes and regularly update the community. They maintain transparent communication through published technical documentation, roadmaps, and development proposals called Hyperliquid Improvement Proposals (HIPs).Frequently Asked Questions (FAQ)Below, you can find frequently asked questions and answers about Hyperliquid:What is Hyperliquid and how does it work?: Hyperliquid is a decentralized perpetual trading exchange operating on a self-developed layer-1 blockchain. All transactions and orders occur on-chain; the platform matches buyer and seller orders using an on-chain order book. This allows users to trade at speeds similar to centralized exchanges, while maintaining full control of their funds and transparently recording the entire process on the blockchain.What does the HYPE token do?: The HYPE token (also called Hyperliquid coin) is the native cryptocurrency of the Hyperliquid ecosystem and serves multiple functions. First, it provides a voice in platform governance: HYPE holders can vote on important decisions and shape the future of the protocol. The HYPE token is also a payment instrument that enables low-fee transactions and offers users the opportunity to earn passive income (rewards) through staking. Who is the founder of Hyperliquid?: Rather than having a single founder, Hyperliquid was founded by an anonymous team of experienced developers. The team members have previously worked at leading institutions in finance and blockchain, such as Citadel Securities, Jane Street, and Offchain Labs. Currently, the management of the platform is gradually being transferred to the community; this means that the ultimate owners of Hyperliquid will be HYPE token holders and the user community.Is Hyperliquid centralized or decentralized?: Hyperliquid aims for a fully decentralized structure. Because all transactions occur on the blockchain, users control their own funds, making the platform non-custodial. While a team operates the network's validators in the early stages, the plan is to add more independent validators over time, and to hand management over to the community through the DAO model. Therefore, while its infrastructure is a private chain, its operating principles and management make Hyperliquid a decentralized exchange. What's the difference between Hyperliquid and GMX or dYdX?: The key difference between Hyperliquid and popular decentralized derivatives exchanges like GMX and dYdX is its infrastructure and liquidity model. GMX operates on networks like Arbitrum and uses the AMM (automated market maker) model; liquidity is pooled and prices are determined by oracles. dYdX, on the other hand, was initially a layer-2 solution with an off-chain order book but is now attempting to increase decentralization by migrating to its own independent chain (based on Cosmos). Hyperliquid, on the other hand, uses a fully on-chain order book and operates on its own high-performance L1 chain. This allows Hyperliquid to optimize where both GMX and dYdX partially compromise: it offers significantly lower latency and deeper order book liquidity compared to GMX, while providing greater transparency and composability (interaction with other DeFi protocols) compared to dYdX thanks to transactions remaining on-chain. In short, Hyperliquid distinguishes itself from its competitors by striking a balance between CEX-level speed and full decentralization. The general differences between Hyperliquid and other DEXs can be illustrated in the following table:FeatureHyperliquidGMXdYdX (v4)InfrastructureCustom Layer-1Arbitrum / AvalancheCosmos AppchainLiquidity ModelOn-chain OrderbookGLP (AMM)Orderbook (Off-chain v3, On-chain v4)Execution SpeedHigh (~0.2 sec)MediumHighOn-Chain SettlementFully on-chainPartially off-chainFully on-chainToken DistributionCommunity-focusedVC-backedVC-backedGovernanceDAO (via HYPE token)DAO (legacy)dYdX DAOWhat is the future of Hyperliquid?: Hyperliquid is a promising project, having quickly become a leading decentralized derivatives market leader. By 2025, the platform's total trading volume will exceed $1 trillion, and its HYPE token market capitalization will reach levels that will place it among the top 20 crypto assets. Experts predict that Hyperliquid will expand its ecosystem with innovations like HyperEVM in the coming period, and developers will build more DeFi applications on the network. Furthermore, as governance mechanisms mature and network validators become decentralized, Hyperliquid could become a fully community-driven protocol. Of course, there are competitive landscapes and technical challenges, but Hyperliquid is well-positioned to address these challenges with both its technology infrastructure and community support. As a result, Hyperliquid is expected to continue to grow as a leading decentralized futures platform in the DeFi space.For more information on Hyperliquid and similar decentralized derivatives protocols, follow our JR Crypto Guide series.
Ripple Sets Eye on a Stablecoin Platform: Acquires $200 Million
Ripple, known for its blockchain-focused financial solutions, is preparing to make a significant acquisition to expand its digital payment infrastructure. The company announced that it will acquire stablecoin-backed payment platform Rail for $200 million. The deal is expected to close in the fourth quarter of 2025.Toronto-based Rail is a payment infrastructure provider backed by investors such as Galaxy Ventures and Accomplice. The company enables businesses to make fast and cost-effective international payments using stablecoins. This acquisition, which follows Ripple's launch of its RLUSD stablecoin, is considered part of the company's growth goals in the stablecoin space.Ripple President Monica Long said, “Stablecoins are becoming a cornerstone of modern finance. With Rail, we aim to further expand the use of stablecoins and blockchain technology in global payments.” Long also emphasized that Ripple already has one of the most widely used digital asset payment networks worldwide.What does Rail offer? With Rail's acquisition of Ripple, the services offered will be quite comprehensive. Thanks to the new system:Users will be able to receive and send payments in multiple currencies, including US dollars, via stablecoins, without having to hold crypto on their balance sheets.Companies will be able to easily manage third-party payments or internal financing flows on the same platform.High liquidity and competitive pricing will be provided for payments made using RLUSD, XRP, and other digital assets.Virtual accounts will allow users to conduct transactions without opening a crypto bank account or centralized exchange wallet.A single API will connect to a 24/7 infrastructure, facilitating integration with financial systems.Ripple's more than 60 financial licenses will provide regulatory-compliant and secure transaction processes.Global coverage will be increased through partnerships with more than 12 banks. Commenting on the acquisition, Rail CEO Bhanu Kohli said, “Over the last four years, Rail has distinguished itself with its ability to process international business payments with stablecoins at the fastest speeds. We share the same vision as Ripple and are excited to bring this innovation to millions of businesses worldwide.” Rail is expected to process more than 10% of global B2B stablecoin payments by 2025.Ripple's Growth StrategyThis move is a continuation of Ripple's active growth and expansion strategy. The company's strategic acquisitions and investments to date have totaled over $3 billion. Ripple aims to ensure regulatory confidence with its payment, custody, and stablecoin solutions for digital assets.Ripple's solutions integrate traditional financial infrastructure with blockchain technology, providing both lower-cost liquidity access and enabling the secure storage of digital assets. The company continues to aim to deliver fast, low-cost, and scalable transactions with products like the XRP Ledger and XRP token. At the time of writing, XRP is trading above $3, up 4 percent
ETC Comment and Price Analysis August 7, 2025
ETC/USDT Technical AnalysisWhen we analyze the Ethereum Classic (ETC) chart, we see that the uptrend has still persisted since March. The price has tested the trendline many times, but the sellers have always stepped in. ETC is trading at around $20.25 following the sell-off after it surged to the level at $27.07. Rising Trend ETC is currently struggling to hold above the support level at around $19.68, and it can test the resistance level at $22.53 again if it holds here. In case the price breaks above this resistance, then the momentum could propel the price towards the range between the levels at $25.79 - $27.07.In the event that this green band breaks, the price may first jump to $31.42 and then to the level at $39.00. If we see a downward action, we should be following the support levels $18.5, $16.65, and $15.79 respectively.These analyses, not offering any kind of investment advice, focus on support and resistance levels considered to offer trading opportunities in the short and medium term according to the market conditions. However, traders are responsible for their own actions and risk management. Moreover, it is highly recommended to use stop loss (SL) during trades.
Binance's "Test" Coin Experiences Flash Drop: 70% Melt in 1 Hour
On the morning of August 7th, the Test (TST) token attracted attention with a sudden and sharp drop in the market. The decline, which began in the morning hours, caused the token's price to lose nearly 70% of its value. According to data, the TST price reached a high of $0.0496 and a low of $0.01547 in a one-hour candlestick. Following this sudden move, the price stabilized around $0.0267. The market capitalization was estimated at approximately $25.33 million. The TST/USDT spot trading pair on Binance generated a total trading volume of $50.37 million in the last 24 hours. $15.95 million of this volume occurred during the one-hour period of the decline. After the price stabilized at lower levels, trading volume increased again, reaching $12.25 million within an hour. Total futures positions on the TST network decreased by 28.86% in the last 24 hours, falling to $25.76 million. Meanwhile, the total 24-hour trading volume of TST/USDT contracts across all platforms reached $266 million. This volume saw a 1,173% increase, while contract trading volume on Binance alone reached $205 million. The increase in trading volume on Binance was recorded as 1,855%.There is currently no information regarding the trigger behind the decline.What is TST?TST is a token known as a "Test Token" created on BNB Chain using the BEP-20 standard. Originally developed for training and testing purposes, TST was used as a sample token in BNB Chain's developer documentation. However, it later began to be traded by the community and individual investors.The token went viral in the Binance Smart Chain community in May. Its price rose rapidly, particularly on social media, following its inclusion in TST's developer documentation and the perception that it was "Binance-backed." Some analysis platforms reported that TST gained more than 4,000% in value in just a few days, and its market capitalization quickly surpassed $500 million.Following this rapid rise, TST experienced a major sell-off in May 2025. The price lost approximately 40% of its value, particularly after a whale sold approximately $7 million worth of TST. While the price recovered somewhat following this sale, high volatility persisted.The increase in volume and position decreases, particularly in the last 24 hours, indicate heavy trading activity in both spot and futures markets. Price fluctuations are expected to continue in the short term.

KakaoBank Joins South Korea's Stablecoin Race
KakaoBank, one of South Korea's leading digital banks, is preparing to enter the country's rapidly growing stablecoin sector. The company is evaluating plans to both issue stablecoins and offer custody services. This move comes shortly after the South Korean Central Bank halted its central bank digital currency (CBDC) pilot project.KakaoBank takes the reins for stablecoinsKakaoBank Chief Financial Officer (CFO) Kwon Tae-hoon announced at the meeting where the bank announced its first-half 2025 financial results that it is actively evaluating various methods related to the digital asset ecosystem, particularly stablecoin issuance and custody services. "We plan to actively participate in line with market dynamics," Kwon said, noting that strategic steps in this area are being coordinated with other units within the Kakao ecosystem.KakaoBank is currently part of a weekly stablecoin-focused task force that includes Kakao, KakaoPay, and the bank. This strategy team is led by Kakao CEO Chung Shin-ah, KakaoPay CEO Shin Won-keun, and KakaoBank CEO Yoon Ho-young.From CBDC pilot to stablecoin move: The process continuesKakaoBank's shift towards stablecoins was significantly influenced by the Central Bank's cancellation of the CBDC testing process. This project, which had previously entered the testing phase with commercial banks, was suspended after President Lee Jae-myung introduced a new bill enabling stablecoin issuance.Kwon Tae-hoon emphasized that KakaoBank is in an advantageous position in the sector in terms of technical infrastructure, saying, "We participated in both phases of the CBDC pilot; we developed wallets and managed transfers and transactions." Furthermore, over the past three years, the bank has gained experience in complying with KYC and AML regulations, such as opening real-name accounts for crypto exchanges. The new government, which took office following the June 3rd elections, is aiming to reform the financial system. President Lee Jae-myung has pledged to issue a stablecoin pegged to the Korean won (KRW). This stablecoin is intended for use in both domestic trade and international payments.However, Central Bank Governor Lee Chang-yong remains cautious about the stablecoin plans. According to local media outlet Kukmin Ilbo, Lee remains skeptical about the risks and long-term impact of stablecoin issuance.This shift in the stablecoin space has sparked significant individual investor interest in South Korean markets. Shares of Circle, the US-based company that issues USDC, were the most purchased foreign stock among Korean investors in June. Industry representatives speaking to Korean media indicate that Circle is in contact with local regulators to enter the Korean market.Meanwhile, a new law in Hong Kong, which took effect on August 1st, has launched a licensing regime for stablecoin issuers.
What is Bitget Token (BGB)?
We encounter new names every day in the crypto world. Sometimes these names emerge from exchange platforms, sometimes from game projects, and sometimes from meme culture. But there are others that grow quietly while gradually gaining acceptance with a robust infrastructure and user-centric vision. Bitget Token (BGB) falls right into this category.You may have heard of Bitget before. Founded in 2018, this crypto exchange has begun to make a name for itself globally in recent years, starting in Asia. With its user-friendly features like "copy trading," secure infrastructure, and active community management, Bitget has caught the attention of many investors. As a natural consequence of this growth, the platform felt the need to create its own value cycle, and that's precisely where Bitget Token (BGB) entered the scene.So, what is Bitget coin? In its simplest form, BGB is the native cryptocurrency developed by Bitget crypto exchange to power its own ecosystem. In this guide, we will go beyond the technical structure of Bitget Token and explain: We'll explain in detail how it emerged, how it gained value, what opportunities it offers investors, and what path it's heading in the future. If you don't want to gloss over the question, "What is Bitget token?" with just a superficial answer, let's delve deeper together.Definition and Origins of Bitget TokenBitget exchange has established itself as a strong presence among emerging crypto platforms in recent years. Its user-friendly interface, innovative features like copy trading, and wide product range have attracted the attention of many investors. However, an exchange isn't just notable for its trading interface; it's also for the ecosystem it creates within itself. At this point, a structure emerged that nourishes Bitget's inner world and aims to offer even more benefits to its users: Bitget Token (BGB).BGB token is a digital asset developed by Bitget to offer special advantages to its community. In fact, we know this story from other major exchange tokens. Just as Binance's BNB, OKX's OKB, and KuCoin's KCS have established ecosystems within their platforms, Bitget decided to follow a similar path. Aiming to increase user loyalty by offering lower transaction fees, exclusive event access, passive income opportunities, and additional on-platform features, Bitget launched BGB to achieve this goal.Technically, BGB is an ERC-20 token. This means it runs on the Ethereum blockchain, providing it with both high security and broad compatibility. Since many wallets, DeFi applications, or platforms currently support the ERC-20 standard, BGB can seamlessly integrate with this infrastructure.But the most important aspect isn't the technical details; it's the token's philosophy. Bitget was looking for ways to offer more value to its growing user base and connect them to more platforms. Because simply making transactions isn't enough; users also want to earn, participate, and have a say. BGB addressed this need. After launch, it became available not only on centralized exchanges but also in products like Bitget's decentralized wallet application, Bitget Wallet. This created an ecosystem token that wasn't limited to exchanges but also expanded with Web3 integrations. Services on Bitget. So, when exactly was this token launched? BGB's birthday is July 26, 2021. That day, it officially joined the crypto world by listing on the Bitget exchange. The launch price was quite affordable: it was offered to investors at a modest price of $0.0585. It may not have generated much buzz at the time, but no one could have predicted what a significant cornerstone BGB would become over time.The token's total supply was set at 2 billion units. This is a fairly standard initial supply compared to many exchange tokens on the market. However, this entire supply wasn't released at once. Approximately 1.4 billion BGB entered circulation immediately upon launch. The remainder was allocated to serve carefully planned, long-term goals.For example:20% was set aside for team and employee incentives. This has made BGB a structure that provides rewards not only to investors but also to those working on the project. 15% was used for brand collaborations, campaigns with influencers and content creators. This strengthened the marketing aspect of the project.Another 15% was allocated to referral programs. This means everyone who brought new users to Bitget was incentivized with rewards from this token.Another 15% was allocated to the ecosystem development fund, providing resources for the platform's future technological and strategic steps.Finally, 10% was transferred to the Investor Protection Fund. This fund serves as a significant reserve created to protect users against potential risks and ensure the platform's sustainability.This entire distribution structure clearly demonstrates that Bitget operates not just with a "let's issue tokens" mentality, but with a long-term, balanced growth goal. Another noteworthy detail is that Bitget didn't forget its previous token, BFT, when launching BGB. During the launch, 25% of the total supply was distributed to existing BFT holders via swap. This way, existing users were not only spared the burden but also integrated into the new system.As a result, the creation of BGB was not merely a crypto asset, but a benefit-focused and strategic step that directly reflected Bitget's vision to its users. Today, it offers investors a versatile range of uses, not only with its on-exchange advantages but also with staking programs, launchpad access, and Web3-enabled features. In this respect, it distinguishes itself from many exchange tokens and has established itself at the heart of a robust ecosystem.Bitget Token's History: Key MilestonesCrypto projects, just like people, grow and transform over time, sometimes changing direction with critical decisions. Bitget Token (BGB) has established a structure that has undergone this transformation process and grown stronger step by step at every stage. It has experienced many significant developments since its launch; however, 2024, in particular, stood out as a turning point in BGB's fortunes.Let's now examine BGB's historical development:2021 - Launch: Bitget Token first appeared on July 26, 2021. Launched on the Ethereum network using the ERC-20 standard, BGB was listed at a launch price of approximately $0.0585. The total supply was set at 2 billion tokens, of which approximately 1.4 billion entered direct circulation. This officially joined the ranks of crypto exchanges issuing their own native tokens.2022 - Initial Expansion: BGB's use case was not limited to transaction fees. With the launch of decentralized products like Bitget Wallet, the token began to gain traction on the Web3 platform. At the same time, it became a token that attracted investors with its staking, launchpad, and passive income models.2023 - Community and Collaborations: This year, Bitget organized numerous campaigns to introduce BGB to a wider audience. Social media activities, influencer/celebrity collaborations (like Messi), community rewards, and profit sharing through copy trading fueled interest in the token. 2024 - The Big Burn and Buyback & Burn Period: December 2024 marked a turning point for BGB. In its updated BGB whitepaper, Bitget announced that it would burn 800 million tokens. This meant the permanent destruction of 40% of the total supply, or approximately $5 billion worth of BGB. With this major move, the total supply dropped from 2 billion to 1.2 billion BGB. With this burn, Bitget initiated the process of transitioning BGB to a deflationary model. Later that year, Bitget wasn't content with just this big burn. It also announced a sustainable mechanism called "buyback & burn." Under this system, the exchange buys BGB from the market with 20% of its quarterly profits and burns these tokens. In other words, reducing the supply has moved from a one-time decision to a regular, long-term strategy. The supply change after the coin burn was as follows:PeriodTotal Supply (BGB)Burned Amount (BGB)Remaining Supply (BGB)July 20212,000,000,00002,000,000,000Launch price: $0.0585December 20242,000,000,000800,000,0001,200,000,00040% of total supply was burnedDecember 2024 - All-Time High (ATH): The market quickly responded to the impact of the massive burn and buyback system. By the end of December, the BGB token reached an all-time high of $8.49. This represented a valuation of almost 150 times its 2021 launch price.2025 - Remains Strong: As of 2025, BGB naturally experienced a slight pullback after its peak. However, as of July, its price hovered around $4.55, while its total market capitalization was still over $5 billion. This demonstrates the token's continued strength and the continued validity of Bitget's long-term strategy. Why Is Bitget Token Valuable?So far, we've examined in detail when BGB emerged and how it evolved. So, let's get to the heart of the matter: Why is the BGB token valuable? What features make it an investable and long-term asset? Does it simply offer a discount on transaction fees, or is there more to it? Let's take a look at the aspects that make BGB valuable.Transaction Fee AdvantageFor those who regularly trade in the cryptocurrency market, commission rates become a significant cost over time. This is where BGB comes in. Bitget offers its users a discount on transaction fees of up to 20% when they trade with BGB. This discount translates to significant savings in the long run, especially for spot traders. Just imagine, a user who makes dozens of transactions a day could save hundreds of dollars at the end of the year simply because they pay commissions with BGB. This makes BGB not only an investment but also a savings tool. Early Bird Tickets to Launchpad and LaunchpoolOne of the things crypto investors love most is getting early access to new projects. Bitget doesn't leave its users alone in this regard. BGB holders can participate in Launchpad events organized on the platform and invest in tokens of high-potential projects before they even launch. In other words, the "early bird wins" principle applies here. Furthermore, thanks to the Launchpool feature, users who stake BGB have the opportunity to earn new tokens for free. You receive rewards without investing and have the opportunity to discover new projects. In short, if you have BGB in your pocket, Launchpad's doors are open to you. The differences between Bitget's services, namely Launchpad, LaunchX, Launchpool, and PoolX, are as follows:FeatureStrengthsPerfect ForBitget LaunchpadEarly investment opportunities, rigorous project selection, user-friendly participationVisionary investors and crypto enthusiasts looking to ride blockchain trendsBitget LaunchXTransparent allocation mechanism, access to premium projects, snapshot-based pricingWeb3 enthusiasts and dedicated investors seeking fairness and quality accessBitget LaunchpoolConsistent hourly rewards, flexible unlocking, real-time APR updatesBeginners and risk-averse users seeking flexible and steady crypto earningsBitget PoolXProportional incentives, quick feedback with hourly earnings, detailed tracking and transparencyActive users who value immediate results and frequent rewardsStake, Earn Easily: Passive Income OpportunitiesBGB doesn't just offer transactional advantages; it's also the key to generating passive income. Thanks to Bitget's Earn programs, users can stake their BGB and earn returns at certain rates. This system is similar to depositing money in a bank and earning interest. Users who lock BGB, especially in "stake-to-mine" systems, earn additional BGB rewards and can benefit from airdrops from certain projects. This means they can earn not only by holding but also by contributing to the system. It's a highly attractive option for long-term investors.VIP privileges, Groupcoin discounts, and profit sharingBitget positions BGB not just as a "token" but as a membership card. Holding a certain amount of BGB in your wallet automatically enrolls you in the VIP program. This means you'll receive additional discounts on transaction fees, dedicated customer support, fast support lines, and many other benefits. Additionally, a feature called Groupcoin allows users who hold BGB to purchase popular cryptocurrencies at a discount during certain periods. In other words, you can buy a coin worth $100 in the market for $85.And there's more: In Bitget's highly popular copy trading system, BGB holders can both become followers and share a portion of the revenue generated by successful traders. For example, up to 10% of the performance fee paid by investors who follow a trader can be transferred directly to the leading trader in BGB. This rewards successful traders and expands the use of BGB.And let's not forget: daily prize-winning events like the Bitget Lottery, free withdrawals, special campaigns, and many other bonus features are also exclusive to BGB holders. In short, BGB acts like an entrance ticket to Bitget's closed-circuit club.Real-World Usage: Bitget Pay and cardsOne of the biggest criticisms of cryptocurrencies is the claim that they "can't use them in daily life." However, Bitget has taken steps to make BGB usable not only within the platform but also for real-world transactions. Thanks to the Bitget Pay feature, users can make payments with BGB or make instant transfers to other users.Even better, BGB can be used for direct spending with the crypto payment cards Bitget offers. Grocery shopping, bill payments, and even online shopping sites offer the option to pay with BGB. Furthermore, various discounts and cashback advantages are offered during these transactions. In other words, a token structure that earns you money as you spend has been created. Here, BGB is not only an investment but also an active payment tool.A Rising Role in DeFi and Web3Bitget's goals are not limited to its own centralized exchange. With the updates announced at the end of 2024, BGB is now actively used within Bitget Wallet. This integration has enabled BGB to play a much larger role in the world of decentralized finance (DeFi) and Web3. The token's use to pay transaction fees (gas fees) across multiple chains, in particular, signifies significant broader use. It is also expected to play an active role in areas such as staking, liquidity provision, yield farming, and DAO governance.Who is the Founder of Bitget Token?One of the most frequently asked questions in the crypto world is: "Who is behind this token?" A project's credibility, sustainability, and potential are often directly linked to the vision of the team that created and manages it. However, when it comes to the BGB token, the answer isn't a classic "founding name." In other words, it's impossible to cite a single person, like Vitalik Buterin founding Ethereum or CZ creating Binance. BGB is a platform token created directly by the Bitget exchange.In other words, if you ask whose project the BGB token is, the answer is quite clear: it's the Bitget exchange's project. Founded in 2018, Bitget has grown globally over the years, operating in many countries and proving itself particularly in the field of copy trading. During this growth process, it launched its own native token to enrich the user experience and strengthen the ecosystem. Thus, BGB was born. Of course, there were key figures involved in the development of this token. Bitget has an experienced and visionary management team that has played a significant role in its current success. Gracy Chen, in particular, is one of the most prominent names on this team. She joined Bitget in 2022 and was appointed CEO just one year later, in 2023. Under her leadership, Bitget has entered a second wave of growth, expanding its Asian market presence to regions like Europe and the Americas.As a leading female figure in the industry, Gracy Chen stands out for both her communication with the community and her strategic initiatives. She also played a significant role in clarifying the BGB token's vision and transitioning to a deflationary model. In other words, it's safe to say that BGB isn't just a technical project; it's shaped by leadership that listens to the community.Of course, Gracy Chen isn't alone. Bitget's current senior executives include prominent figures such as Vugar Usi Zade (COO), Hon Ng (CLO), and Min Lin (CBO). These individuals guide the company in many areas, from operational processes and legal structuring to corporate partnerships and community strategies. Vugar Usi Zade, COO, manages critical projects related to user experience and product optimization. Hon Ng, CLO, oversees Bitget's regulatory processes in various countries, ensuring the company's sustainable global growth. Min Lin, CBO, is responsible for business development and partnership strategies.This team is constantly taking new steps not only in the token's launch but also in how to make it more usable. Developed staking mechanisms, Launchpad processes integrated with BGB, the buyback & burn system, and Web3 integrations are all shaped by the contributions of this strategic team.Frequently Asked Questions (FAQ)Below are some frequently asked questions and answers about BGB:What is the BGB token and what does it do?: The BGB token is the native cryptocurrency used within the Bitget cryptocurrency exchange's platform. It offers many useful features, including transaction fee discounts, early access to new projects (Launchpad/Launchpool), passive income through staking, and VIP membership privileges. In short, BGB is both an easy-to-use tool within the Bitget ecosystem and a currency offering various advantages to its investors.When was the BGB token launched?: The BGB token was launched on July 26, 2021. Initially listed at a price of approximately $0.06, the token was released to users in mid-2021. Therefore, BGB's launch date is 2021 and it has been a cornerstone of the Bitget ecosystem since then.Whose project is the BGB token?: BGB is a direct project of the Bitget exchange. In other words, it was developed and issued by Bitget, not by a separate company or an anonymous team. Bitget's founders and executives are the team behind the BGB token, and this team makes the decisions that shape the token's use cases, burn strategies, and benefits.Why is the BGB token valuable?: The BGB token is valuable because it provides tangible benefits within the Bitget ecosystem. Providing users with discounted transaction fees, entitlement to participate in special events on the platform, and passive income opportunities all contribute to its demand. Furthermore, Bitget's regular token burns, which reduce the supply and make BGB a key asset on both its centralized and decentralized platforms, underpin its long-term value.What advantages does the BGB token offer?: BGB token holders enjoy a number of advantages on the Bitget exchange. Chief among these are transaction fee discounts of up to 20%. Additionally, with BGB, they can gain early access to new project tokens through Launchpad and earn free tokens by staking on Launchpool. Additional privileges such as participation in the VIP program, profit sharing, discounted coin purchases (Groupcoin), and free withdrawals are among the advantages offered by BGB. In short, BGB is a token that enriches the user experience and offers earning opportunities.How is the BGB token supply reduced?: Bitget is implementing a buyback and burn strategy to reduce the BGB token supply. By the end of 2024, 800 million BGB were burned at once, reducing the total supply by 40%. Starting in 2025, a program was initiated to purchase and burn BGB from the market every quarter with a portion of its profits. Thanks to these regular burns, the amount of BGB in circulation decreases over time, making the token deflationary and increasing the relative value of BGB held by existing holders.What peak prices has the BGB token reached in the past?: The most notable peak for the BGB token was around $8.50 in December 2024. This was recorded as an all-time high. It's also worth noting that BGB reached several interim peaks throughout 2024, reaching around $1.70 in November 2024 and then rapidly rising to over $8 towards the end of the year. In 2025, BGB's price remained below this record, but in July 2025, it still held a strong value in the $4-5 range. This demonstrates that BGB has demonstrated incredible performance since its launch and has delivered high returns to early investors.For more content on platform tokens and exchange-based ecosystems, check out our JR Crypto Guide series.

Nasdaq-Listed Company Opens Portfolio: Most Held are BTC and 4 Altcoins
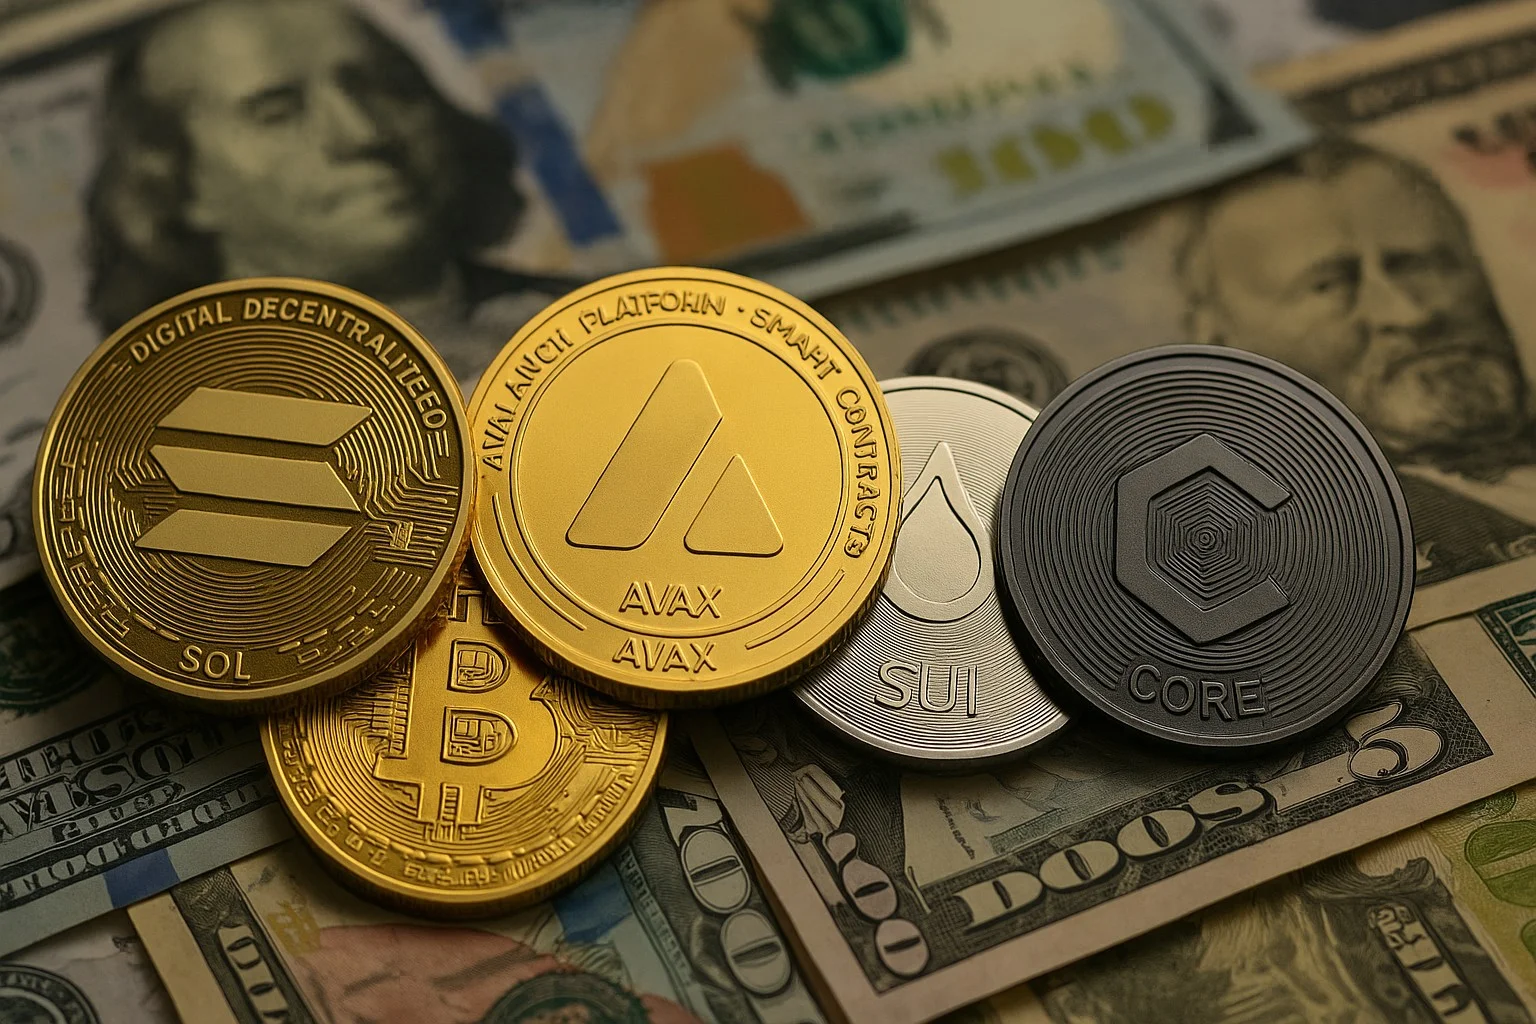
DeFi Technologies Inc. (Nasdaq: DEFT), a financial technology company that bridges the gap between decentralized finance (DeFi) and traditional capital markets, has seen impressive growth since July 2025. Its subsidiaries, Valour Inc. and Valour Digital Securities Limited (Valour), reported $947 million in assets under management (AUM) at the end of July, a 23% increase from the previous month. Bitcoin, Solana, SUI, Avalanche, and CORE were among the crypto assets that accounted for the largest share of the company's portfolio.Valour had the second-best performance of the year, recording net inflows of $14.4 million in July. Total net inflows since the beginning of 2025 reached $90.4 million.Notable ETPs: SOL, DOGE, and SUIThe products that saw the most inflows in the company's ETP portfolio included both established and newly listed assets such as SOL, DOGE, and SUI. Valour's net inflows for these products were as follows:VALOUR SOL SEK: $5.5 millionVALOUR DOGE SEK: $2.66 millionVALOUR SUI SEK: $2.38 millionVALOUR SEI SEK: $1.09 millionVALOUR CRV SEK: $926,000Valour generates its revenue primarily from staking returns and management fees on the assets it manages. In the first quarter of 2025, it generated $10 million in staking and lending revenue and $2.6 million in management fees. As of July 31st, the ETPs with the highest AUM were:VALOUR BTC: $291.9 millionVALOUR SOL: $269.4 millionVALOUR ETH: $86.6 millionVALOUR XRP: $65.1 millionVALOUR SUI: $58.4 millionVALOUR ADA: $51.8 millionValour has over 75 ETPs listed on European and UK exchanges. The company aims to increase this number to 100 by the end of 2025. Recently, eight new products based on digital assets such as BCH, LEO, OKB, POL, ALGO, FIL, ARB, and STX were listed on Sweden's Spotlight Stock Market platform. Valour also entered the Swiss market with its HBAR and ICP staking products. The company holds the most Bitcoin and these four altcoins in its treasuryAs of the end of July, DeFi Technologies' cash and USDT balance stood at approximately $17 million. Its debt remained stable at $6 million. Its digital asset treasury reached $73.5 million, and the portfolio included the following assets:BTC (251.6 units): $29.7 millionSOL (61,000 units): $11.6 millionAVAX (398,321 units): $9.5 millionCORE (7,100,000 units): $4 millionSUI (4,913,918 units): $18.5 millionStillman Digital, one of the company's subsidiaries, processed approximately $1.95 billion in trading volume in July. A strategic partnership was also formed with Ozean, Clearpool's RWA protocol. This partnership aims to facilitate the inflow of institutional capital into real-world assets (RWA). Finally, the trading unit, called DeFi Alpha, generated $114.1 million in revenue since its launch in the second quarter of 2024. Specifically, a one-time arbitrage transaction on May 5, 2025, yielded $17.3 million.
A First in Japan: Application for a Crypto ETF Combining Bitcoin and XRP
Japan-based financial giant SBI Holdings has officially filed an application with the Japan Financial Services Agency (FSA) for a dual-asset crypto ETF (Exchange-Traded Fund) featuring Bitcoin and XRP, marking a first in the country. This move could mark the first time XRP has been considered an institutional-level investment product in the Japanese financial market.Announced in the company's second-quarter 2025 financial report, this new product is called a "Crypto-Assets ETF." The fund aims to provide investors with a single investment gateway offering direct access to both Bitcoin and XRP. The fund's structure aims to offer investors a diversified crypto portfolio by simultaneously monitoring the performance of both assets.Another ETF application is also mentionedSBI has also filed an application for a second product, the "Digital Gold Crypto ETF." This fund plans to allocate more than 50% of its portfolio to gold ETFs and invest the remainder in gold-backed cryptocurrencies. This hybrid structure particularly appeals to investors who are wary of volatility but don't want to completely avoid crypto assets. If the applications are approved by the FSA, XRP will be offered to investors in Japan as part of a regulated investment product for the first time. This is seen as a significant step in the global legitimacy of XRP, which is based on Ripple's payment technologies. As you may recall, XRP remains excluded from many major institutional investment products due to regulatory uncertainties in the US.SBI Holdings CEO Yoshitaka Kitao stated, "This initiative reflects our commitment to integrating blockchain-based assets into the regulated financial system in Japan and Asia."SBI's move is significant for investors in Japan, as well as in Asia in general. It's a fact that institutional investors in this region may see a softening of their approach to cryptocurrencies. Furthermore, the greater acceptance of XRP in Japan could encourage other financial institutions in the region to develop similar products. This development has been met with great excitement in the crypto community, especially among XRP supporters. This group, known as the "XRP Army," interprets SBI's ETF application as a significant milestone in gaining institutional recognition for XRP.As of August 6, 2025, when the news broke, the price of XRP was trading around $2.95. According to JrKripto data, XRP is listed as the third-largest cryptocurrency with a market capitalization of $174.5 billion. Having gained approximately 30% in the last 30 days, XRP has attracted renewed attention due to increased institutional adoption. However, it's worth noting that SBI's move has not yet been reflected in the price.While official approval has not yet been received, SBI's application can be expected to open a new chapter in Japan's crypto finance sector.