
Open Campus (EDU) Technical Analysis
Looking at the EDU chart, we can see that the price has tested the lower band of the uptrend around $0.128, also the golden ratio support, which is a major Fibonacci support. This support zone has previously worked as buyers have been strong.
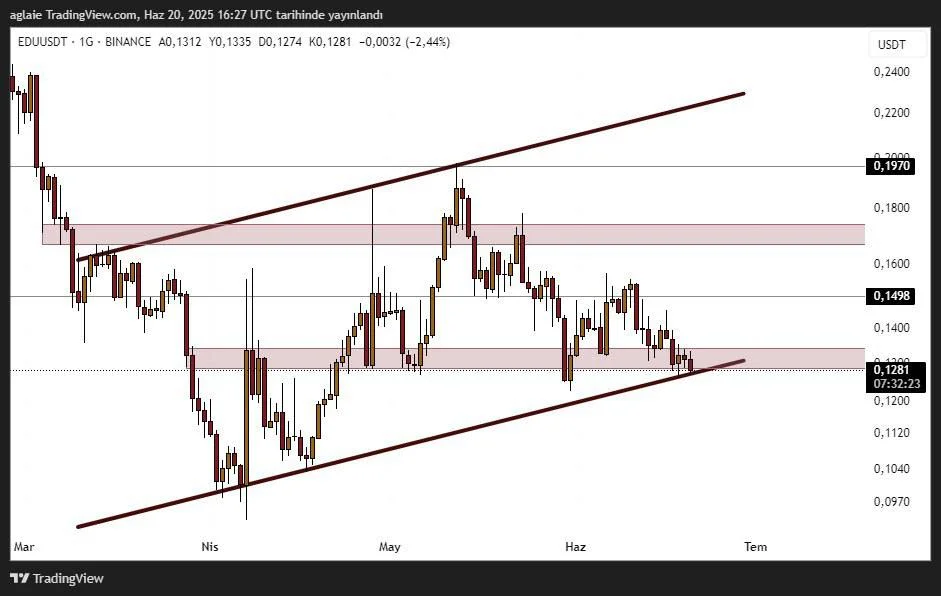
Price reactions are usually very strong in such structures. Upon studying the chart, it can be stated that possible upward reactions from here could take the price to the first resistance level of $0.1498.
The market structure could turn to positive in lower time frames if we see closings above the level of $0.1498, and if this price level is exceeded, then it can go up to the price range of $0.17–$0.18. In case the price closes above this price range, we may get confirmation for a positive pattern and the price wants to go towards the upper band of the trend.
We will lose two strong support levels if the price breaks down. We may start to speak of the price range of $0.1150–$0.1040 in case both the trend structure breaks down and the golden ratio support gets lost. If the price stays below this price zone, then the current descending pattern receives confirmation, which will probably cause increasing sell pressure. We should be following the previous liquidity area of $0.1000–$0.0960 below this level.
In summary, EDU is currently stuck between a ‘reversal from support’ and a ‘trend breakout’ scenario. We could say that what will determine the certain direction of the coin price might be the price movements happening around this support level in the coming days.
These analyses, not offering any kind of investment advice, focus on support and resistance levels considered to offer trading opportunities in the short and medium term according to the market conditions. However, the user is responsible for their own actions and risk management. Moreover, it is highly recommended to use stop loss (SL) during the transactions.


