
PNUT Technical Analysis
A falling wedge formation, also visible in the daily time frame, is more clearly seen on PNUT 4-hour chart. PNUT is currently trading between $0.2192 - $0.2306, which is a very critical horizontal zone.
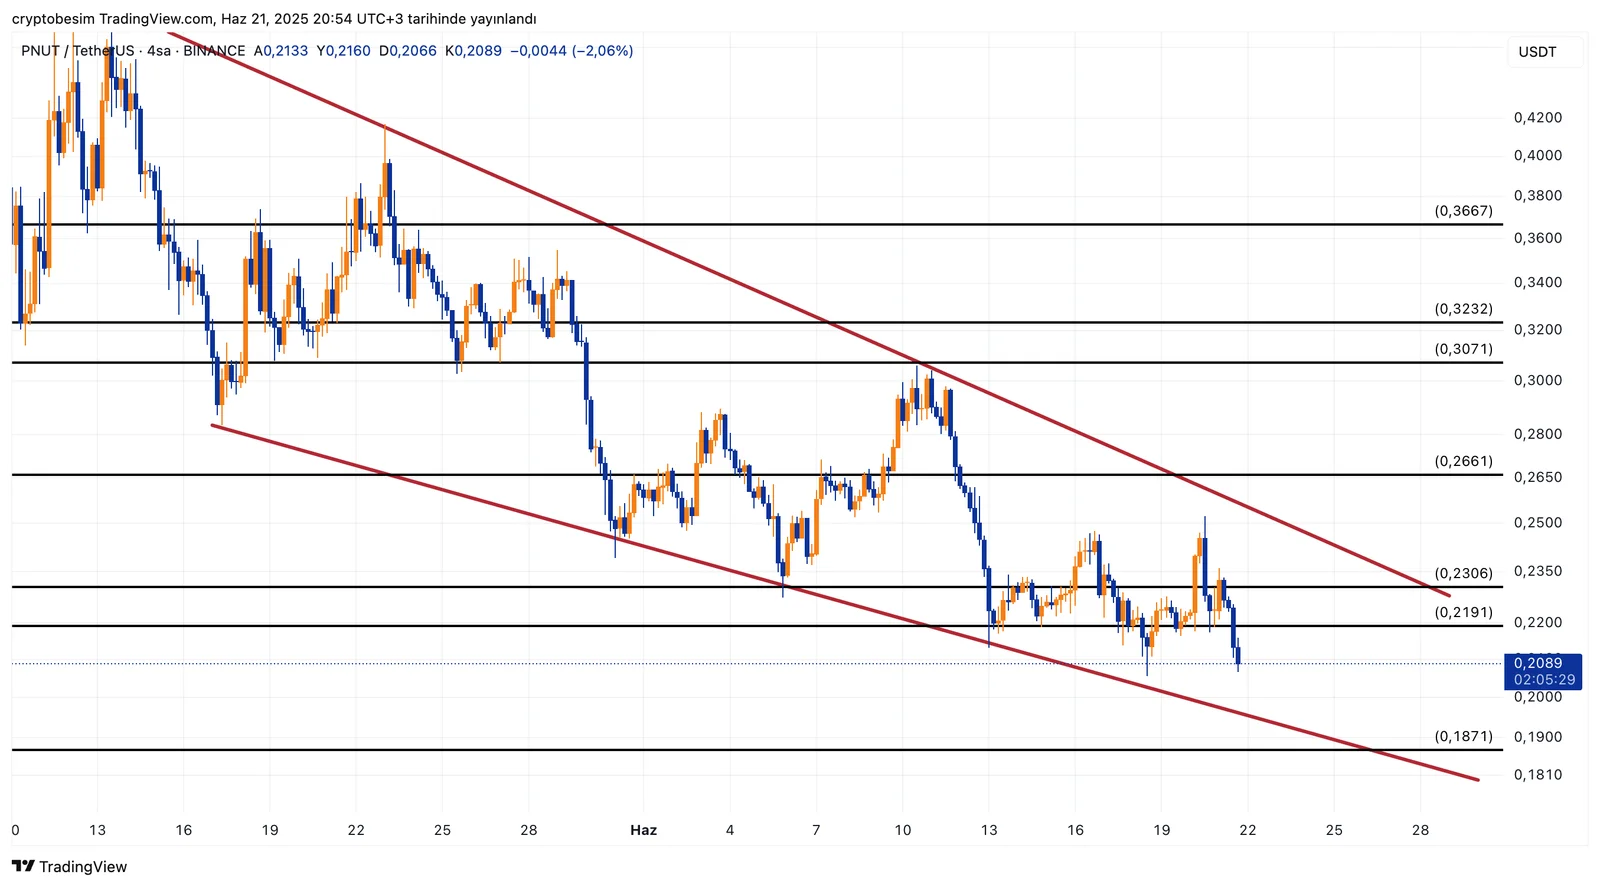
The price of the coin has tested the upper trend of the formation three times so far. It is highly probable that we will see an upward breakout of the price when there occurs a fourth-time trend test. And this is the target of the clearly seen falling wedge formation on the chart. In case the price goes down below the level of $0.219, our targets would be first $0.20 and then $0.195, which also acts as trend support level. However, if the price breaks out of the falling wedge upward, our possible targets will be $0.266, $0.307, and $0.360 respectively.
These analyses, not offering any kind of investment advice, focus on support and resistance levels considered to offer trading opportunities in the short and medium term according to the market conditions. However, the user is responsible for their own actions and risk management. Moreover, it is highly recommended to use stop loss (SL) during the transactions.


