
ONDO Technical Analysis – Ready to Bounce from Channel Bottom
ONDO shows a solid structure on the daily chart from a broader perspective. The price has once again touched the lower band of the ascending channel it has been trading in for a long time. This level has historically acted as a strong support zone, where buyers have frequently stepped in.
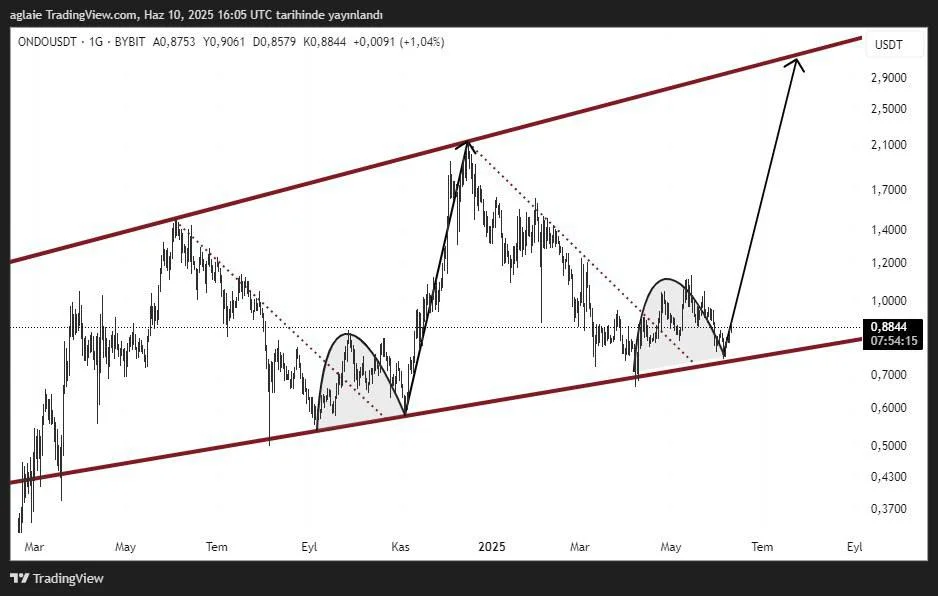
Looking at the chart, two previous similar correction patterns led to a breakout of the falling trendlines, resulting in sharp rallies toward the upper band of the channel. Now, a third occurrence of this pattern is on the table.
If the price responds positively from this area, the first resistance level lies at $1.20. A break above this point could pave the way for ONDO to target the $2.90–$3.00 range — the upper boundary of the channel. In particular, weekly closes above $1.50 may technically trigger this rally.
In the bearish scenario, the $0.78–$0.80 zone acts as the final line of defense. If this area is broken to the downside, the ascending channel structure could be invalidated, potentially accelerating the downward move.
Conclusion: ONDO is currently trying to hold above the lower band of the ascending channel. Since this zone has historically triggered strong bullish reactions, it should be monitored closely. In the bullish case, a significant rally toward $2.90 remains possible. However, a close below $0.78 would invalidate this optimistic setup.
Disclaimer: This analysis does not constitute investment advice. It focuses on support and resistance levels that may present potential short- to mid-term trading opportunities depending on market conditions. However, all responsibility for trading decisions and risk management lies entirely with the user. The use of stop-loss orders is strongly recommended for any trade setup shared.


