
TIA Short-Term Technical Analysis
TIA is moving within a wide and well-defined descending channel. The price is currently at $2.015 and is very close to the lower band of the channel.
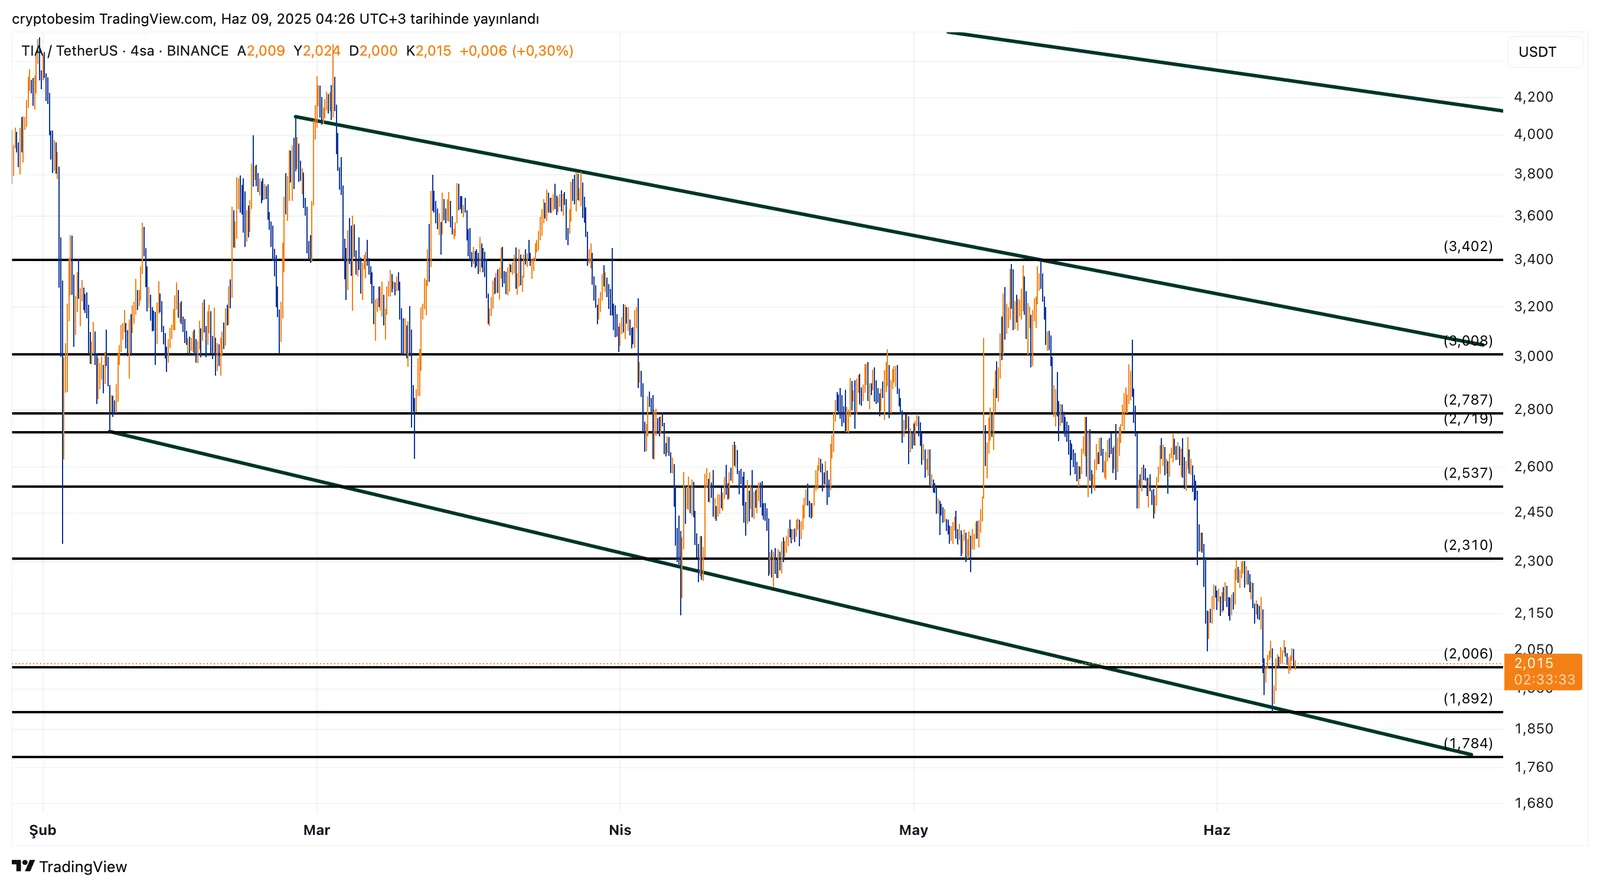
This level also overlaps with the horizontal support at $1.892.
Due to the channel structure, reactions from the lower band of the channel often become the starting point for upward movements. However, the important point here is: whichever direction the breakout occurs, the technical target is approximately the length of the channel. This means a distance of about $1.60–$1.70.
In other words:
- In an upward breakout, the target is the $2.787–$3.000 range,
- In a downward breakout, the target is $1.784 and below.
For now, there has not yet been a breakout. The price continues to oscillate within the channel. The first resistance to watch on the upside is $2.310. If this area is surpassed, $2.537 and $2.719 levels will successively come into focus.
On the downside, the critical support zone is $1.892. If this level is broken, the channel structure is invalidated and a gap could open down to $1.784.
In summary:
- The price is near the bottom of the channel, but no breakout confirmation has come yet.
- For a bullish move, closes above $2.310 should be watched.
- On the downside, if $1.892 cannot be defended, selling pressure may deepen.
- For now, the price continues to fluctuate within the channel.


