Altcoin
This page lists the latest Altcoin news and market analysis. Browse articles, expert insights, and updates in this category on JrKripto. Stay informed with in-depth coverage of cryptocurrency trends and developments.
News
Altcoin News
Altcoin News
Browse all Altcoin related articles and news. The latest news, analysis, and insights on Altcoin.
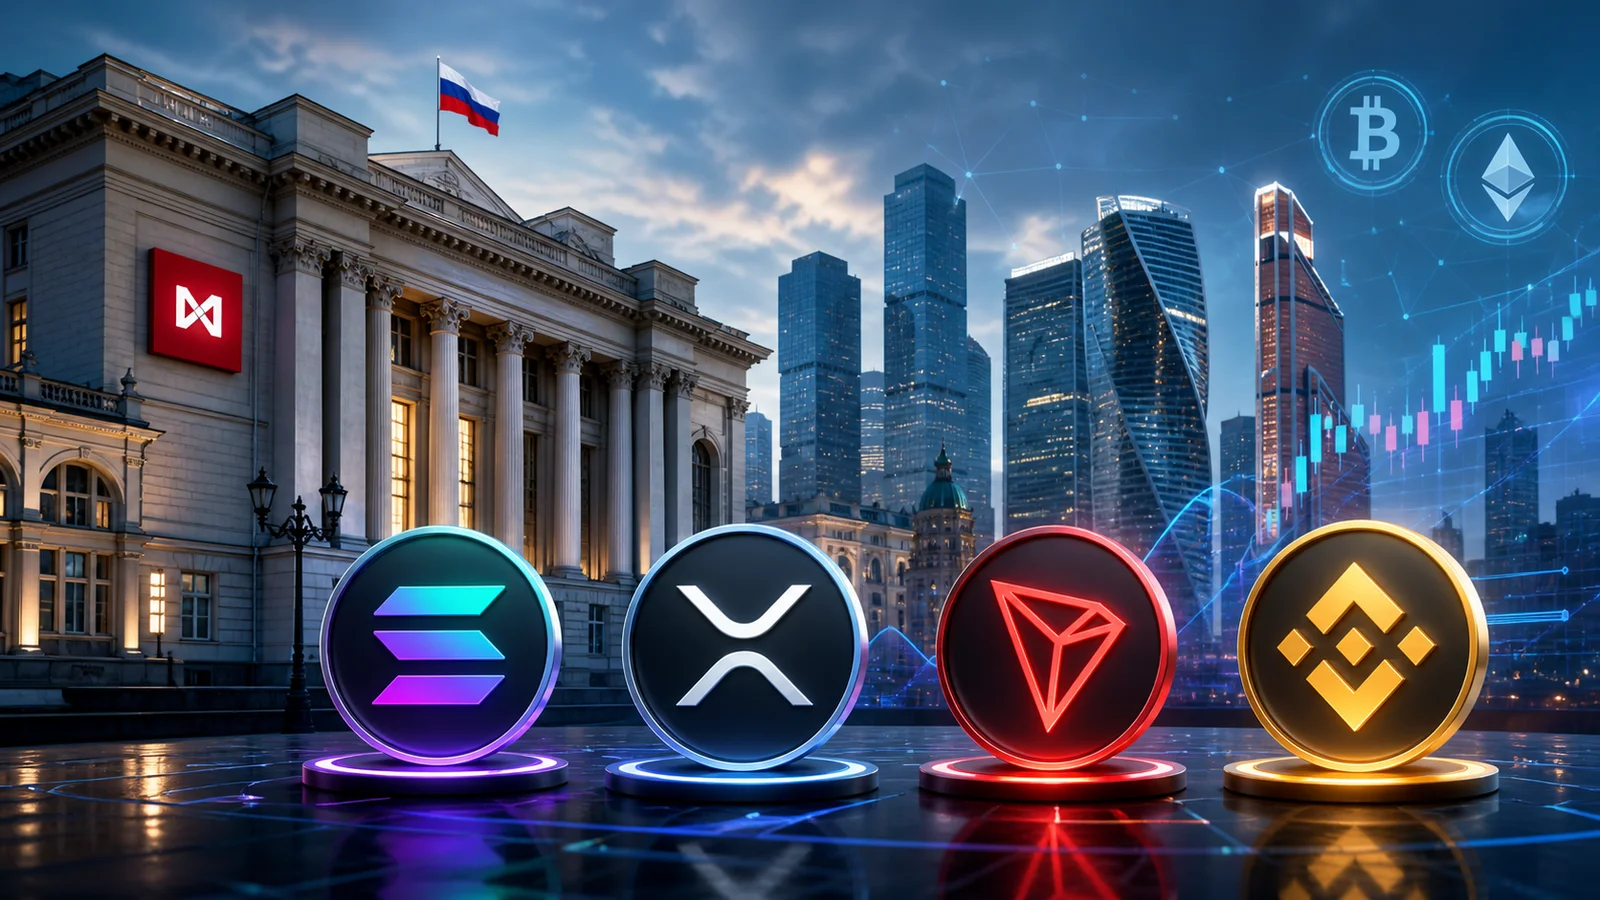
Moscow Stock Exchange Launches Index for 4 Altcoins
Institutional steps towards the cryptocurrency market are accelerating in Russia. The Moscow Stock Exchange (MOEX), the country's largest securities exchange, is preparing to launch new cryptocurrency indices for four major altcoins, following Bitcoin and Ethereum. According to information shared by the exchange, the new indices, which will track the prices of Solana, XRP, TRON, and BNB, will be launched on May 13th. The new indices will be tracked with the abbreviations MOEXSOL, MOEXXRP, MOEXTRX, and MOEXBNB. Thus, the Moscow Stock Exchange's range of cryptocurrency products will not be limited to Bitcoin and Ethereum alone. This step shows that Russia is beginning to approach crypto assets from a broader perspective. However, direct trading will not be offered. Investors will not be able to conduct spot transactions of these assets; they will only be able to monitor price movements through a regulated reference index. The new cryptocurrency indices of the Moscow Stock Exchange will be based on price data from global cryptocurrency exchanges. According to the announced structure, Binance data will have a 50% weighting in the indices. Bybit will contribute 20%, OKX 15%, and Bitget 15%. This distribution is considered important in terms of preventing pricing from being tied to a single platform and feeding from a wider range of liquidity sources. The frequency of index updates is also noteworthy. MOEX's crypto indices will now be updated every 15 seconds during trading sessions. Compared to the previous daily update model, this structure will allow prices to be tracked much more closely in response to instantaneous changes in the market. Given the rapid changes in price movements in the cryptocurrency market, this transition could create a more functional environment for investors and derivative product developers.No statement regarding spot marketsHowever, the Moscow Exchange's move does not currently mean an opening to the spot crypto market. The primary use of the new indices will be derivative products for professional investors. Under current rules, direct delivery of crypto assets is not possible in these products. In other words, investors will be able to access financial products tied only to price movements without physically or on-chain delivery of Solana, XRP, TRON, or BNB. MOEX had previously ventured into this area with derivative products linked to Bitcoin and Ethereum. Derivative instruments linked to products from global financial giants like BlackRock were also on the exchange's agenda. This shows that the interaction between traditional finance and the crypto market in Russia is being established in a more controlled and institutional way. Russia's approach to crypto has undergone a significant shift in recent years. The start of the war in Ukraine in 2022 and the tightening of Western sanctions significantly altered the country's view of digital assets. While cryptocurrencies were once seen as risky and instruments that needed to be restricted, they are now considered a more strategic area, particularly in foreign trade, payment systems, and financial infrastructure. The country is also working on a broader digital asset regulation. The new draft law, currently under review, is expected to be finalized by mid-2026. It is stated that this regulation could open the door for individual investors to access crypto-related products on a limited scale. According to some assessments, an annual participation limit of approximately $4,000 for retail investors may be considered. The Moscow Stock Exchange's plans are not limited to this. The exchange reportedly aims to increase the number of cryptocurrency indices to at least 10 assets. It is stated that cryptocurrencies like Dogecoin and Cardano could also be included in the index in the future.
Bitcoin Surpasses $81,000: New Signal Comes from Options
Bitcoin surged above $81,000 in the morning, reaching its highest level since late January. This move in the leading cryptocurrency comes amidst strong macroeconomic risks and a mixed outlook for other major crypto assets. Despite this, Bitcoin's break above the $80,000 threshold has begun to shift the balance, particularly in the options market, which is closely watched. BTC was around $79,000 at the end of US trading hours on Monday. On Tuesday, it climbed above $81,000, gaining over 5% on a weekly basis. Currently trading around $80,689, investors are focused on whether the $80,000 level can be sustained. Other major assets in the market have seen more limited and mixed movements. Ethereum held steady around $2,379, experiencing a slight daily decline, but its weekly performance remained around 4%. XRP fell 0.03% to $1.40, while Solana similarly lost value, dropping to $84. BNB remained flat at $626.Geopolitical risks persist, Bitcoin overcomes pressure for nowWhile Bitcoin is rising, tensions between the US and Iran continue. Brent oil rose sharply on Monday following the controversial missile claim regarding Iran. Although it later retreated partially, it remained around $113. WTI oil traded near $104. This high level of energy prices continues to put pressure on markets in terms of inflation and global risk appetite.Developments in the region are also increasing uncertainty. It was reported that the US destroyers Truxtun and Mason passed through the Strait of Hormuz, escorting two US-flagged ships. While the US Central Command evaluated this passage in the context of "coordinated threats," the airstrike on a VTTI oil terminal in Fujairah kept concerns alive in the energy markets. US President Donald Trump's statement that the war could last two to three more weeks also indicated a weakening of the previously announced four-week ceasefire.Despite this, Bitcoin's reaction to these developments appears more resilient compared to previous periods. The macro picture has not significantly improved, but the pressure of geopolitical issues on Bitcoin remains limited for now.Option tables were waiting for a break above $80,000A significant part of the recent movement in Bitcoin is seen as linked to positioning in the options market. Bitcoin volatility has been low in the last week. Since the price did not move quickly, investors did not heavily buy hedging options. When hedging demand arose, the market mostly turned to put options, i.e., hedging against a decline. This picture showed that the market was more concerned about a possible pullback than a rally. However, there was a different positioning under the surface. Some option tables started to set up low-cost upside bets. These transactions are usually done with "call ratio" strategies. In this strategy, the investor buys call options that will gain value if Bitcoin rises only slightly; To reduce costs, they are also selling other call options at higher levels. This allows the trade to be established at almost zero cost, providing an advantage in a scenario where Bitcoin rises gradually rather than experiencing a sharp surge. Two important headlines stand out for Bitcoin in the coming days. Strategy's earnings report, to be released on Tuesday, is being closely watched by the market due to the company's Bitcoin-focused structure. The US non-farm payrolls data, to be released on Friday, could also impact interest rate expectations and risk appetite.

What is Midnight (Night)?
What Is Midnight (NIGHT)?When privacy comes up in the crypto market, people often think of fully closed transactions that are difficult to track. Midnight does not fit neatly into that mold. The project approaches privacy from a more practical angle: the sensitive data of a user, institution, or application should be protected; however, specific information should still be shareable for audit or compliance purposes when needed.Midnight (NIGHT) is a data protection-focused Layer-1 blockchain network that uses zero-knowledge technology. According to Input Output, Midnight is positioned as a network designed to protect personal data and support digital freedom. The project aims to create room for institutions to build regulation-friendly, privacy-preserving applications through its “rational privacy” approach, which means privacy that works according to context.This is why reading Midnight simply as a “privacy coin” would be incomplete. NIGHT token is the network’s visible and transferable native asset, while DUST offers a non-transferable resource model used to run transactions. This structure is one of the project’s most distinctive features. Midnight aims to bring privacy and compliance to the same table while making transaction costs more predictable.Midnight’s Definition and OriginsMidnight focuses on one of blockchain’s most fundamental problems: everything being visible to everyone. On networks such as Bitcoin and Ethereum, transparency has provided a major advantage in terms of trust. However, that same transparency can become a serious barrier in areas such as institutional finance, identity verification, health data, commercial agreements, and RWA.It is not easy for a company to move payment flows, customer information, supply chain details, or balance sheet activity into an environment where everyone can see them. The same also applies to individual users. On a blockchain, a trail that starts with a wallet address can eventually reveal a person’s transaction habits, asset distribution, and interactions with others.Midnight brings forward the idea of “programmable privacy” at this point. The network allows the truth of a piece of information to be proven through zero-knowledge proofs, without requiring the information itself to be made public. A user can prove that they meet a certain condition, while a developer can embed that verification into an application. In Midnight’s official statements, this structure is described as an architecture that allows developers to decide when and how privacy should be applied at both the application and transaction layers.Behind the project are Midnight Foundation and Shielded Technologies. Shielded Technologies is a technology company that spun out of Input Output and is positioned as one of the key technology partners of Midnight Network. The company describes itself as one of the core developers, architects, and contributors to the Midnight protocol.Why Is Midnight Important?Midnight’s importance goes beyond the word “privacy.” The issue here is not only hiding transaction details. The real question is whether blockchain can work in harmony with real-world institutions, regulations, and data security expectations.So far, many institutions have closely followed blockchain and even carried out pilot projects. However, an infrastructure where every piece of data is visible to everyone can only be used in a limited way, especially in regulated sectors. For banks, payment companies, insurance firms, healthcare institutions, or asset managers, privacy is not just a nice-to-have feature; in many cases, it is essential for operations to continue.Midnight’s “rational privacy” approach comes into play here. The logic is simple: instead of hiding everything from everyone, the system makes it programmable who can see what, and to what extent. The user protects their data, the application runs transaction rules, and an auditor or regulator can see only the limited information that is necessary for their role.This approach separates Midnight from classic privacy coin models. While projects such as Monero or Zcash are more commonly known for value transfer and transaction privacy, Midnight targets a broader application layer. Identity, compliance checks, collateral verification, RWA transactions, and institutional DeFi therefore sit at the center of the Midnight narrative.How Does Midnight Work?At the center of Midnight’s technical structure are zero-knowledge proofs. ZK technology allows one party to prove that a certain piece of information is true, without revealing the information itself. In practice, this is a cryptographic way of saying, “I meet this condition.”For example, imagine a user needs to prove that they are above a certain age, eligible to receive a service in a specific region, or able to meet a certain collateral ratio. Under normal conditions, verifying these details would require sharing an ID document, financial data, or personal information. In a Midnight-style structure, this information remains under the user’s control; what is sent to the network is not raw data, but a verification proof.In Midnight’s official mainnet announcement, this structure is described through “client-side proofs.” Sensitive data remains on the user’s device, a zero-knowledge proof is generated through a local proof server, and this proof is sent to the network for verification. As a result, identity, eligibility, credit, or compliance checks can be carried out without exposing the underlying data to the entire network.Another important part of the network is its dual-state ledger architecture. On Midnight’s own website, this model is explained as the interaction between public on-chain state and local private state through ZK proofs. This allows applications to have both a public layer that everyone can verify and a private data area that belongs to the user.On the developer side, this model is supported by a programming language called Compact. Compact is introduced as a TypeScript-based, statically typed domain-specific language. Its purpose is to allow developers to write privacy-focused smart contracts without needing to become experts in ZK cryptography. What Is NIGHT Token?NIGHT is the native and governance-focused token of Midnight Network. However, there is an important detail here: NIGHT is not a private token. According to Midnight’s official NIGHT page, NIGHT works as an “unshielded,” open, and transparent token. Transaction information can be viewed publicly.This is a deliberate choice. Midnight does not build privacy by turning value transfer into a completely dark environment. While NIGHT token works like the network’s capital and governance asset, the transaction execution side is handled through a separate resource called DUST.Users who hold NIGHT generate DUST. DUST is designed as a shielded and non-transferable resource used to pay transaction fees and run smart contracts on the Midnight network. In official documents, NIGHT is compared to a “solar panel,” while DUST is compared to “electricity.” NIGHT is held, DUST is generated over time, and network transactions are run using DUST.The goal of this model is not necessarily to fully separate transaction costs from token price volatility, but to make them more predictable. In the traditional gas model, a user directly spends the network’s native token to make a transaction. On Midnight, NIGHT is not spent; DUST works more like a renewable capacity that is generated over time.What Is DUST? Why Is It a Separate Resource?DUST is one of the most interesting parts of Midnight’s token economy. It is a non-transferable, shielded resource designed only for network usage. You cannot use DUST to pay someone, trade it, or settle debt. This makes Midnight’s privacy approach more controlled.In the official NIGHT explanation, DUST is described as non-transferable and as a resource that decays when unused. Because of this, DUST does not become a tool for anonymous value transfer; it is used only to run transactions.This distinction is especially important for institutional use. If a company wants users to interact with an application, it can hold NIGHT, generate DUST, and allocate that DUST to application usage. This means the end user may not need to buy a token or understand the gas model for every transaction.Midnight’s mainnet announcement also refers to this model through the example of “self-funding applications.” A developer or application owner can hold NIGHT and generate the DUST needed to cover users’ transaction costs. This can create a smoother experience for users who are not familiar with crypto.Midnight’s HistoryMidnight was followed for a long time as a privacy-focused project connected to the Cardano ecosystem. The year 2025 marked a period in which the project accelerated in terms of institutional structure, token economy, and community distribution. The rise of Midnight Foundation and Shielded Technologies showed that the project was moving toward a more organized ecosystem structure.The tokenomics whitepaper published in 2025 set the NIGHT token supply at 24 billion. The document states that NIGHT would be minted on Cardano, and once the Midnight mainnet opened, the NIGHT tokens on Cardano would work together with their counterparts on Midnight. The same document also states that NIGHT would exist in a multi-chain structure both as a Cardano Native Asset and as the native token of the Midnight network.The most discussed part of the token distribution was Glacier Drop. According to Midnight’s December 2025 guide, the first stage of Glacier Drop targeted self-custody users holding ADA, BTC, ETH, SOL, XRP, BNB, AVAX, and BAT. The snapshot date was June 11, 2025, while the participation period ran from August 5 to October 20, 2025. During this process, more than 3.5 billion NIGHT tokens were claimed by over 170,000 eligible wallet addresses.NIGHT token officially launched on Cardano on December 4, 2025. The tokens claimed by the community began entering circulation through the Glacier Drop thawing schedule starting on December 10, 2025. The tokens were not released all at once; a gradual unlocking model was preferred.The most critical recent development for the project happened on the mainnet side. Midnight Network announced on March 29, 2026, that the network had gone live. With the genesis block, state continuity and permanence on the network officially began.Midnight Mainnet and the Federated Node ModelThe launch of Midnight mainnet does not mean that the project has become fully permissionless and fully decentralized from day one. The network initially moves forward with a federated node operator model. Under this model, certain trusted operators run the network, with a gradual transition toward broader decentralization targeted over time.In Midnight’s February 2026 announcement, Google Cloud, Blockdaemon, AlphaTON Capital, and Shielded Technologies were listed among the federated node partners. It was stated that Google Cloud would contribute to network infrastructure and security, while its Mandiant unit would provide threat monitoring and incident response support.Worldpay and Bullish later also joined as federated node operators. On the Worldpay side, stablecoin payment infrastructure and compliant payment flows stood out. On the Bullish side, zero-knowledge-based proof of reserves work came into focus. Bullish’s goal is to provide proof of reserves while verifying solvency without exposing sensitive data such as wallet addresses, counterparties, or transaction history.Midnight’s Use CasesTo understand Midnight’s use cases, it is enough to ask one question: which data should not be public? Financial transactions, identity information, company agreements, collateral structures, customer records, health data, and private market transactions are among the main examples.One of the first use cases is private trading and liquidity management. On public blockchains, large orders, wallet movements, or strategy traces can be seen by everyone. This can create risks such as front-running, copy trading, and strategy exposure. Midnight aims to offer a structure where information such as order size, transaction timing, and strategy can be verified without becoming public. The official website lists private trading and liquidity formation among the main use cases.The second area is institutional lending and capital markets. In a lending protocol, collateral, leverage, portfolio distribution, or liquidation rules need to be verifiable. However, making this information public can be risky for institutions. Midnight aims to verify this information through cryptographic proofs instead of exposing the raw data.The third area is RWA tokenization. When real estate, private equity, structured products, or regulated assets are tokenized, ownership records alone are not enough. It also matters who can trade these assets, which rules apply in which region, and how eligibility checks and audit processes are handled. Midnight aims to offer selective disclosure and a programmable compliance layer for such transactions.The fourth area is identity and eligibility verification. A user may be able to prove that they meet a certain condition without having to share all personal documents every time they enter a platform. For example, accredited investor status, age verification, regional eligibility, or a KYC result can be verified without exposing the raw data.Monument Bank Example on the Institutional SideAmong Midnight’s recent developments, the Monument Bank partnership also stands out. According to an announcement published in March 2026, Monument is working with Midnight Foundation on the tokenization of retail deposits. This development shows that Midnight is trying to move beyond being a theoretical privacy infrastructure and enter concrete use cases on the banking side.This example matters because deposit tokenization is a highly sensitive area. User balances, account information, compliance checks, and banking regulations all come into play at the same time. Building such a structure on a fully open network is difficult from both user privacy and institutional security perspectives.Midnight’s claim becomes clearer here. Institutions may benefit from blockchain’s instant settlement, programmability, and digital asset infrastructure without having to expose customer data to the public. If this narrative succeeds, it would not be surprising to see Midnight become part of more pilot projects in RWA and institutional DeFi.NIGHT Token EconomyThe total supply of NIGHT token has been set at 24 billion. According to the tokenomics whitepaper, the total supply is minted on Cardano at the beginning of token distribution; the tokens are then divided into circulating and non-circulating categories. Tokens can enter circulation through the distribution process or block production rewards. The key point here is that NIGHT is not spent directly as transaction fuel. NIGHT generates DUST. DUST runs transactions. NIGHT is also expected to play a role in governance and network security.According to CoinGecko data, as of May 4, 2026, NIGHT is trading at around $0.03097; its market capitalization is around $514 million, and its circulating supply is around 16.6 billion NIGHT. The same data page lists the total and maximum supply as 24 billion NIGHT. Since this type of market data changes quickly, it should always be updated before publication.The fact that NIGHT is listed on exchanges provides an advantage in terms of liquidity. CoinGecko lists trading pairs for NIGHT on centralized exchanges such as OKX, Gate, Binance, KuCoin, Kraken, Bybit, and HTX. However, listings, price performance, or trading volume alone do not guarantee the project’s long-term success. Midnight’s real test will be developer interest and real use cases.Midnight’s FutureMidnight’s roadmap for 2026 is quite busy. According to the January 2026 State of the Network update, the project’s focus in 2026 shifted from token distribution to mainnet, scaling, and cross-chain hybridization. In the Hilo phase, NIGHT token was expected to go live on Cardano mainnet, while in the Kūkolu phase, the goal was to move toward a stable federated mainnet and the first production applications.With the mainnet now live, the project is currently moving forward mainly through application deployment, node operators, institutional use, and developer tools. The next critical point will be the emergence of dApps that are actually used on Midnight. Privacy technology can create broader value only when it is carried into daily use.In the Mōhalu and later phases, broader network participation, validator diversity, staking rewards, and a DUST capacity market are expected to come into focus. These areas will show more clearly how NIGHT token works not only as a market asset, but also as part of the network economy.In the long term, Midnight’s main claim is to become a privacy infrastructure that works with different chains. If this happens, Midnight would not be limited to its own network; it could also provide a privacy layer for applications in other ecosystems. This is a major goal, and it will not be easy to implement. Still, the project’s Cardano connection, institutional partners, and ZK-focused architecture make it one of the projects worth following.Frequently Asked Questions (FAQ)Below, we answered some of the questions you may have about Midnight:What is Midnight (NIGHT)?: Midnight is a Layer-1 blockchain network focused on data privacy and selective disclosure, powered by zero-knowledge technology. Its goal is to allow users and institutions to build blockchain applications without exposing sensitive data to everyone.What is NIGHT token used for?: NIGHT is the open and transferable native token of Midnight Network. It is associated with network security, governance, and DUST generation. NIGHT is not spent directly as transaction fuel; it generates DUST.What is DUST?: DUST is a shielded and non-transferable resource model used to run transactions on the Midnight network. Users who hold NIGHT generate DUST over time. DUST cannot be sent to other users as a payment tool.Is Midnight a privacy coin?: Midnight is not a classic privacy coin. NIGHT token is open and transparent. The project’s privacy approach is based on providing programmable privacy for applications and data.Which ecosystem is Midnight connected to?: Midnight stands out as a project born around Cardano and Input Output. Shielded Technologies, a technology company that spun out of Input Output, is one of Midnight’s key technology partners.Has Midnight mainnet launched?: Yes. Midnight Network announced that its mainnet went live in March 2026. This marked the beginning of real on-chain activity with the production of the network’s genesis block.What is Midnight’s biggest advantage?: Its strongest advantage is that it combines privacy with a regulation-friendly and developer-friendly model. Selective disclosure, zero-knowledge proofs, and the NIGHT-DUST model are the core parts of this structure.Is Midnight risky?: As with every new blockchain project, Midnight carries technical, regulatory, competitive, and adoption-related risks. Since the network is still in a new mainnet phase, its long-term performance will become clearer through application usage.To explore new projects, token models, and current developments in the crypto ecosystem more closely, you can follow the JR Kripto Guide series.

Critical Week in the Crypto Market: Data, Fed, and Earnings Reports Coming Out Simultaneously
The cryptocurrency market is entering the first week of May with a busy agenda. The calm price movements seen in Bitcoin and altcoins in recent days do not mean that investors' risk appetite has fully recovered. Macroeconomic data to be released this week, the earnings reports of major crypto companies, and messages from the Fed are among the topics that could lead to a change in market direction in the short term. According to CoinDesk's weekly market calendar, investors face three main tests: US employment data, crypto company earnings reports, and discussions regarding the independence of the Fed.The most critical macroeconomic topic of the week will be the US employment market. The non-farm payrolls data for April is being watched as one of the first significant readings to be released after the federal government shutdown in 2025. Data that falls below expectations could open up room for the Fed to start cutting interest rates sooner. Conversely, a strong employment picture could postpone expectations of interest rate cuts, putting pressure on risky assets.Company earnings reports will test Bitcoin's treasury strategyThe second important agenda item of the week will be the first-quarter earnings reports of crypto companies. Companies closely watched by the industry, such as Strategy, Coinbase, MARA, CleanSpark, Hut 8, and Core Scientific, will announce their financial results this week. These balance sheets are important not only in terms of revenue and profit figures, but also in showing how companies manage their Bitcoin positions. Sales data, especially among Bitcoin miners, is noteworthy. Riot sold 3,778 BTC in the last quarter at an average price of $76,626. MARA sold 15,133 BTC during the same period. These figures show that miners are being more selective in their balance sheet management and are able to convert their Bitcoin reserves to cash according to market conditions. On the Strategy side, investors' focus has shifted from classic software revenues to the company's Bitcoin financing model. The company has long been evaluated based on its Bitcoin purchases and capital increase strategy. Therefore, the balance sheet announcement will be closely watched in terms of the sustainability of institutional Bitcoin demand.The third headline of the week will be the FedSan Francisco Fed President Mary Daly and Chicago Fed President Austan Goolsbee will speak at a conference on central bank independence on Friday. These speeches are gaining further significance as Jerome Powell's term as Fed chair ends on May 15, 2026. Although his term ends, Powell reportedly plans to remain a member of the Fed Board of Governors.Political pressure on the Fed is making market expectations regarding the interest rate path more fragile. Investors are trying to price in not only economic data but also political developments that could affect the Fed's decision-making independence. This creates a situation where low volatility in risky assets like cryptocurrencies can suddenly be disrupted.Echo Base partner Jennifer Hanny also pointed out this fragile market outlook. According to Hanny, investor positioning is not intense and volatility remains low. However, this creates an asymmetrical environment where seemingly calm markets can quickly repricing with any catalyst. DAI, ZKsync Lite, and lock-ups are on the token agendaProject-based developments are also prominent on the crypto calendar. Coinbase is halting DAI transactions on May 4th and beginning the process of converting remaining balances to USDS. It is reported that the exchange will end its DAI trading support on May 4, 2026, and some sending and receiving operations will be temporarily suspended between May 4-6.The complete decommissioning of ZKsync Lite is also expected on the same day. According to the ZKsync team, this process means the planned decommissioning of the old network and does not affect ZKsync Era and other ZK Stack systems.On the token lock-up side, Ethena and Hyperliquid stand out. Ethena is expected to unlock approximately $17.34 million worth of ENA, equivalent to 2.12% of its circulating supply, on May 5th. On the Hyperliquid side, a HYPE lock release, worth approximately $17.5 million, representing 0.18% of the circulating supply, will be observed on May 6th. Looking at the overall picture, the crypto market is preparing for a week where it will react not to a single development, but to several different headlines simultaneously. US employment data will shape interest rate expectations, corporate earnings will reveal institutional Bitcoin strategies, and Fed speeches will determine the market's risk perception. Therefore, the current calm appearance may be misleading; increased volatility in the second half of the week would not be surprising.

Bitcoin Reaches $80,000: What's Happening in the Market?
Although the cryptocurrency market started the new week with strong momentum, recent price movements show that Bitcoin is trying to stabilize at critical levels. The leading cryptocurrency briefly rose above $80,000 before retreating and trading around the $79,000 mark. According to current data, Bitcoin is priced around $78,900 and has seen limited gains in the last 24 hours. While the highest level reached during the day was near the $80,500 range, it's noteworthy that the price retreated due to selling pressure from this region. Ethereum continues to hold above $2,300, while XRP is experiencing a more limited rise. Analysts note that Bitcoin breaking above the $80,000 level is technically significant, but this area is acting as strong resistance. The short-term pullback reveals that the market is struggling to permanently break this level. Despite this, the overall outlook doesn't suggest that buyers have completely weakened; on the contrary, the price's effort to hold at higher levels is noteworthy. Geopolitical Developments Affect Risk AppetiteMarket price movements are driven not only by technical dynamics but also by macroeconomic and geopolitical developments. The ongoing tension between the US and Iran directly affects investors' risk perception.US President Donald Trump's announcement of "Project Freedom" for ships stranded in the Strait of Hormuz created a short-lived optimism in the markets. However, statements from Iran indicated that such an intervention could be considered a violation of the ceasefire. These reciprocal statements show that uncertainty continues in the markets.The rise in energy prices also supports this picture. High oil prices keep inflation expectations alive, leading investors to act more cautiously. This situation can sometimes cause increased selling pressure in the crypto market. ETF Demand Continues, Derivatives Markets GrowOne of the important factors supporting the general upward trend in Bitcoin continues to be institutional investor interest. Inflows into spot Bitcoin ETFs in the US continued for the fifth consecutive week. The net inflow of approximately $154 million recorded last week indicates continued long-term confidence in the market. In addition, derivatives markets are quite active. There has been a remarkable increase in Bitcoin open positions in recent weeks. This suggests that leveraged trading has increased in the market and that some of the rise is supported by this dynamic. However, another noteworthy data point is the increase in Bitcoin supply on exchanges. The rise in the amount of BTC sent to exchanges in recent days reveals that some investors are selling as the price rises. This indicates that upward movements may remain limited in the short term.Short-term sideways trend is prominentThe current outlook suggests that Bitcoin has entered a consolidation phase after a strong rise. The inability to maintain stability above the $80,000 level indicates that profit-taking has begun in the market.Analysts state that the $78,000-$80,000 range has become an important band in the short term. A break above this range could trigger a new wave of upward movement. However, downward breaks could lead to pullbacks towards the $77,000 level. Upcoming macroeconomic data and geopolitical developments from the US will be decisive in determining the direction of the crypto market. In particular, labor market data and global risk appetite will continue to influence Bitcoin's short-term price movements.

Binance Announces New Listing: Three Contracts Coming Soon
Binance, one of the largest players in the crypto derivatives market, continues to expand its product portfolio. The exchange announced it will launch three new USDⓈ-margin perpetual futures contracts to increase user trading options and diversify the experience on its platform. Accordingly, AMDUSDT, QCOMUSDT, and USARUSDT pairs will begin trading on Binance Futures on May 6, 2026. The AMDUSDT contract will be the first to be offered at 16:30 UTC (13:30 UTC), followed by QCOMUSDT and USARUSDT contracts at five-minute intervals. All three contracts will offer investors leverage up to 10x. This will allow users to access price movements of large-scale company stocks traded in traditional markets through crypto derivative instruments. One notable aspect of these newly listed contracts is their direct tracking of stock prices. The AMDUSDT contract will be based on the performance of Advanced Micro Devices (AMD), the QCOMUSDT contract on Qualcomm (QCOM), and the USARUSDT contract on USA Rare Earth (USAR) stocks. Looking at the technical details of the contracts, the minimum transaction amount is set at 0.01 units. The minimum transaction size is kept at 5 USDT. The price increment (tick size) is fixed at 0.01 in all contracts. The funding rate is limited to +2% and -2%, and funding payments will be made every eight hours. Furthermore, the interest rate applied to these contracts is 0%.Binance stated that these contracts will be exempt from standard rules regarding funding intervals. While under normal circumstances, if the funding rate exceeds certain limits, the payment interval can be reduced to one hour per eight hours, this change will not be made in these new products.Traditional markets now in cryptoBinance's move shows us that crypto derivatives markets are beginning to be more than limited to digital assets. The inclusion of major players in the semiconductor sector, such as AMD and Qualcomm, as well as firms operating in the rare earth elements field like USA Rare Earth, facilitates investors' access to different sectors through a single platform. Furthermore, thanks to Multi-Assets Mode support, users can use not only USDT but also other assets as collateral in these contracts under certain conditions. For example, an investor with a Bitcoin balance can use this balance as collateral to open trades in the relevant contracts. This feature allows for the implementation of more flexible strategies in portfolio management. On the other hand, Binance emphasized that it may make changes to contract features depending on market conditions. Elements such as funding fees, maximum leverage ratios, or collateral requirements may be updated over time. This requires investors to closely monitor contract details before trading.
BNB Commentary and Price Analysis - May 2, 2026
BNB Technical AnalysisOn the BNB side, the key development shaping the narrative has been the latest technical upgrade aimed at increasing network speed. With this change, block production time has been reduced and transaction capacity has been improved. This step, which aims to ease congestion during high-activity periods, stands out as a direct improvement to user experience. At the same time, the continued activity in ecosystem applications and DeFi is also notable. There is a structure that is strengthening technically while maintaining usage, and how this balance reflects on price has become more critical. Trending Theme From a technical perspective, price is trying to hold above the ascending trendline after a recent touch. The movement is currently centered around the 560–590 range.As long as this range holds, the structure remains intact. In this scenario, price is expected to move toward 630, then 700, and eventually the 820 region.However, a close below 560 changes the outlook. In that case, a pullback toward the 530–500 range becomes likely.In summary:Holding above 560–590 = upside potential (820 target)Below 560 = weakening structure and pullbackThese analyses do not provide investment advice and focus on support and resistance levels that are considered to offer short- and medium-term trading opportunities depending on market conditions. However, responsibility for execution and risk management lies entirely with the user. In addition, the use of stop loss is strongly recommended.

AVAX Commentary and Price Analysis - May 1, 2026
AVAX Technical OutlookOn the Avalanche side, the most notable recent development has been the acceleration of steps toward institutional investment products. In particular, the launch of AVAX ETF products offering staking yield and new applications indicate growing institutional interest. Through these products, investors can gain exposure not only to price movement but also to the network’s yield model. This evolving landscape shows that AVAX is being repositioned not just as infrastructure but also as an investment asset. The key factor will be how sustainable this institutional interest is. Narrowing Triangle Structure From a technical perspective, AVAX has been moving within a symmetrical triangle for some time. There is descending resistance on the upper side and rising support below. This means price is preparing to make a decision within the 8–10 dollar range.In the short term, the 8.90 – 9.00 zone is the key support that needs to hold. As long as price stays above this level, upward attempts can continue. On the upside, the 9.60 – 9.70 range is the level to watch for a breakout.If this area is broken, the first target becomes 10.20 – 10.40, followed by a move toward the 11 dollar region.On the downside, a move below 8.90 requires caution. Losing this level would trigger a downward resolution of the triangle, potentially pulling price toward 8.40, then 7.90.In short, AVAX is at a decision point. A move above 9.60 strengthens the upside scenario, while a drop below 8.90 weakens the structure.These analyses do not provide investment advice and focus on support and resistance levels that are considered to offer short- and medium-term trading opportunities depending on market conditions. However, responsibility for execution and risk management lies entirely with the user. In addition, the use of stop loss is strongly recommended.

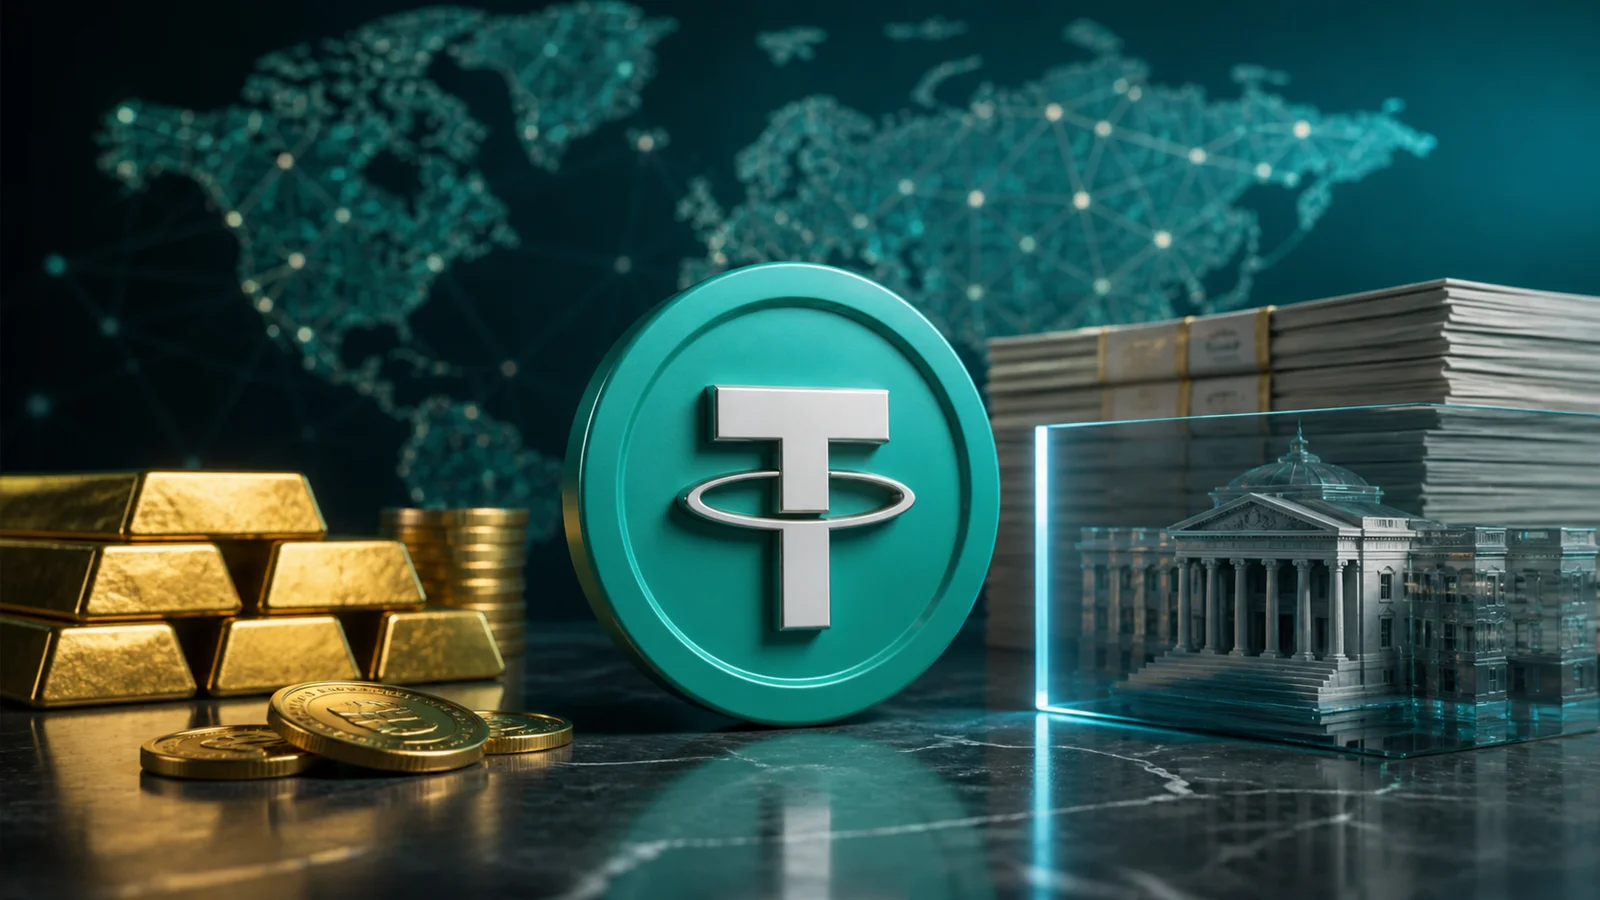
Tether Reports $1 Billion in Profit: Reserves Reach Record Levels
Tether, one of the world's largest stablecoin issuers, has released its financial results for the first quarter of 2026. According to the company's report, Tether achieved a net profit of $1.04 billion in the first three months of the year. This performance significantly increased the company's excess reserves, bringing them to their highest level ever at $8.23 billion.The verification report prepared by the independent auditing firm BDO reveals Tether's financial strength, while also emphasizing that this data only provides a "snapshot" as of March 31st. The information in the report does not constitute a full audit; however, it provides important clues about the company's reserve structure and profitability. US Treasury bonds dominantWhen examining Tether's reserve composition, a strong orientation towards low-maturity and high-liquidity instruments is noticeable. Approximately $141 billion of the company's assets are held in US Treasury bonds. This size places Tether among the top 20 institutions globally investing the most in US Treasury bonds. Its position in the same league as countries like Saudi Arabia and South Korea shows the company's growing influence within the financial system.This structure also provides a significant example of how demand for the US dollar is driven through crypto assets. Capital entering the digital market through stablecoins continues to be largely invested in traditional financial instruments.Diversification with Gold and BitcoinTether does not limit its reserves solely to bonds. The company's portfolio also includes approximately $20 billion worth of gold and around $7 billion worth of Bitcoin. This diversification strategy aims to increase resilience against different market conditions.In a statement from the company, it was stated that this approach aims to balance liquidity, resilience, and macroeconomic risks. The inclusion of assets that can maintain their value, especially during stressful market periods, indicates a cautious strategy in reserve management.Total assets exceed $191 billionAs of March 31, Tether's total assets exceeded $191.7 billion, while its liabilities stood at $183.5 billion. Almost all of these liabilities represent USDT tokens in circulation. The difference of approximately $8.2 billion constitutes the company's excess reserves.Tether also stated that private investments conducted through its investment arm are separate from the reserves supporting USDT. These investments are financed with the company's profits and excess capital and are completely isolated from the reserve structure.While the amount of USDT in circulation remained generally flat in the first quarter, demand increased again at the start of the second quarter. Company CEO Paolo Ardoino announced that the circulating supply had increased by more than 5 billion USDT as of April. Ardoino stated that the company's main priority is to ensure that USDT functions smoothly in all market conditions. This approach is directly related to the fact that stablecoins are seen as a safe haven, especially during volatile periods.
Binance Alpha Delists 24 Altcoins: Details
Delisting and delisting decisions in the cryptocurrency market are among the significant developments that directly affect investor behavior. In this context, Binance has shared a new update for some assets on its Alpha platform. According to the announcement, a total of 24 tokens are being removed from the featured list on the platform due to not meeting certain criteria. According to the announcement published by the exchange, this change took effect on April 30, 2026, at 12:30 PM Turkish time. The decision was made as a result of Binance's regular review processes. The company states that it considers various criteria such as project development, liquidity, and user security in such evaluations. Among the delisted assets are projects such as REX (Revox), XO (Xociety Token), TANSSI, DARKSTAR, YALA, RCADE, RDAC, SKATE, OVL, and SLAY. In addition, tokens on two different networks under the name Ghibli (Solana and BNB Chain versions), DePHY Network (PHY), Velora (VLR), SavannaSurvival (SVSA), and Whitebridge Network (WBAI) are among the projects removed. The list also includes smaller-scale projects such as EDGEN, FAIR3, MOMOFUN (MM), BUBB, AICELL, XLAB, and SIGHT. Transaction and withdrawal options remainThis decision by Binance does not mean that these tokens are completely inaccessible. The platform emphasizes that users can continue to trade these assets to a certain extent. Accordingly, investors can sell or withdraw the relevant tokens to their wallets via Binance Alpha and Binance Wallet. Users can use the "Market" tab in Binance Wallet or the "Instant" transaction option in the Alpha platform for sales transactions. In addition, the "Withdraw" option in the Alpha tab remains active for withdrawals of assets. This allows investors to close their positions in a controlled manner.Risk and volatility warning stands outBinance has once again reminded users that tokens on its Alpha platform may generally carry higher risks. The company states that sudden price fluctuations may be seen in these assets and that investors should conduct thorough research before trading.It is known that market movements can be more volatile, especially in early-stage or low-liquidity projects. Therefore, Binance recommends that users pay attention to their risk management strategies and only invest in projects they understand. The emphasis on "Do your own research" (DYOR) continues to be one of the key messages highlighted in such announcements.Platform standards and regular review processBinance's Alpha platform generally aims to introduce users to newer and development-stage projects. However, this does not mean that all assets on the platform will be permanently available. The company can remove projects that do not meet its standards from the list through periodic reviews.

Three South Korean Exchanges are Delisting a Hacked Altcoin
The long-awaited decision regarding DRIFT, the native token of Drift Protocol, which came to the forefront of discussions following the large-scale attack in April, has arrived. Upbit, Bithumb, and Coinone, the three largest cryptocurrency exchanges in South Korea, announced they will delist the DRIFT token after a joint review. The decision is driven by both security concerns and uncertainties surrounding the project's future. According to the exchanges' statement, trading for DRIFT will cease on June 1, 2026, at 4:00 PM. The last date users can withdraw their assets from the platform is July 1, 2026. After this date, withdrawal support for DRIFT will be completely terminated.The decision was made after a joint review process by platforms that are members of DAXA (Digital Asset eXchange Alliance), which operates in South Korea and sets common standards for crypto assets. The DRIFT token had previously been placed on a "watchlist." During this process, additional explanations and technical details were requested from the project. However, in the final evaluation, it was stated that the information provided by the project team was insufficient to address investor concerns. In addition, topics such as the project's progress, level of transparency, and risk management were examined in detail. In light of all these criteria, it was concluded that DRIFT does not meet the current listing standards.$285 million attack undermined trustThe pressure on DRIFT stems from a major attack that occurred at the beginning of April. Drift Protocol, one of the largest perpetual futures trading platforms in the Solana ecosystem, suffered a loss of approximately $285 million on April 1st.The attack was carried out using social engineering methods rather than a classic smart contract vulnerability. It was revealed that the attackers manipulated the platform's Security Council for weeks by posing as a legitimate quantum trading firm and drained funds through pre-signed transactions. The fact that the entire process was completed in just 12 minutes made the scale of the event even more striking. Chain reaction in DeFi: $606 million lostJust 17 days after the drift attack, KelpDAO's rsETH bridge was also targeted. This attack resulted in the loss of approximately $292 million in assets. Thus, a total of $606 million was withdrawn from the DeFi ecosystem in the first 18 days of April.In the second attack, it was stated that the attackers manipulated the LayerZero infrastructure by creating fake cross-chain messages and enabled the release of reserves. Then, the use of the stolen assets as collateral on Aave triggered panic selling in the market. As a result of these developments, the total value locked (TVL) in DeFi decreased by $13 billion in just 48 hours. Data shows that for every $1 stolen, users withdrew approximately $20 from the system. This indicates that the loss of trust went far beyond the technical damage.
Binance Adds 5 Altcoins to its Watchlist: Prices Drop
Binance announced that, following recent assessments, it has added several altcoins to its "Monitoring Tag" list, meaning these projects will be monitored more closely. Following the announcement, the price of these altcoins experienced a decline. Binance added 5 altcoins to its watchlistBinance reassessed the risk level for some altcoins and added five more tokens to its "Monitoring Tag" list as of April 30, 2026. NFPrompt (NFP), Nomina (NOM), Marlin (POND), QuickSwap (QUICK), and Viction (VIC) are now among the projects that will be monitored more closely. This decision follows recent reviews of both market performance and project fundamentals.The Monitoring Tag is a system Binance uses to flag assets with high volatility and relative risk. Tokens with this tag are regularly reviewed and risk being delisted from the platform if they fail to meet certain criteria. Therefore, for projects included in this list, the process serves as a warning and is considered the first step towards a potential delisting. Immediately following the decision, significant price pullbacks were observed. NFP lost approximately 20.18% of its value in the last 24 hours, falling to $0.0127. Similarly, NOM dropped 19.57% to around $0.00279. POND saw a 17.64% loss, stabilizing at $0.00208. QUICK experienced a more limited decline of 3.29%, while VIC fell 18.99% to $0.045. This shows that investors reacted quickly to the risk signal. Binance's evaluation process highlights multiple criteria. The commitment of project teams, the intensity and quality of development activities, trading volume, and liquidity levels are among the primary factors. In addition, network security, the stability of smart contracts, the communication of teams with the public, and the platform's responses to information requests are also included in the scope of the review. Findings of unethical behavior or suspicion of negligence are considered a direct negative factor.There are also additional requirements on the user side for tokens under the Monitoring Tag. Users who want to trade these assets must complete a risk awareness test every 90 days. They are also required to re-approve Binance's terms of use. With these steps, the platform aims to make investors act more consciously when trading high-risk assets.On the other hand, this labeling does not mean that the tokens in question are removed from all services. Many services, especially spot and margin trading, remain accessible. However, the pressure on market perception generally has a negative impact on prices in the short term. Recent price movements confirm this trend.
TON Commentary and Price Analysis - April 29, 2026
TON/USDT Technical AnalysisOn TON, price continues to move within a falling wedge. At the current stage, price has directly touched the upper band. This means we are no longer in a waiting phase but in a decision zone.On the daily chart, the 1.35 – 1.38 range acts as both horizontal resistance and overlaps with the trendline. That’s why a close above this area is important. If price holds above it, the structure would be considered a breakout to the upside.In this scenario, the first target becomes the 1.48 – 1.58 range. Then 1.73 and levels above 1.80 come into play.On the downside, the 1.30 – 1.28 range is the level that needs to hold in the short term. If this area is lost, price may fall back into the formation and a pullback toward the 1.26 – 1.20 range can be seen.In short, price is at a critical resistance.If it holds above → upward movement acceleratesIf rejected → the current bearish structure continues Trending Theme On the TON side, a notable development has been the significant reduction in transaction fees. With the new model, costs have been reduced by approximately 6x and the fee structure has been stabilized. This aims to allow users to maintain the same transaction cost even as network activity increases. Additionally, making some transactions completely free is also part of future plans. This approach shows that TON is directly focused on increasing user count and transaction volume; how much this move will be adopted will be the key factor going forward.These analyses do not provide investment advice and focus on support and resistance levels that are considered to offer short- and medium-term trading opportunities depending on market conditions. However, responsibility for execution and risk management lies entirely with the user. In addition, the use of stop loss is strongly recommended.

Standard Chartered Releases Report on the $76 Billion Crypto Sector
According to TradingView data, the decentralized finance (DeFi) sector, with a total value of $76 billion, underwent a severe stress test following the KelpDAO attack on April 18th. However, according to investment bank Standard Chartered, this shock does not mean the system has completely broken. In its latest report, the bank assessed DeFi as having "bent but not broken," suggesting that post-crisis recovery could accelerate structural transformation in the sector. At the heart of the attack was the theft of approximately $292 million worth of rsETH via a supposedly fraudulent LayerZero message. The use of the stolen assets as collateral put significant pressure on Aave, one of the largest DeFi lending protocols. The attackers' use of these assets to borrow money triggered a loss of confidence in the system and quickly led to a liquidity crisis similar to a "bank run." According to Standard Chartered data, total deposits on the Aave platform decreased by approximately 38 percent, resulting in a drop of $17 billion. The decline in active loans reached 31 percent, resulting in a contraction of approximately $5.5 billion. This picture once again revealed how interconnected the DeFi ecosystem is, showing that a single weakness can have widespread consequences.$300 million intervention eased the marketTo prevent the crisis from deepening, Aave and leading players in the sector quickly stepped in. A coalition formed under the leadership of Aave founder Stani Kulechov announced a support package of over $300 million to stabilize the system. Following this intervention, a normalization of interest rates was observed, and liquidity conditions gradually began to recover with deposits returning to the platform. This solidarity is not just a short-term rescue operation. In fact, according to Standard Chartered, this process shows that DeFi has evolved into an "antifragile" structure, meaning it can emerge stronger from crises. The sector's ability to act in a coordinated manner in the face of the shock is considered an important signal in terms of long-term confidence. On the other hand, this event has once again underlined the fundamental risks in DeFi. Smart contract errors, phishing attacks, and especially cross-chain bridges create critical vulnerabilities in systems where large amounts of capital are locked. Complex architectures broaden the attack surface, and even a single vulnerability can lead to billions of dollars in losses. Structural transformation is gaining momentumAccording to the report, the crisis has accelerated some technical improvements that were already on the agenda. Initiatives such as Aave's V4 update and the planned Ethereum Economic Zone (EEZ) aim to reduce reliance on cross-chain bridges in particular. These points also stand out as common vulnerabilities in major attacks that have occurred in the past. However, Standard Chartered emphasizes that there is no change in the long-term growth narrative of DeFi. The bank maintains its estimate that the market capitalization of tokenized real-world assets (RWA) could reach $2 trillion by 2028. This market, projected to be around $35 billion in October 2025, is expected to continue growing, particularly driven by stablecoin liquidity and DeFi lending mechanisms. However, the risks have not completely disappeared. JPMorgan similarly notes that hacking incidents and limited capital growth in DeFi continue to dampen institutional investor appetite. The KelpDAO attack is estimated to have had a market-wide impact of approximately $20 billion.

Binance Delivers 7 Spot Trading Pairs
The cryptocurrency exchange Binance has announced a new delisting decision for certain currency pairs traded on the spot market. According to the official announcement, trading on these pairs will cease as of May 1, 2026. The decision follows periodic reviews aimed at protecting users and maintaining high market quality on the platform. The assets included in the delisted pairs represent projects with diverse use cases within the crypto ecosystem. For example, Band Protocol (BAND) stands out as an oracle network providing data for blockchain, while Basic Attention Token (BAT) focuses on a user reward model in digital advertising. NEO offers an infrastructure built on smart contracts and digital assets; Oasis Network's token ROSE aims to develop solutions for data privacy and scalability issues. Theta Fuel (TFUEL) is used for transaction fees within the video streaming-focused Theta Network ecosystem. Other assets, BREV and SOLV, are noteworthy projects with relatively low trading volumes and more niche use cases. According to the announcement, the spot trading pairs to be removed include BAND/BTC, BAT/BTC, BREV/BNB, NEO/BTC, ROSE/BTC, SOLV/BNB, and TFUEL/BTC. Trading for these pairs will be completely terminated as of May 1, 2026, at 06:00 UTC. Binance states that it considers multiple factors such as liquidity levels, trading volume, and overall market health when making such decisions. The exchange's statement specifically emphasizes that pairs with low trading volume can negatively impact the user experience. Increased price volatility and widening spreads in markets with low liquidity can create a riskier trading environment for investors. Therefore, Binance periodically reviews all spot trading pairs and removes them from the platform when deemed necessary. Other pairs remain in useOn the other hand, this decision does not mean that the tokens in question have been completely removed from the platform. Users will be able to continue buying and selling these assets through other pairs that remain traded on the Binance Spot market. For example, even if a token's BTC pairing is removed, trading pairs matched with USDT or another stablecoin can remain active.Another notable point in the announcement was the Spot Trading Bot services. Binance announced that spot trading bots operating based on the trading pairs to be removed will also be disabled on the same date and time. In this context, users are advised to update their bots in advance or disable them completely to prevent potential losses. Otherwise, the cessation of automated trading may lead to unexpected losses.In large exchanges with thousands of trading pairs, it is common for low-volume pairs to become obsolete over time. Therefore, delisting decisions are often considered technical adjustments aimed at increasing market efficiency.