SOL Technical Analysis
As we all know from the news, Solana is now getting strong attention from institutional investors. For instance, Galaxy Digital has reportedly accumulated nearly $500 million worth of SOL. At the same time, upcoming network upgrades and ETF expectations are adding to investor interest.
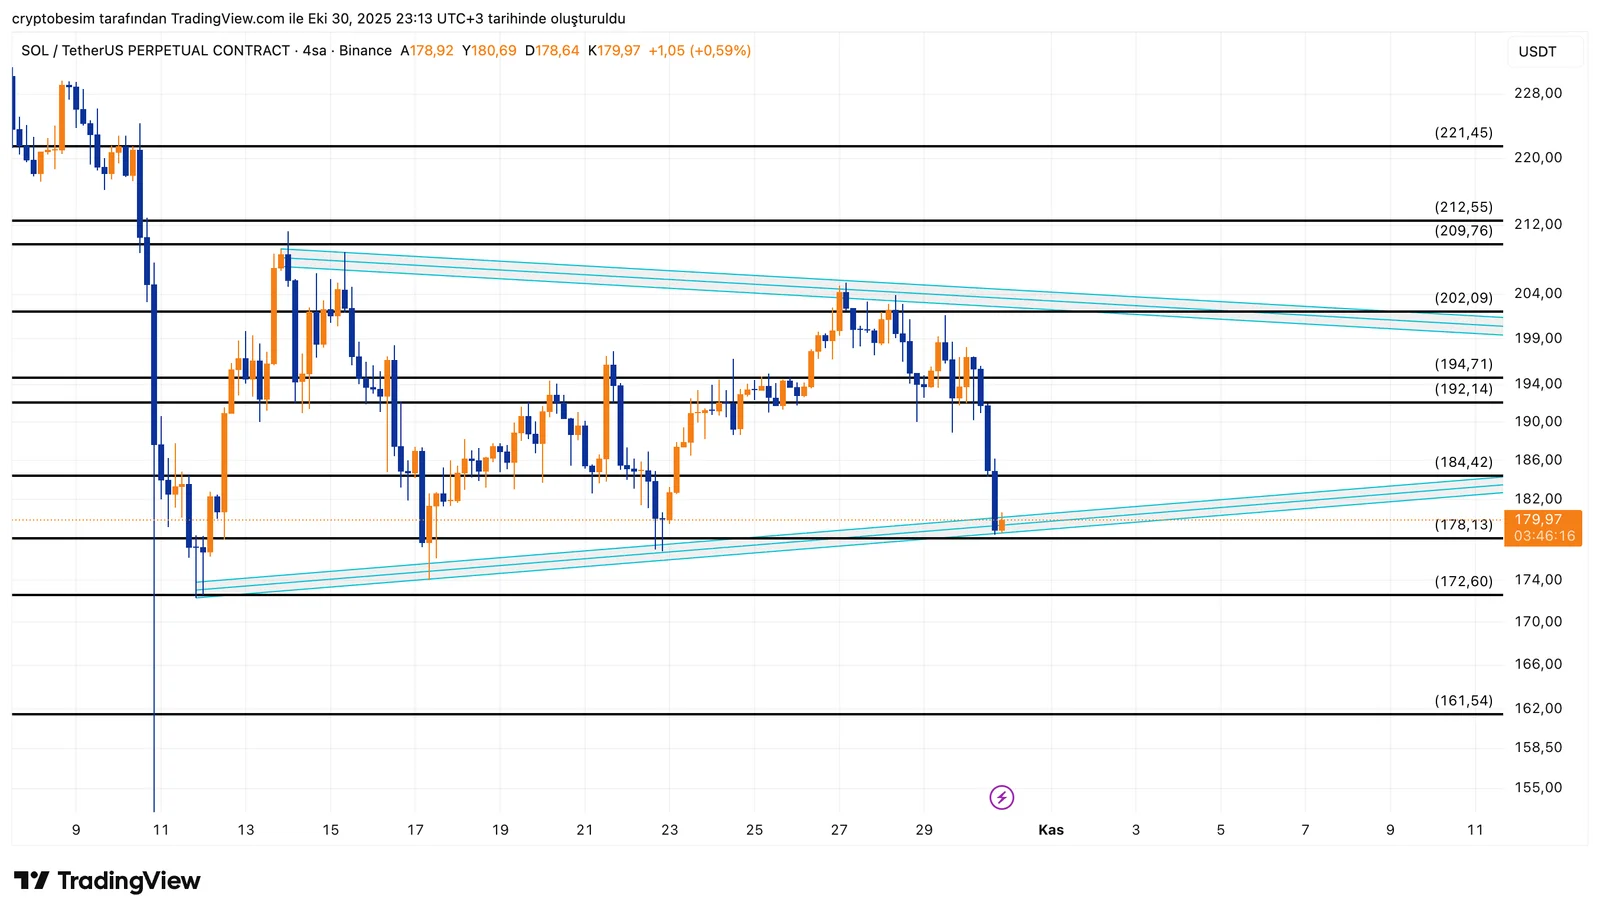
Analyzing the chart on the 4-hour time frame, we see that SOL is still trading inside a symmetrical triangle pattern. The price is now testing the lower band of the triangle, around $178–$180, which is a major short-term support zone. Buyers are showing activity here. If SOL holds above this zone, a bounce toward the upper band is likely. In that case, the first resistance is at $184, followed by a stronger zone at $192–$194. A breakout above $194 could confirm the triangle breakout and push the price toward $202 or higher.
However, if the $178 support fails, the structure may break down, leading to a drop toward $172, and possibly $161, which is the main long-term support.
Support Levels: $180 → $178 → $172 → $161Resistance Levels: $184 → $192 → $202 → $212
Summary:
- SOL is holding within a symmetrical triangle.
- $178–$180 is the key support zone.
- A breakout above $194 could trigger a move to $202.
- Below $178, risk increases toward $172 and $161.
These analyses, not offering any kind of investment advice, focus on support and resistance levels considered to offer trading opportunities in the short and medium term according to the market conditions. However, traders are responsible for their own actions and risk management. Moreover, it is highly recommended to use stop loss (SL) during trades.


