
ARB Technical Analysis
Arbitrum has recently gained attention with its expanding role in DeFi and real-world asset (RWA) tokenization. The rapid growth in active projects and stablecoin liquidity is broadening the network’s utility and driving stronger investor interest in the ARB token. Before diving into the technicals, it’s worth noting how this ecosystem growth is starting to reflect on the price action.
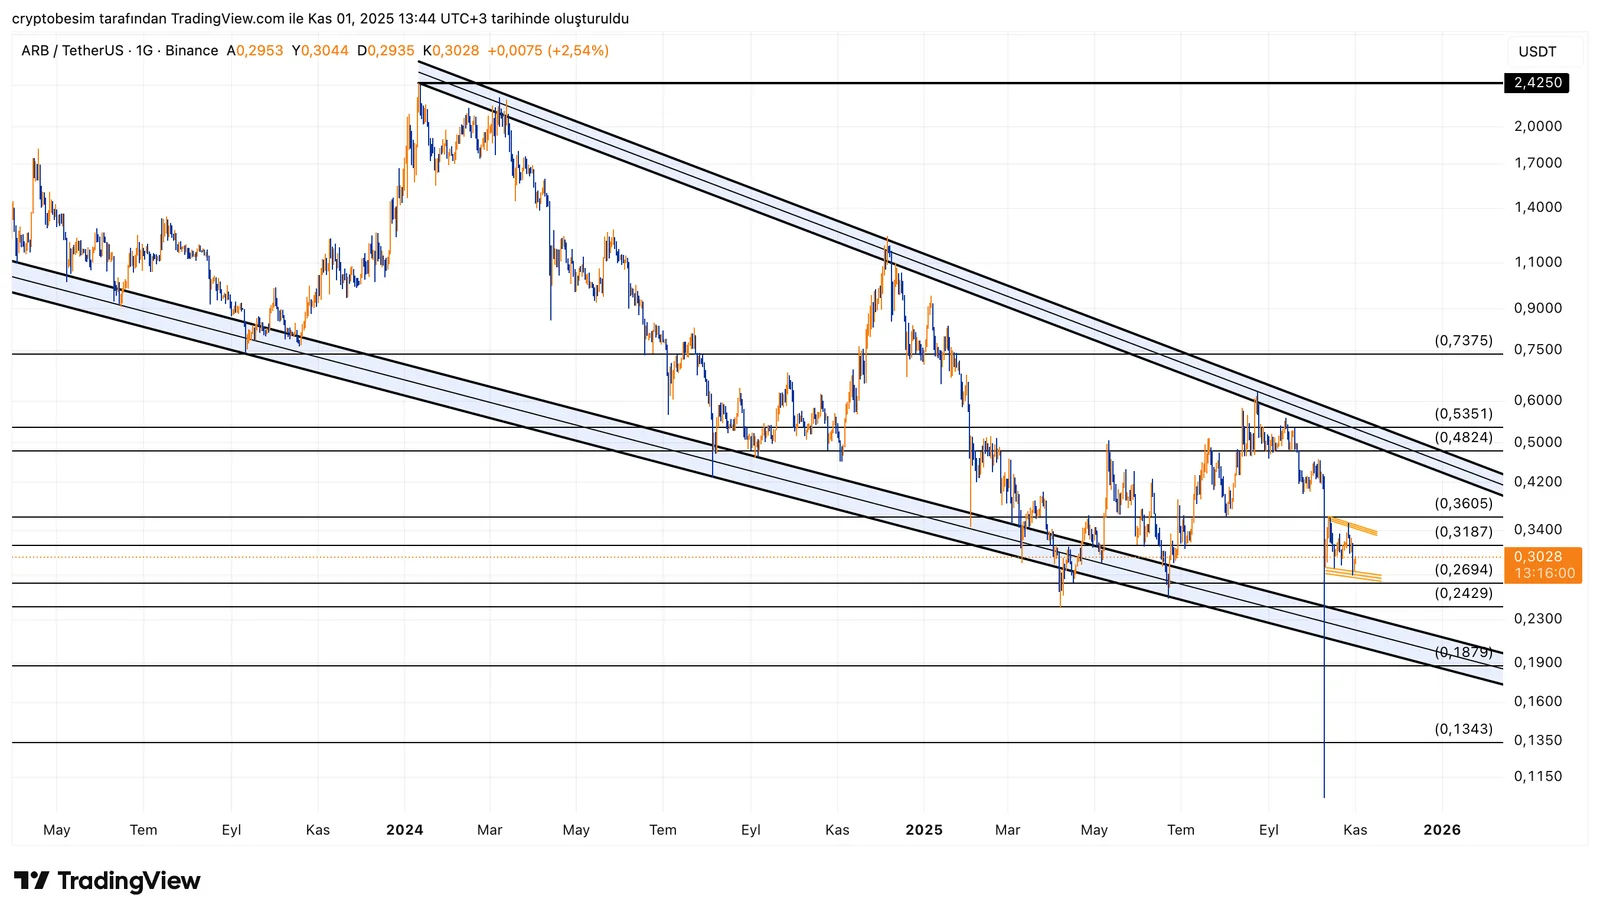
Analyzing the ARB chart on a daily time frame, we see that the coin keeps trading inside a falling wedge formation. This is typically known as a bullish reversal pattern. The price is currently hovering around the midline of the wedge, and holding this area strengthens the case for a potential upside breakout in the coming sessions. In the short term, the $0.30–$0.32 zone remains a key support area. As long as the price stays above this level, the overall outlook remains constructive.
The $0.36–$0.39 range is the first major resistance and could mark the start of a move toward the wedge’s upper boundary. If an upside breakout occurs, targets lie at $0.45–$0.51, with the full wedge projection pointing toward $0.62.
However, a daily close below $0.28 would weaken the structure and increase selling pressure.
Support and Resistance Levels
- Support: $0.32 – $0.30 – $0.28
- Resistance: $0.36 – $0.39 – $0.45 – $0.51 – $0.62
These analyses, not offering any kind of investment advice, focus on support and resistance levels considered to offer trading opportunities in the short and medium term according to the market conditions. However, traders are responsible for their own actions and risk management. Moreover, it is highly recommended to use stop loss (SL) during trades.


