Altcoin
This page lists the latest Altcoin news and market analysis. Browse articles, expert insights, and updates in this category on JrKripto. Stay informed with in-depth coverage of cryptocurrency trends and developments.
News
Altcoin News
Altcoin News
Browse all Altcoin related articles and news. The latest news, analysis, and insights on Altcoin.
Ripple's RLUSD Receives Official Approval in Abu Dhabi
Ripple's dollar-pegged stablecoin, RLUSD, has once again gained regulatory acceptance in the Middle East, expanding its institutional use in the region. Abu Dhabi Global Market (ADGM) has granted RLUSD "Accepted Fiat-Referenced Token" status, paving the way for institutions operating in the financial free zone to use the stablecoin in regulated transactions. This step is noteworthy as part of the United Arab Emirates' comprehensive oversight strategy for DeFi and Web3.This authorization from the ADGM complements Ripple's regional initiatives over the past two years. The company received a full license from the Dubai International Financial Centre (DIFC) in March, and the DFSA authorized the use of RLUSD for regulated activities within the DIFC in June. This establishes Ripple as a stablecoin provider with regulatory standing in two major financial centers in the UAE.Decision came from ADGMThe ADGM's decision regarding RLUSD was made by the Financial Services Regulatory Authority. The decision allows licensed financial institutions in the region to use RLUSD for payments, custody, treasury, and other permitted activities. However, projects must meet the reserve management, transparency, and reporting standards set by the ADGM for fiat-referenced tokens. Ripple states that RLUSD has reached a market capitalization of over $1 billion approximately one year after its launch. The stablecoin is fully collateralized by cash and cash equivalents and issued under a limited-purpose trust charter with the New York Department of Financial Services (NYDFS). This makes RLUSD a secure option for both regional banks and payment institutions.Ripple's growth in the Middle East is not limited to regulatory approvals. Since the end of 2024, the company has connected regional players such as Zand Bank and Mamo to its Ripple Payments infrastructure. The use of the stablecoin for early-stage collateral and payment flows is a key part of Ripple's strategy to position RLUSD at the core of the enterprise cross-payment system. A broader transformation is underway in the UAE. The country has begun to unify free zone regulations nationally. Federal Decree Law No. 6/2025, in effect since September 2025, has placed DeFi, Web3, and digital asset service providers directly under the Central Bank's licensing requirement. This law covers a wide range of areas, including lending, custody, exchange, payment, and investment services, and gives businesses until 2026 to comply.In this environment, the approval of RLUSD by the ADGM paves the way for the integration of stablecoins into broader institutional structures across the UAE. The clarification of the legal framework in two key centers, the DIFC and ADGM, is expected to increase stablecoin adoption by institutional digital finance players in the region. The role of regulated stablecoins, in particular, is strengthening in international payments, cross-border transfers, and collateral transactions.

Binance Lists Two New Altcoins on Two Different Platforms
As Binance enters the final quarter of the year, it is striving to maintain user interest with two new projects on both its Alpha platform and HODLer Airdrops; SUPERFORTUNE (GUA) and APRO (AT) are joining the ecosystem on the same day with different campaign models.GUA coin listed on Binance AlphaLet's start with Binance Alpha. The exchange's Alpha platform, which hosts early-stage projects, became the first listing address for SUPERFORTUNE (GUA). Trading for the GUA/USDT pair began on November 27, 2025. The project is described as a gamified prediction asset that combines Chinese metaphysics and artificial intelligence, running on the Manta Network ecosystem. Within this ecosystem, users can view "fortune" reports, purchase virtual lucky objects, and make in-app purchases. GUA's story also aligns with Asian-centric trends that combine cultural motifs with blockchain infrastructure. Metaphysical-themed tokens periodically attract high interest, especially from retail investors; Low circulating supply and niche themes have the potential to fuel speculative activity. One of the key details about GUA is that only 45 million tokens (4.5% of the total supply) are mentioned in circulation. Furthermore, it's emphasized that the project is currently only traded on Binance Alpha and some smaller exchanges, offers no guarantees, and is a local initiative.Binance Alpha is supporting the listing with a special airdrop campaign. Users with Alpha Points can request an airdrop by visiting the event page during the campaign period. Those who have reached at least 256 Alpha points can spend 15 points to claim 750 GUA; the system operates on a first-come, first-served basis. If the event isn't over, the point threshold required for participation is dynamically adjusted to decrease by 5 points every five minutes, rewarding early adopters and opening up opportunities for accounts with lower points later.Participants have another important responsibility: they must confirm their airdrop request on the Alpha event page within 24 hours. If no approval is received, this is deemed not consented to, and the relevant GUA allocation can be transferred to other users. Binance prefers this system to prevent token accumulation in "empty" or inactive accounts and to distribute the limited-time campaign to as many active users as possible.AT coin coming to HODLer AirdropOn the same day, a new project is also appearing in Binance's HODLer Airdrop program, which rewards BNB holders. The exchange announced the APRO (AT) token as the 59th project listed on the page. APRO is defined as a data oracle protocol that carries real-world data to blockchains. Users who invest their BNB in Simple Earn (flexible or locked) and/or On-Chain Yields products between November 4–6, 2025, will be eligible to receive AT airdrops based on historical balance images. Binance will list AT on the spot market starting at 5:00 PM Turkish Time on November 27, 2025, with USDT, USDC, BNB, and TRY pairs. Users will be able to start depositing AT on the exchange starting at 1:30 PM Turkish Time. The total supply of AT is 1 billion, of which 20 million, or 2%, is reserved for HODLer Airdrop rewards. The same amount of tokens will be allocated to marketing campaigns that will take place six months later. The circulating supply at the time of listing was announced as 230 million AT, or 23% of the total supply. The listing fee was announced as "0," and it was also stated that a detailed research report will be published shortly.AT is currently available for purchase and sale on the Binance Alpha Market; however, once the spot listing begins, it will be removed from the Alpha interface, and the volume in this market will no longer be included in the Alpha Score calculation. An upper limit has been introduced to prevent users with very high BNB balances from dominating the system during airdrop distribution. A user's average BNB balance is not considered to exceed 4% of the total pool. Overall, Binance is highlighting a niche, culturally themed AI token in Alpha, while simultaneously distributing a new data oracle-themed asset to BNB holders through HODLer airdrops. AI and real-world data-focused projects, which have grown in popularity throughout 2025, continue to gain traction with broader user bases through these listings. On the investor side, careful assessment of risks for both GUA and AT, and close examination of token economics and distribution models, remain as crucial as ever.
Bitcoin Surpasses $91,000: Fed Cut Expectations on the Agenda
Bitcoin has reversed course after a sharp pullback last week. With buying during the Asian session on Wednesday and Thursday morning, the BTC price managed to hold above the $91,000 level. The 24-hour gain reached 4.5%. Market analysts believe this move is fueled by both a technical reactionary surge and a surge in risk appetite fueled by strengthening macroeconomic expectations. Market data shows that Bitcoin, which fell to $81,000 last week and shook off the market-shattering decline, first recovered to $89,000 and then climbed to $91,700. Kronos Research CIO Vincent Liu described this reversal as a "classic oversold reaction," stating that liquidity has improved and risk appetite has revived.On the macro front, all eyes are on December. CME's FedWatch data shows that the probability of the US Federal Reserve cutting interest rates at its December meeting has increased to 84.7%. This rate was around 70% last week. While Fed Chair Jerome Powell remains cautious, the market has begun to price in a strong discount. This expectation is creating a liquidity environment that supports both the equity and crypto markets.HashKey Group Chief Analyst Jeffrey Ding stated that Bitcoin's rise is "a natural recovery after a sharp decline," rather than a single catalyst. According to Ding, the market structure remains healthy, and long-term fundamentals remain strong.Altcoins are also recoveringNot only BTC but also major altcoins have accompanied the recovery. Ethereum rose 3% to $3,030, while XRP rose 1%. BNB rose 3.9% to near $890, and Solana rose 2.9% to $143. However, weakness persists in some altcoins. For example, Cardano (ADA) has lost 7% of its value in the last seven days, lagging behind the mainstream basket. Meanwhile, perhaps the most striking factor in the market in recent days has been the strong inflows into XRP ETFs. Grayscale's GXRP product attracted $67.4 million, and Franklin Templeton's XRPZ ETF attracted $62.6 million. Total XRP ETF assets exceeded $628 million, with nearly 80 million XRP absorbed in the first 24 hours. This interest even surpassed the first-day performance of the Solana ETF, which launched at the beginning of the year.Statements from some institutional desks, however, maintain the short-term uncertainty. Anthony Pompliano stated that as the year-end approaches, some institutional investors are reducing their Bitcoin positions due to risk management related to the bonus period. CryptoQuant, on the other hand, notes that BTC's risk-return ratio has reached its most attractive level since mid-2023, a signal that historically points to a new period of accumulation.The rise in the long-short ratio of large accounts on Binance to 3.8 suggests that leveraged investors are betting on a return. However, Citi analysts predict that Bitcoin will consolidate in the $82,000–$90,000 range until the first half of 2026.
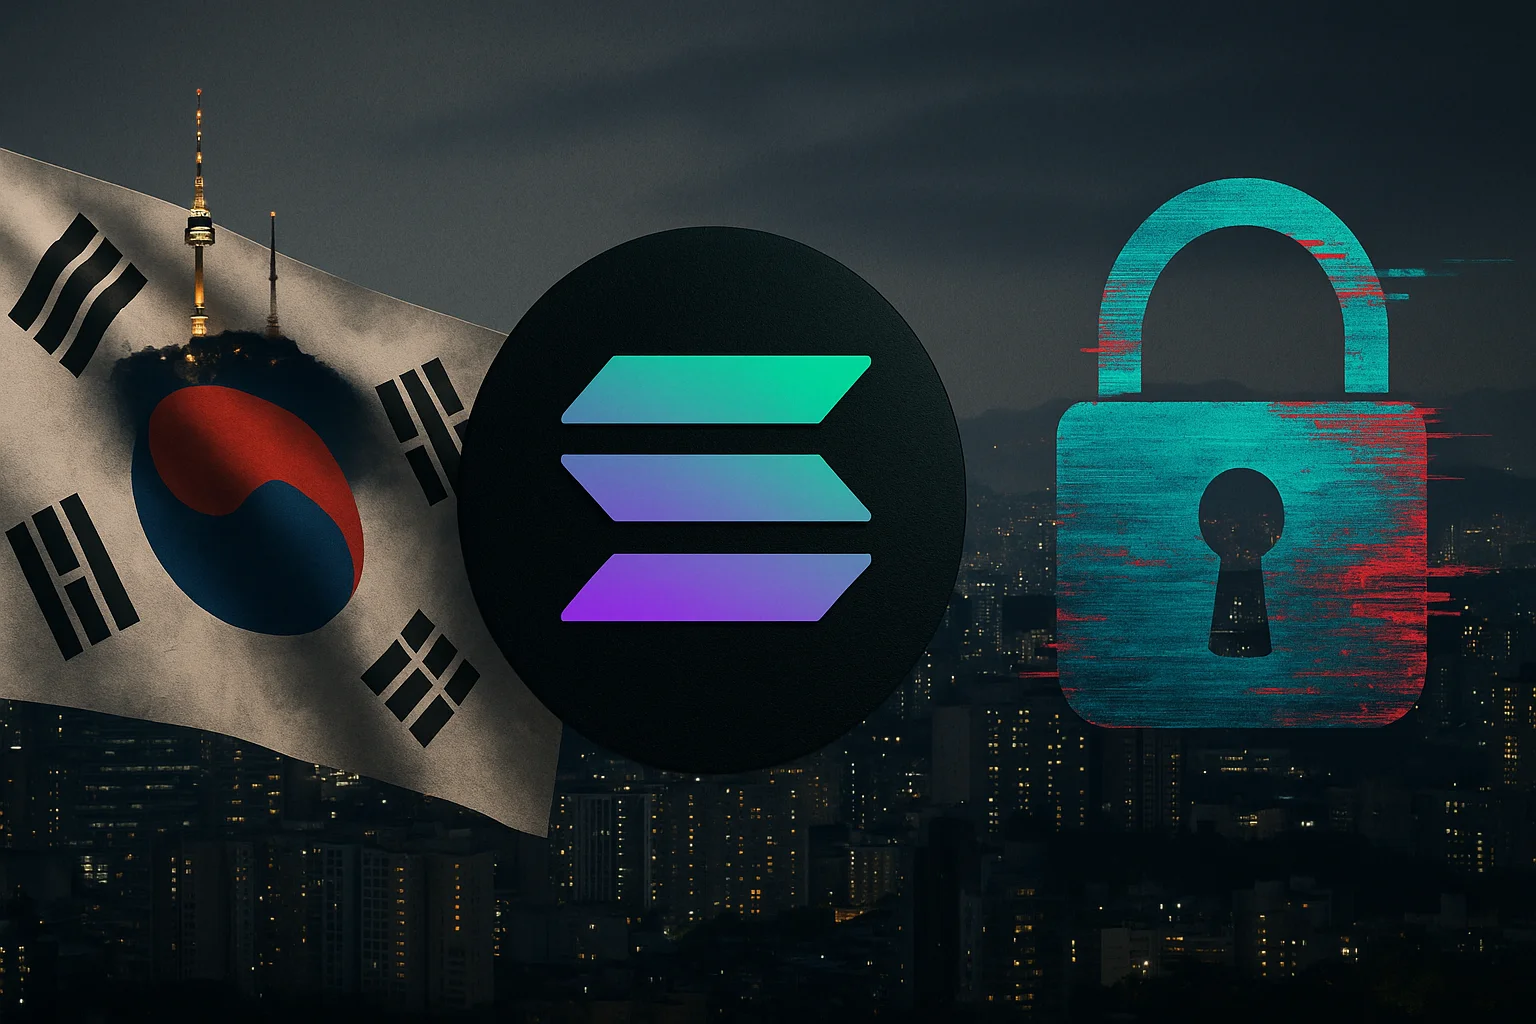
Upbit Massive Attack: 24 Altcoins Stolen, $36 Million Lost
Upbit, South Korea's largest crypto exchange, faced a significant security breach on Thursday morning. However, the initial message was intended to quell user panic: Upbit will fully cover the 54 billion won loss. The exchange quickly detected anomalous outflows from its hot wallet on the Solana network, froze transactions, moved assets to cold wallets, and entered emergency security mode system-wide.The incident unfolded at 4:42 AM with transactions sent to an unauthorized external wallet on the Solana network. Investigations indicate that the attack was not random, but rather a breach that directly targeted the hot wallet address.Full list of stolen tokens releasedUpbit has released a comprehensive list of the tokens seized in the attack. Accordingly, the breached Solana ecosystem assets include:2Z, ACS, BONK, DOOD, DRIFT, HUMA, IO, JTO, JUP, LAYER, ME, MEW, MOODENG, ORCA, PENGU, PYTH, RAY, RENDER, SOL, SONIC, SOON, TRUMP, USDC, and W.The broad range of tokens, spanning both meme coins and DeFi protocols, suggests that the attack involved sophisticated targeting focused on the Solana ecosystem.Upbit's First Step: Freezing, Monitoring, and Full RestitutionThe exchange suspended all deposits and withdrawals on the Solana network minutes after the attack was discovered. System-wide assets were transferred to cold wallets, and security reviews were initiated. Upbit announced that its on-chain analysis teams are tracking the attacker and that freezing efforts are ongoing with the relevant token projects.Most notable of these steps is the successful freezing of approximately 12 billion won in LAYER tokens. Monitoring of the remaining assets continues.Dunamu CEO Oh Kyung-seok clarified the most pressing issue for users in his announcement: “All losses will be covered by Upbit’s own assets. There will be no loss in user balances.”The most critical security challenge since 2019The incident occurred almost exactly six years after Upbit suffered a November 2019 hack that stole 342,000 ETH. While no direct connection between the two events appears to be present, the timing and the widespread impact on the Solana ecosystem have revived security debates.This attack also demonstrates how quickly a large-scale Solana-based hot wallet breach can spread across a centralized exchange.Crisis amid Naver dealThe attack occurred at a critical juncture, as the planned acquisition of Upbit’s parent company, Dunamu, by Naver Financial in a stock swap deal worth approximately $10.3 billion was underway. This merger is seen as a major transformation in South Korea’s tech-economy ecosystem. Therefore, a security breach occurring during this period has increased pressure on both regulators and institutional investors. Upbit's decision to seek full compensation aims to alleviate this pressure.The exchange announced that deposits and withdrawals on the Solana network will be gradually reactivated once all security checks are completed. The technical aspects of the investigation are not yet clear, but it is suspected that the hot wallet private key may have been compromised.Upbit's swift action and announcement that it would fully cover the losses largely mitigated the risk of panic among users.
VANA Comment and Price Analysis - November 26, 2025
VANA/USDT Technical AnalysisAnalyzing the chart on the daily time frame, we see that the price of the coin VANA is getting squeezed between a descending trendline from above and a rising trendline from below. This creates a classic symmetrical triangle. As the price moves toward the end of the pattern, the decreasing volume also confirms this structure. The price is currently in the middle of the triangle and very close to defining a direction.The first major resistance on the upper side is $2.79 – $2.83. If the price closes above this zone, the triangle breaks to the upside and a short-term move toward $2.96, followed by $3.10 – $3.15, can be triggered. However, the lower trendline of the triangle sits around $2.54 – $2.44. If this support fails, the triangle will be considered broken to the downside, and the correction may extend toward $2.30 – $2.20.VANA is in a tightening structure and entering its decision phase. A breakout above $2.83 is bullish, while a breakdown below $2.54 is bearish. Once either level is broken, the direction becomes clear. Narrowing Triangle These analyses, not offering any kind of investment advice, focus on support and resistance levels considered to offer trading opportunities in the short and medium term according to the market conditions. However, traders are responsible for their own actions and risk management. Morover, it is highly recommended to use stop loss (SL) during trades.
INJ Comment and Price Analysis - November 26, 2025
INJ/USDT Technical Outlook INJ Range District Analyzing the chart, we can see that there are two patterns working at the same time: a wide horizontal range and a descending trend channel that is pushing the price downward. For a long time, the price has been moving inside the $5.06 – $6.75 range, and it is currently trading near the lower part of this zone. This setup brings both risk and opportunity, because every time the price has tested the lower band, buyers have stepped in.Looking at the trend structure, INJ has also touched the lower band of the descending channel. This support zone sits around $5.20 – $5.40, and the price is currently attempting to bounce from there. The small recovery coming from the channel bottom suggests that sellers are losing momentum and a short-term relief move is possible.The first short-term target to watch is the horizontal resistance at $5.46 – $5.80. If INJ can break above this area, the price will move toward the middle of the horizontal range and start heading toward the mid-line of the descending channel. This mid-line aligns with the $6.75 level — a strong resistance zone from both the range and the trend perspective.However, the $5.20 – $5.06 zone is critical below. If this support breaks, the price could drop into a wider empty zone down toward $4.60 – $4.01. For now, however, the chart shows that this support area is holding, and the probability of a short-term bounce is slightly stronger.These analyses, not offering any kind of investment advice, focus on support and resistance levels considered to offer trading opportunities in the short and medium term according to the market conditions. However, traders are responsible for their own actions and risk management. Morover, it is highly recommended to use stop loss (SL) during trades.
FIDA Comment and Price Analysis - November 26, 2025
FIDA/USDT Technical AnalysisAnalyzing the chart, we see a very similar pattern to AXAV chart on the daily time frame. The price of the coin has dropped all the way down to the lower band of the descending channel and has seen a small bounce from that level. This reaction indicates that the channel bottom is still holding and sellers are weakening in this area. Falling Channel Structure The price continues to move inside the channel with a sideways–downward structure, and the first short-term target is the mid-line of the channel, located around $0.0480 – $0.0491. If the price can break above this region, the price will gain more room to move, and the natural target will become the upper band of the channel. The upper channel zone sits at $0.0550 – $0.0575. This area is crucial as it combines both a horizontal resistance and the top of the descending channel — making it the key level for the short-term bullish scenario. However, $0.0437 is the first support below. If the price drops below this level, a move back toward $0.0420, which is the lower channel band, becomes likely. As long as this lower band holds, the structure remains a healthy down-channel movement rather than a breakdown.These analyses, not offering any kind of investment advice, focus on support and resistance levels considered to offer trading opportunities in the short and medium term according to the market conditions. However, traders are responsible for their own actions and risk management. Morover, it is highly recommended to use stop loss (SL) during trades.
Thailand Deals a Blow to the Company Behind WLD: 1.2 Million People's Biometric Data Will Be Deleted
Thailand has taken one of the harshest actions yet against the Sam Altman-backed digital identity project World (formerly Worldcoin). The country's Personal Data Protection Commission (PDPC) determined that World's collection of biometric data from Thai users was illegal and ordered the company to halt data collection and permanently delete the iris data of 1.2 million people.The reasoning behind the decision is clear. According to the PDPC, World collected citizens' iris data in exchange for crypto tokens, in violation of Thailand's Personal Data Protection Act (PDPA). Commission Deputy Secretary-General Pol Col Suraphong Plengkham stated that the measures were necessary to prevent data leaks and the misuse of sensitive information.According to authorities, the process by which the iris data was collected was not transparent, and there were strong suspicions that the data was being sold or transferred to third parties. This put World's Thailand operation directly under the government's radar.102 Orb nodes, a large market, and the sudden haltWorld Network is a digital identity project developed by Tools for Humanity (TFH). It offers a World ID based on an iris scan to prove people are human. Those who verify their identity are issued WLD tokens. Thailand was one of the company's largest markets in Asia; the country had a total of 102 Orb scanning locations.TFH's Thai unit, TIDC, suspended its identity verification services at the behest of the PDPC. However, the company maintains that the decision was unfair. A source speaking to the Bangkok Post stated that the government had not contacted users before the data deletion decision, and that people were earning income each month through iris scans. According to the source, deleting the data of 1.2 million people would result in an economic loss of approximately 1 billion baht.At the time of writing, the value of one WLD token is approximately $0.62. Raid, Detentions, and Licensing CrisisThe PDPC decision follows a major operation in October. The Securities and Exchange Commission (SEC) and the Cyber Crime Bureau (CCIB) of Thailand raided a Worldcoin exchange located next to a biometric registration area. The operation allegedly offered unlicensed digital asset services; some employees were detained.Licenses are mandatory for digital asset businesses in the country. Companies violating these rules face up to five years in prison and a fine of 500,000 baht. If the operation continues, an additional fine of 10,000 baht per day is imposed.M Vision CEO Opas Cherdpunt, however, has protested the decision. The company, which hosts the Orb devices, announced plans to bring a lawsuit against the data deletion order, gathering 500 people.A growing list of bans worldwideWorld has not been completely banned in Thailand, but its operations remain severely restricted. This brings the number of countries that have completely banned the platform to eight.Most recently, Colombia immediately and permanently shut down the project weeks after World opened its largest physical headquarters in Bogota. Colombia's regulator, the SIC, mandated the deletion of all data, including iris patterns.Spain, Germany, Indonesia, Brazil, and Kenya have also previously imposed heavy sanctions on the project. Brazil's data protection authority, the ANPD, had announced a daily fine of 50,000 reais for non-compliance with the ban. In Kenya, a court ruled this year that the operations were completely illegal.The Thai government emphasizes that it supports the technology but that "personal data protection laws will be applied in all circumstances." This suggests that World is entering a very difficult period both in Thailand and globally.
What is CateCoin (CATE)?
CateCoin (CATE) has earned a unique place in the crypto world as the first meme coin centered around cats. It currently runs on the BNB Chain and combines humor-focused content with Web3 features like gaming and staking. In other words, in addition to being a "funny coin," it also offers a digital universe where users can interact and earn money. The project aims to blend the fun side of meme coin culture with decentralized finance (DeFi) products.Initially launched as an ERC-20 token on the Ethereum network, CateCoin has expanded its infrastructure over time, transitioning to more accessible chains like the BNB Chain. This reduces transaction fees and increases community engagement. According to current data, approximately 57.7 trillion CATE coins are in circulation, out of a total supply of 60 trillion. This supply structure is balanced by burn and reward mechanisms according to the project's long-term plans. The system operates in a completely decentralized manner; every user can contribute to the project by creating meme content or participating in games. In short, CateCoin doesn't just offer an investment opportunity; it also builds a fun, community-focused, and interactive Web3 world. Let's take a closer look at what CateCoin is, what the CATE token actually does, and how users can benefit from this project.CateCoin's Definition and OriginCateCoin was designed as a utility token that brings together meme coin culture and the world of decentralized finance (DeFi). The project aims to establish an ecosystem where users who create content for fun can also earn cryptocurrency. In other words, a system based on the principle of "create content, participate in games, and earn rewards" is being developed.Initially founded on the Ethereum blockchain, CateCoin has gradually expanded to other networks such as BNB Chain. From day one, the project began to attract users with features such as NFT collections, play-to-win mechanics, and mini-games. CATE token holders are rewarded with passive income by the system for every transaction they make. 2% of transactions are distributed directly to existing token holders, allowing long-term holders to earn additional income. At the same time, a certain amount of tokens are burned with each transaction, reducing the total supply. This deflationary model aims to make the token more scarce over time and maintain its value. For example, according to market data, the project's total supply is 60 trillion CATE. Approximately 40% of this, or 24 trillion, has already been burned. A notable detail is that no tokens have been allocated to the founding team. This demonstrates the community-based structure and the importance placed on decentralization.CateCoin's History: Key MilestonesCateCoin's story began as a community movement that went beyond being just a meme coin. Since its launch in 2021, the project, which has attracted attention with its humorous tone and Web3 infrastructure, has expanded into many areas, from games and NFTs to staking systems and multi-blockchain support. Throughout its development, the CateCoin ecosystem has expanded with sudden price increases, highly popular game launches, and various chain integrations. Today, it hosts an active and dynamic community. Let's take a closer look at CateCoin's journey from its launch to the present day.May 2021 - Launch: CateCoin's journey began on May 9, 2021. Launched on the Ethereum blockchain, the project aimed to bring a new dimension to the classic meme coin concept from day one. The development team used the pseudonym "Cate" and preferred to remain anonymous. This anonymous structure reinforces the project's emphasis on decentralization while ensuring community control.Late 2021 - Rapid Rise and Game Release: In the first months after launch, CATE began listing on decentralized exchanges (notably PancakeSwap). By November 2021, the project began to gain significant traction in the crypto community. In fact, its price surged by over 8,000% during the week of November 1st, quickly attracting attention. During this period, the team launched an NFT-based tower defense game called Rise of Cats. Players could engage in battle with NFT cat characters and earn in-game rewards along the way. The game aimed to create a competitive alternative to rival meme coins like Dogecoin. On November 10, 2021, the CATE price reached an all-time high of $0.0000119.2022-2023 Developments: As of 2022, the project continued to grow. It moved beyond the Ethereum network and began trading on other blockchains, such as BNB Chain and Base. This move both reduced transaction fees and enabled it to reach a wider user base. During this period, CateCoin was listed on major exchanges like Gate.io, allowing users to buy and sell on both centralized and decentralized platforms. The community grew steadily, and a dynamic participation model emerged around the project. Furthermore, the number of investors turning to CATE increased with profits from popular meme coins like Dogecoin and Shiba Inu. Some users made this transition a fun one by sharing content with the theme "I sold DOGE, I bought CATE."2024-2025 Status: CateCoin remains active in 2024 and 2025, with ongoing community support. The project maintains its NFT-based games and maintains staking opportunities. According to market data, as of November 2025, CATE is trading at $0.000000115 and is ranked 1439th by market capitalization with a circulating supply of 58 trillion. While the team hasn't yet released an official roadmap, the project continues to grow through community-focused development. New Web3-based applications, mini-games, and DeFi features are particularly important for CateCoin's future. Why is CateCoin Important?CateCoin goes beyond being a purely entertainment-based project in the meme coin world. What makes it unique is its ability to build a unique community structure that offers its users both content creation and a blockchain-based revenue model. Traditionally dominated by dog-themed meme coins (e.g., Dogecoin and Shiba Inu), CateCoin stands out with its cat theme and quickly garnered significant attention.The project's official trademark registration and occasional anti-fraud campaigns demonstrate a level of seriousness uncommon in the meme coin world. This both boosts user trust and gives the project a long-term viability.The community's active nature is frequently reflected in humorous content and campaigns. The "Sell Dogs, Buy $CATE" image, particularly circulating on social media, humorously conveys that profits from Dogecoin and Shiba Inu are channeled into CateCoin. Thanks to such content, CateCoin is moving beyond being merely a speculative asset and becoming a brand that creates its own culture, humor, and story.In general, we can more easily explain the importance of CateCoin under the following headings:Use areasOne of CateCoin's notable aspects is its broad range of use cases, extending beyond classic meme coins. The project is designed not only as a tradable crypto asset but also as an interactive, productive, and rewarding blockchain platform.First and foremost, CateCoin's innovative content platform offers users a platform where they can directly create meme content and earn money by converting it into NFTs. Users can upload their own memes through the "Submit Gags" section of the official app, and as these content gain popularity, a reward system is activated. Thus, simply creating humor becomes an economic model on the blockchain.GamesThe second major use case is play-to-earn games. The tower defense game "Rise of Cats," in particular, holds a significant place in the CateCoin ecosystem. Players battle hordes of mice with NFT-based cat characters; both PvP and co-op modes are available. Characters used in the game can be sold as NFTs, upgraded, and CATE token rewards can be earned for completing missions. Another alternative that has attracted the community is the Web3-based board game "Ludo," where players engage in strategic battles with cat- or dog-themed pawns. Through all these games, CateCoin transforms entertainment into a rewarding experience. Staking and Passive IncomeAnother important part of the ecosystem is staking and passive income opportunities. CATE token holders can earn a fixed annual return of approximately 15% by locking their tokens for a specific period. This staking process is run through the project's own platform. Additionally, 2% of each transaction is distributed directly to existing CATE holders. This structure rewards users for both gaming and financial transactions, encouraging long-term participation. CateCoin's multi-chain structure also expands its use cases. Initially running on Ethereum, the project quickly integrated into networks like BNB Chain and Base, which offer more affordable transaction costs. This allows users to buy and sell CATE on various platforms like PancakeSwap and Gate.io. Cross-chain access allows CateCoin to reach a wider audience.Finally, the entire project is driven by a community-based approach. The developer team has kept its identity secret from the outset, and no specific tokens have been allocated to the founder or team. This demonstrates that governance is entirely left to the community and that decision-making processes are aligned with a decentralized structure.CateCoin's Founders and Development TeamThe team behind CateCoin consists of anonymous crypto developers who do not share their identities with the public. During the project's inception, this team chose to keep their identities anonymous, using the pseudonym "Cate." This choice is both common in the blockchain world and consistent with the project's decentralization claim. Some sources indicate that the team consists of developers and entrepreneurs experienced in the blockchain and cryptocurrency sectors. However, no official statement has been made to date on this matter, nor has verifiable identities been shared. However, the team's technical proficiency and the infrastructure it has built into the ecosystem suggest significant expertise on the development side.In summary, CateCoin aims for a completely community-centric structure, detached from direct individuals. Founder anonymity, the lack of token allocation, and the delegation of project management to the community are among the key elements underlining this approach.Frequently Asked Questions (FAQ)There's a lot to wonder about CateCoin. For both those hearing about it for the first time and those considering investing, certain questions frequently arise. From token structure and use cases to purchasing methods and security, the community is captivated by a wide range of topics. Below, we've compiled the most frequently asked questions and answers about the CateCoin ecosystem.What is CateCoin and why was it created?: Launched in May 2021, CateCoin is one of the first meme coin projects to stand out with its cat theme. The project's starting point is to go beyond the concept of a meme coin that simply provides entertainment and offer content creators a real revenue model. CateCoin aims to create a decentralized platform where users can create their own humorous content and generate income by converting it into NFTs. Another strength of the platform is its gamified structure. CateCoin is not only a passive investment tool; it also aims to keep its users active within the ecosystem through NFT-based games, staking systems, and interactive features that distribute rewards. Games like "Rise of Cats," in particular, combine the fun aspects of the project with the financial opportunities offered by blockchain technology. CateCoin's core story features a humorous portrayal of the rivalry between cat- and dog-themed meme coins (dograce). Thanks to this community-embraced theme, the project reaches a wide audience through social media posts and viral content. In short, CateCoin offers an ecosystem focused on creators, gamers, and investors, combining fun and profit in the decentralized world.Where can I buy CateCoin?: CateCoin is traded on both centralized and decentralized exchanges. The most popular trading platform is Gate; PancakeSwap (BNB Chain) and LATOKEN are also available. To acquire CATE, you can deposit BNB or USDT into your crypto wallet and use the appropriate trading pairs on these platforms. Official guides state that transactions on the BNB chain are multi-step, with BNB purchased and converted to CateCoin using MetaMask/Trust Wallet.Can CateCoin be staked? How much does it yield?: Yes, CateCoin tokens can be staked through the official staking portal. You can lock CATE by connecting your wallet to the platform and earn passive income. The developers offer a fixed annual return of approximately 15% on staked CATE. Additionally, a 2% fee distributed from each transaction provides additional earning opportunities for long-term investors.Has the CateCoin smart contract been audited? Is the project secure?: The CateCoin development team frequently emphasizes their commitment to smart contract security. Some promotional materials state that the contract code has undergone independent audits and the necessary security tests have been conducted. However, detailed technical reports regarding these audits have not been publicly shared with the community. This demonstrates that there is still room for improvement in terms of transparency. So, yes, there are various claims regarding the project's security; however, not all of these statements have been verified or documented by independent regulatory bodies. Therefore, it is important for users considering investing in CateCoin to conduct their own research, compare resources, and carefully evaluate risk factors, just as with other crypto projects. Audit transparency, a fundamental security element in blockchain projects, should be considered in investment decisions.Which blockchains does CateCoin work on?: Initially created as an ERC-20 token on the Ethereum blockchain, CateCoin soon became available on networks such as BNB Chain and Base. The project's multi-chain architecture aims to unite diverse communities and keep transaction fees low. Therefore, you can access CATE using wallets and exchanges on multiple supporting blockchains.What is CateCoin's total supply and circulating amount?: The project's total token supply is set at 60 trillion CATE. Because a large portion of this supply has been burned, the circulating amount is approximately 57-58 trillion. The burn mechanism and fixed supply policy for each transaction make the token increasingly scarce over time, creating a deflationary effect. How does CateCoin differ from other meme coins?: In addition to being the first meme coin to thematically center on cats, CateCoin distinguishes itself from other meme coins by offering tangible use cases like staking and gaming. For example, Dogecoin lacks staking or deflationary features, while CateCoin offers investors additional earning opportunities through 2% transaction fee distribution and staking. Furthermore, the project community focuses on building a holistic ecosystem through trademarks and community campaigns.Don't forget to follow our JR Crypto Guide series to discover the most up-to-date analyses, user guides, and investment tools for CateCoin and other popular meme coin projects.

AVAX Comment and Price Analysis - November 25, 2025
AVAX Technical AnalysisAVAX continues to expand its ecosystem and attract growing global investor interest. The Avalanche Foundation’s recent Web3 funding initiatives and its partnerships with various GameFi projects are broadening the network’s use cases. On-chain data also shows an increase in both daily active users and transaction volume.On the technical side, a descending channel structure stands out. The price has reacted strongly from the lower boundary of this long-standing descending channel and is now entering an upward recovery phase. This rebound aligns with both the channel bottom and the local Fibonacci levels.Short-Term Outlook Falling Channel Structure The price is currently moving toward the midline of the channel, which forms the first area of compression. Once it manages to break above this level, the target becomes clearly the $16 region. This is because the Fibonacci resistance and the upper boundary of the descending channel intersect around that zone. For this reason, $16 is the most critical target in the short-term bullish scenario.If the price manages to close above $16, it will become more evident that the descending trend is weakening, increasing the likelihood of an extension toward the $17 level.On the downside, $13.65 serves as the first significant support. If this level is lost, the price may retrace back toward the channel bottom, roughly around the $13 region.Summary; AVAX is currently performing an upward correction following a strong reaction from the channel bottom, and the natural target of this move is the $16 band. The reaction it gives around this level will determine the short-term direction.
New XRP ETFs Surpass $130 Million: SOL, BTC, ETH Lag Behind
Spot XRP ETFs, which began trading in the US, made a splash in their first session on Monday. Grayscale and Franklin Templeton's new funds attracted over $60 million in inflows in a single day, outperforming both Bitcoin, Ethereum, and Solana ETFs. This strong start, which accompanies the general market recovery, indicates that the long-awaited institutional interest in XRP is finally becoming visible.XRP ETFs ImpressGrayscale's conversion of its closed-end GXRP Trust into an ETF made immediate impact on the first day; the fund closed the day with a net inflow of $67.4 million. Franklin Templeton, the $1.5 trillion asset manager's new product, XRPZ, attracted attention with a net inflow of $62.6 million. The combined performance of the two giants closed the day with over $130 million in volume. Adding the $16.4 million from Canary Capital's XRPC fund and the $17.7 million from Bitwise's XRP ETF, the spot XRP ETF category recorded a net inflow of $164.1 million in just one day. Furthermore, the total net inflows of XRP ETFs launched on November 13th have already reached $586.8 million, with not a single outflow recorded to date.Franklin Templeton ETF Product Director David Mann outlined the rapid increase in institutional appetite, emphasizing that XRP is "a digital asset that plays a fundamental role in the global settlement and payment infrastructure." However, it's noteworthy that BlackRock hasn't yet included XRP products; for now, the company appears to be focusing on maintaining its market dominance with its Bitcoin and Ethereum ETFs.The positive market sentiment has also pushed the price of XRP higher. XRP, which rose 8.6 percent on Monday, was trading at $2.20 at the time of writing. BTC, ETH, and SOL ETFs lag behind XRP.On the same day, US spot Bitcoin ETFs experienced net outflows of $151.1 million. Ethereum products partially offset this with net inflows of $96.6 million. Solana ETFs closed positive for the 20th consecutive day with inflows of $58 million, bringing their total inflows to $568.3 million. However, they still failed to match the first-day performance of XRP ETFs.Grayscale's DOGE ETF Opens QuietlyGrayscale also launched the first US spot DOGE ETF on Monday. However, the DOGE ETF failed to register any inflows on its first day. Despite this, experts see this launch as a symbolic breakthrough. NovaDius President Nate Geraci described the DOGE ETF as "one of the most striking indicators of the regulatory transformation of the past year."
What is Bloktopia (BLOK)?
The concept of the metaverse has become one of the most exciting developments in the digital world in recent years. These digital universes, where people spend time not only for entertainment but also for working, learning, and even investing, offer a vision of a future intertwined with technology. This new world, shaped by the combination of technologies such as virtual reality (VR), blockchain, and NFTs, makes the classic internet experience much more interactive and personal. This is where projects integrating the crypto world into the metaverse stand out. One such platform is Bloktopia.Bloktopia is an innovative metaverse platform designed with the theme of a 21-story skyscraper, combining the world of cryptocurrency with virtual reality. In this digital universe, users can both have fun, learn, and have the opportunity to earn income. The project is being developed with the Unity game engine and built on the Polygon blockchain, offering a fast, low-cost, and decentralized experience. Each floor is dedicated to a different experience area: educational content, advertising spaces, NFT galleries, event stages, and more. Users can roam this virtual skyscraper with their avatars, participate in events, purchase land, or build their own digital projects. The BLOK token, at the center of this entire ecosystem, forms the backbone of the system with functions such as payments, rewards, and staking. Let's take a look at what Bloktopia is, how it works, and what opportunities it offers.The Definition and Origins of BloktopiaBloktopia was born in 2021 at the intersection of virtual reality (VR) and crypto technologies. In addition to being a technical metaverse platform, this project also aims to increase crypto literacy, provide income opportunities for users, and make the digital experience enjoyable through gamification. Co-founders Ross Tavakoli (CEO) and Paddy Carroll (CMO) bring their experience in finance and technology to this project, establishing a decentralized learning and interaction space in the metaverse. Designed as a 21-story virtual skyscraper, this universe directly references Bitcoin's limited supply of 21 million tokens; in essence, it has both a symbolic and functional structure. Bloktopia's motto is "Learn, Earn, Play, Create"—learn, earn, play, and create. These four concepts form the platform's core pillars. When users log in, they first encounter the ground-floor lobby. From there, each floor offers a different experience. The lower floors house cryptocurrency training videos, the middle floors host sponsored presentations and booths, and the upper floors house special event halls, NFT galleries, and gaming areas. Both users seeking training and entrepreneurs seeking brand collaborations can find space within this structure. Landowners (REBLOK) can also create their own content, rent these spaces out, or sell them as NFTs. Bloktopia stands out with its decentralized structure. Everything runs on blockchain; this means the platform is controlled directly by the user community, not a centralized company. This is made possible by the DAO (Decentralized Autonomous Organization) system. The native token, BLOK, grants voting rights in governance processes and drives all economic interactions. Created using the ERC-20 standard on the Polygon network, the BLOK token offers a structure that reduces transaction fees and enables fast transfers.BLOK holders can purchase all on-platform assets, such as advertising space (ADBLOK), land parcels (REBLOK), event tickets, and access to exclusive content. They can also earn passive income by staking their tokens. The system also allows for the burning of tokens as a result of certain transactions, reducing the supply and creating a deflationary token economy. With a total supply of 200 billion BLOK tokens, the platform gains more usage as the platform grows, building a resilient economy driven by user participation. Bloktopia's History: Major MilestonesSince entering the metaverse in 2021, Bloktopia has been a continuously evolving project, listening to community feedback and gradually expanding its technological infrastructure. With the opportunities it offers for both individual users and corporate partnerships, it enriches the blockchain-based virtual reality experience every year. Since its initial launch, Bloktopia has attracted attention with various investment rounds, exchange listings, product updates, and community events, and is consistently following its roadmap. Here are the project's major developments and milestones over time:2021 (Foundation and Launch): Bloktopia was launched in 2021 under the leadership of Ross Tavakoli and Paddy Carroll. In its first year, the project attracted the attention of strong investors. In August 2021, a private investment round with industry giants such as Animoca Brands and Polygon raised approximately $4.2 million. In October of the same year, the BLOK token was listed on major exchanges such as KuCoin, attracting investors. Binance Academy also highlighted the 21-layer VR metaverse concept by listing Bloktopia among the "four notable crypto projects in the Metaverse." This period marked the first major turning point in the project's recognition by the global crypto community.2022 (Initial Expansion Phase): 2022 saw Bloktopia accelerate its product-focused development. In August 2022, the BLOK/USDT pair began trading on the MEXC exchange. This year, new technical features were integrated into the platform; the metadata layer was strengthened. Furthermore, a new advertising NFT model called ADBLOK was introduced. Thanks to this structure, users were able to transform virtual advertising spaces into NFTs, displaying their own content and earning a share of advertising revenue. At the same time, community engagement was increased through virtual conferences, workshops, and promotional events organized within the platform, and interaction between users gained momentum. 2023 (VR Experience and DAO Era): In 2023, Bloktopia took steps to further enhance the VR experience. In February, a new VR space called "Meta Spaces" was integrated into the platform, and the first live VR launch was held in this space. At the event, CMO Paddy Carroll and CEO Ross Tavakoli met with users in a virtual environment and shared the roadmap. This introduced a new layer of experience that provides one-on-one interaction within the metaverse. The beta version of the Bloktopia wallet was launched to users in March 2023. This wallet was developed to facilitate on-platform token transactions and asset management. With the Bloktopia DAO feature announced at the same time, token holders can now directly participate in governance processes, i.e., vote on project decisions. This step was crucial for the concrete realization of the decentralization vision. 2024 and Beyond: By 2024, Bloktopia is preparing to release its long-developed MVP (Minimum Viable Product) version. The team officially announced that the MVP will be released by October 2024. Co-founder Paddy Carroll described this development as "the most critical milestone in the project's roadmap." During this process, platform users were invited to a beta environment where they could purchase and rent assets within the metaverse and test their own content. Significant technical innovations were also introduced: VR headset compatibility was improved, new floor plans were designed, and the SDK (Software Development Kit) introduced tools for users to create their own content from scratch. Furthermore, collaborations with other blockchain projects like Elrond aim to bring new integrations and user flows to the platform.2025: As of November 2025, the price of BLOK coin is trading around $0.00010. Why Is Bloktopia Important?Among early-stage metaverse projects, Bloktopia stands out for both its vision and technical infrastructure. Its 21-story virtual skyscraper combines crypto learning, gamification, and monetization. Its "edutainment" approach, which blends education and entertainment, allows users to both learn and actively participate in the interactive experiences offered by the platform. Operating on the Polygon network, it offers both low transaction fees and high speed, resulting in access to a wider range of users.Bloktopia appeals to a wide range of cryptocurrency users, from newcomers to experienced investors, developers, and content creators. The platform's core core of learning, gaming, earnings, and creativity distinguishes it from traditional metaverse projects. Features like advertising revenue and NFT trading, which enable users to generate passive income, make the platform not only a platform for experimentation but also a sustainable economic model. While the supply of the BLOK token diminishes over time through a burn mechanism, distributed rewards and a staking system reinforce user loyalty. All these components make Bloktopia a project that distinguishes itself in both today's and the future's digital economy.Use CasesWith its extensive content offering, Bloktopia is not just a game or a showcase; it's a multi-purpose digital hub. Here are some of the prominent use cases:Metaverse Experience: Users can freely navigate the 3D VR environment with their own avatars. Each of the 21 floors has a different theme. Many sections, such as exhibition areas, project launch stands, partner offices, and private rooms for content creators, are open to exploration. Interaction is instantaneous; meaning a user can be in the same space with another user at the same time, experiencing one-on-one social experiences.VR Events: The platform hosts virtual meetings, global launches, panels, and presentations. At the first live VR event, held in 2023, the CEO and CMO met with users in person in a virtual environment. Product launches, AMAs (Ask Me Anything), concerts, and even TEDx-like content can be experienced within the metaverse. Advertising: Bloktopia offers brands an innovative advertising space. Thanks to NFT-based billboards called ADBLOK, companies can directly reach their target audience. Users who own these billboards receive a share of the revenue generated, transforming advertising into a user-based revenue model.Education: The "Learn" aspect of the project has a strong focus. Content can be offered on a wide range of topics, from basic cryptocurrency concepts to advanced trading strategies. Virtual classrooms, video seminars, interactive workshops, or one-on-one mentoring sessions make the training both accessible and engaging.NFT Showcases and Art: Users can showcase their NFT artwork on the Bloktopia marketplace. Owners of REBLOK (land NFTs) can build galleries on these plots of land and create custom themed exhibitions. These spaces are open to other users and are also actively used for sales and interaction. Token EconomyBLOK is a utility token at the center of the Bloktopia universe. It's not just for buying and selling; it also plays a role in many functions, including staking, spending, advertising revenue generation, and governance. Approximately 24.8 billion BLOK tokens are in circulation, out of a total supply of 200 billion. The distribution plan is quite detailed:33% Treasury (for development and reserves),25% Staking rewards,15% Founding team,7% Advisors,6.16% Second private sale,4.15% First private sale,4% Seed investors,3.29% Early adopters,1.4% Public sale,1% Exchange liquidity.This model focuses on long-term growth. Maintaining high staking and treasury ratios, in particular, ensures community engagement and sustainable on-platform incentives. BLOK has two important mechanisms:Staking:Users participate in staking pools by locking up any amount of BLOK tokens for a specific period. This contributes to the security of the network and generates passive income. Staking participants also have a say in governance votes held through the DAO.Burn:BLOK tokens used during certain transactions (e.g., REBLOK purchases) are removed from circulation. This reduces the supply, aiming to increase the token's value over time. In other words, the system both rewards users and creates a deflationary structure within the token economy.In addition, a portion of the revenue generated from ADBLOK billboards is distributed to token holders. Thanks to this model, advertising generates revenue not only for the platform but also directly for the user.Who is the Founder of Bloktopia?The team behind Bloktopia consists of individuals with significant experience in virtual reality and blockchain technologies. The project is driven by both technical proficiency and a visionary approach. Co-founder Ross Tavakoli has been an active figure in the crypto world since 2015. Known for his background in game development, Tavakoli shaped the technical infrastructure and product vision at Bloktopia. The other co-founder, Paddy Carroll, comes from a marketing background. After holding senior positions at major brands, he joins Bloktopia to lead the community building, brand identity, and partnerships side.The Bloktopia team is growing stronger over time. Simon Benson has been appointed CTO (Chief Technology Officer). Benson is a VR expert who worked on the Sony PlayStation VR project and has extensive experience with virtual reality hardware. As such, he is one of the individuals who has taken Bloktopia's VR experience to the next level from a technical perspective. Libby Rothwell, CIO (Chief Information Technology Officer), comes from the film and media industry. With his experience in mass communication and content strategies, he contributes to the integration of Bloktopia into the digital arena. This ensures the project is not only technically sound but also secures a solid foundation in terms of content production and user experience.The team strives to operate the project as transparently as possible. The names, backgrounds, and areas of responsibility of all founding members and executives are openly shared with the public. This provides a significant advantage, particularly in terms of investor trust and community engagement.Bloktopia is supported not only by its founders and technical team, but also by its strong investor network and collaborations. Leading companies in the industry, such as Animoca Brands and Polygon Labs, are contributing financially and technologically to the project. Furthermore, various blockchain projects, such as Elrond, are also joining the ecosystem by opening virtual offices within the Bloktopia universe.Frequently Asked Questions (FAQ)Below, you can find some frequently asked questions and answers about Bloktopia.What is the difference between Bloktopia and BLOK coin? Bloktopia is the name of the 21-story VR metaverse project; BLOK is the token used in this ecosystem. In a sense, Bloktopia is a virtual universe, while BLOK coin is the currency within this universe. BLOK tokens are spent on land purchases, event participation, and other services within Bloktopia.What does Bloktopia do in the metaverse? Bloktopia is a metaverse platform where users can learn and play cryptocurrency and participate in virtual events. In this world, designed like a real skyscraper, you can watch educational videos, attend virtual classes, play games, socialize with friends in VR, and even take advantage of revenue opportunities like NFTs and advertising. BLOK token holders also benefit from privileges such as access to exclusive events and land rentals.How to purchase BLOK tokens? The BLOK token is available on centralized crypto exchanges and some DEXs. For example, it can be traded using the BLOK/USDT pair on major exchanges such as Kraken, ByDFi, and Crypto.com. It is also possible to supply BLOK tokens on local exchanges such as Koineks and Paribu in Turkey, or on global platforms (KuCoin, Gate.io, etc.). To purchase tokens, simply open an exchange account and deposit the desired amount of tokens into the specified crypto portfolio.Are VR headsets required for Bloktopia? Bloktopia is fundamentally designed to provide a VR experience; however, VR headsets are not mandatory. Because the platform provides a virtual space, it can be accessed via a computer or mobile device. However, VR headsets enhance the metaverse experience by enhancing visuals and interactivity. Anyone can participate in the project with any device, but a VR device is recommended for those who want to experience the 3D sensation in VR.What is the future of BLOK coin? Many experts emphasize that the future of BLOK depends on the popularity of the Bloktopia metaverse. The project's ability to reach its target audience, update with new features, and maintain community interest will influence the token's value. According to Paribu, developments in the BLOK token's roadmap and active product portfolio are key factors that will shape its future. Of course, the crypto market is volatile; therefore, long-term expectations may vary depending on the overall interest in metaverse projects and their continued competitiveness. As of 2025, the metaverse space appears to be less attractive than it once was.You can find up-to-date guides, analyses, and user guides related to Bloktopia and metaverse projects in the JR Kripto Guide series.
UNI Comment and Price Analysis - November 24, 2025
UNI/USDT Technical AnalysisA major and exciting shift is taking place within the Uniswap ecosystem. Under the proposal called “UNIfication,” trading fees are expected to be activated and millions of UNI tokens will be burned. This transformation could turn UNI from a simple governance token into a value-producing asset. Rising and Falling Trend From a technical perspective, the structure on the chart is quite clear. There is a long-term ascending main trend, and the price continues to react positively each time it pulls back toward this trend. At the same time, a medium-term descending trend is pressing down from above. The interaction of these two structures has formed a distinct symmetrical triangle on the chart.The price is currently positioned around the middle of this triangle, and the available movement range is narrowing. In such formations, the direction of the breakout typically determines the next major trend.Bullish ScenarioIf the price begins to break above the 6.18 – 7.43 range, the first target becomes 7.88. The key decision zone, however, lies between 9.30 – 11.00. Sustained closes above this area would break the descending trend and shift UNI back into a strong bullish structure.Bearish ScenarioThe 5.30 region remains the main support forming the lower trend. As long as this area holds, the overall structure is not considered broken. However, a close below this level would signal a downside breakout of the triangle, potentially pushing the price toward 4.90 or even 4.30.UNI is currently squeezed between a long-term ascending trend and a short-term descending trend. It may continue ranging within this band for a while, but once a breakout occurs, the asset carries a high probability of generating a sharp directional move.These analyses do not constitute investment advice. They focus on support and resistance levels that may offer potential short- or medium-term trading opportunities depending on market conditions. The responsibility for trade execution and risk management lies entirely with the user. Stop-loss usage is strongly recommended for all shared setups.
$1.9 Billion Outflow in Crypto Funds: BTC, ETH, SOL, SUI in the Red!
Crypto asset investment products experienced a significant wave of outflows last week. According to CoinShares' latest report, a total of $1.94 billion in outflows from crypto funds occurred. This brings the total outflow over the last four weeks to $4.92 billion. This period marked the third-strongest series of outflows since 2018.The weakening of investors' risk appetite continues to pressure both prices and fund flows. Nevertheless, the $258 million inflow on the last trading day of the week signaled a limited, albeit drastic, recovery in market sentiment.Bitcoin funds recover after a large outflowBitcoin products were hit the hardest. $1.27 billion in outflows from BTC funds during the week. This level of outflow suggests that investors remain cautious in the short term. However, the picture changed somewhat on Friday, with $225 million inflows into Bitcoin funds. This movement suggests that, despite the weak weekly outlook, investors are looking to buy at the dips. Interest in short Bitcoin products continues to strengthen. Funds holding short positions saw $19 million in inflows during the week. The total inflow over the last three weeks reached $40 million, representing 23% of the product's assets under management. The increase in AUM for short products is striking; it grew by 119% in just three weeks.Ethereum investment products were also affected by the downturn. $589 million in outflows from ETH funds occurred during the week. This figure represents 7.3% of the funds' total assets. However, similar to Bitcoin, $57.5 million in inflows were seen on Friday, with a limited recovery.Solana weakened in altcoins, while XRP roseThe picture on the altcoin side is mixed.• Solana closed the week negatively with $156 million in outflows.• XRP, however, bucked the general trend and attracted attention with $89.3 million in inflows.XRP emerged as the strongest performing asset of the week. Strong interest in fund flows could also have a supportive effect on the price. The sharpest outflow came from the US.The largest outflow in the regional breakdown came by far from US funds.• US: $1.68 billion outflow• Germany: $118 million outflow• Canada: $27 million outflow• Brazil: $20.9 million inflow• Switzerland and Sweden: total outflows exceeding $130 millionFund flows originating in the US continue to shape the general direction of global flows. This region, where institutional investor behavior is particularly concentrated, was a key factor in the week's downturn.Although there have been heavy outflows in the last four weeks, total inflows since the beginning of the year still stand at $44.4 billion. This suggests that institutional interest remains strong in the bigger picture.Friday's inflows indicate that some investors are beginning to see the decline as an opportunity. If the market strengthens this signal in the coming weeks, fund flows may stabilize.
Cardano Crisis: ADA Price Shakes, FBI Investigation Begins
The Cardano network experienced a major technical issue on Friday. A faulty delegation process caused the network to split into two different ledger structures. This split was brief, but its impact was significant. The ADA price dropped by as much as 16%, and major exchanges temporarily halted ADA transactions.The transaction that caused the chain split was prepared using AI-generated instructions. Newer node versions validated the transaction, while older versions rejected it. This incompatibility forced block producers to generate transactions on two different chains. A report published by Intersect revealed that the error was caused by a library bug that had gone unnoticed for years.After the issue began, wallet services, block explorers, and some DeFi applications were disrupted. Transactions were either slowed or not processed at all. Coinbase, Upbit, and Kraken halted ADA deposits and withdrawals. Coinbase's outage lasted approximately 14 hours. User funds were not lost, but the risk of double-spending and orphan blocks created a cautious atmosphere in the ecosystem. The ADA price fell to $0.41 following the news. The token has lost more than 30% of its value in the last two weeks. Investors are currently focused on statements from both the technical team and the investigating authorities. Developer's confession and FBI processA few hours after the incident, an X-user named "Homer J" claimed responsibility. The user claimed to have created the erroneous transaction while testing it on his own system. He stated that he did not correctly understand the AI's commands. He explained that his server automatically blocked network traffic, causing the transaction to be sent incorrectly. He added that he had no malicious intent, acted alone, and did not seek financial gain.However, Cardano founder Charles Hoskinson rejected this explanation. He described the incident as a "personal and deliberate attack." He stated that the FBI had been notified. Intersect's forensic analysis also indicated that the incident may be related to someone from Cardano's former Incentivized Testnet era.The IOG, Cardano Foundation, EMURGO, and Intersect teams prepared an urgent patch within three hours and notified the staking pool operators of their updates. The network reconverged onto a single chain on November 22nd. ADA transactions gradually returned to normal.These developments have kept the Cardano community on both technical and legal alert. The chain split tested the network's resilience, but the debate continues.