
ZK/USDT Technical Analysis
Analyzing the ZK chart, we can see a clear descending channel pattern. ZK is trading inside this pattern, touching both the lower and upper bands. Such patterns usually show the main trend direction, while the lower band often acts as a potential reversal zone.
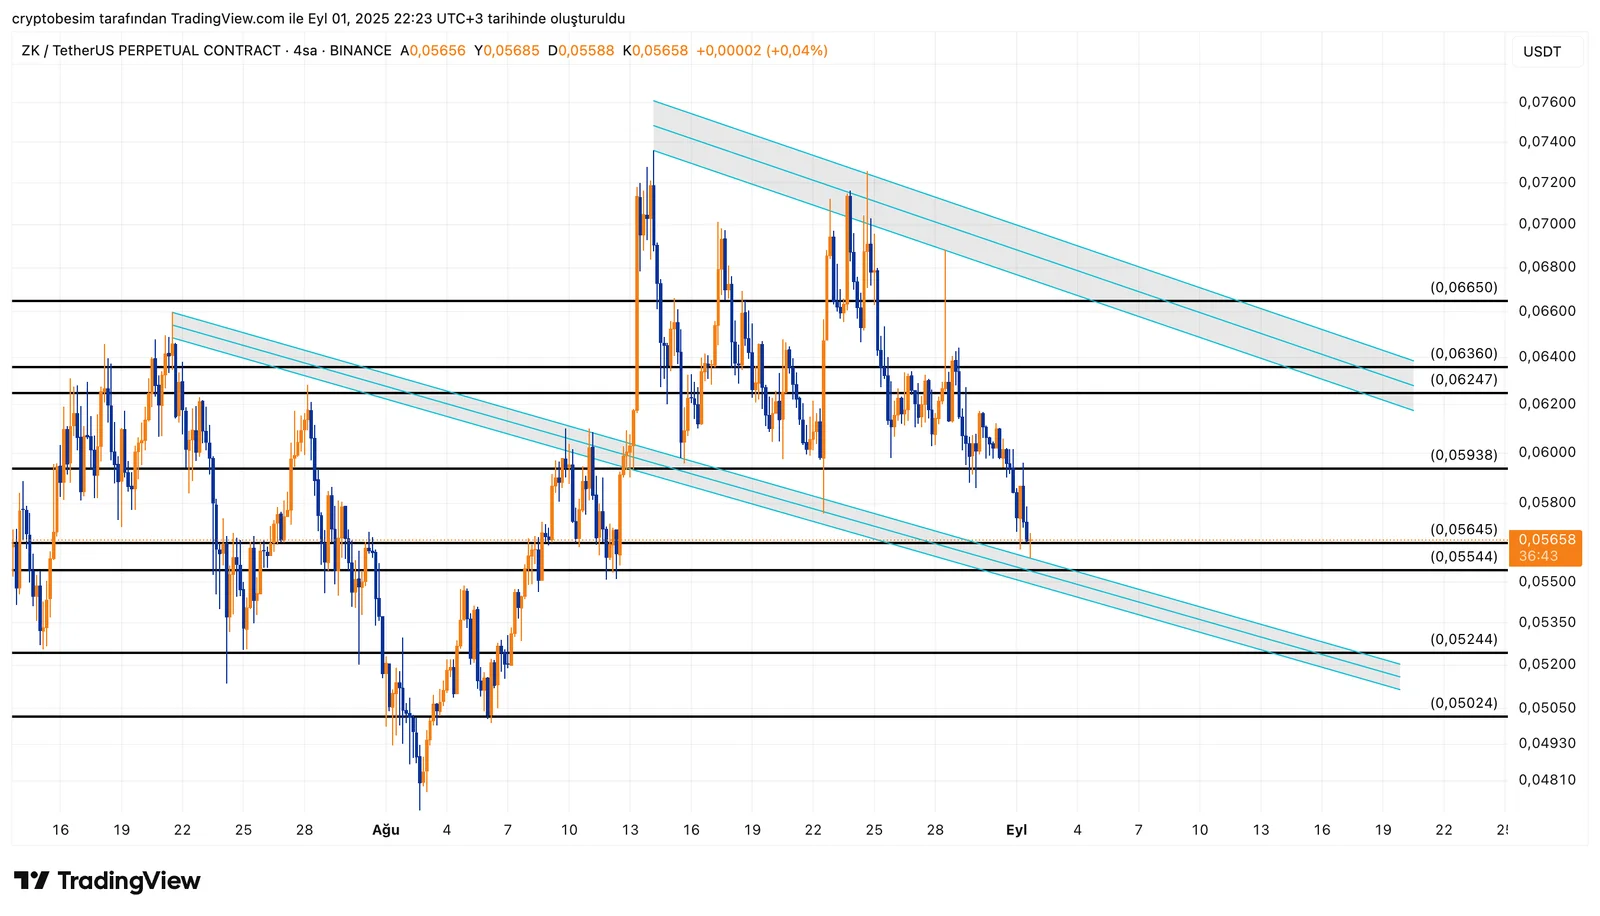
Short-term resistance levels:
- $0.059
- $0.062
- $0.066
The $0.066 zone is the key decision level, as it matches the upper band of the channel and also acts as strong horizontal resistance. A breakout above this area would confirm an upside break of the descending channel and could lead to stronger recovery.On the other hand, if the $0.055 support fails, the next important levels to watch are $0.052 and $0.050.
These analyses, not offering any kind of investment advice, focus on support and resistance levels considered to offer trading opportunities in the short and medium term according to the market conditions. However, the user is responsible for their own actions and risk management. Moreover, it is highly recommended to use stop loss (SL) during the trades.


