MOVE Comment and Price Analysis - September 3, 2025
MOVE/USDT Technical Analysis
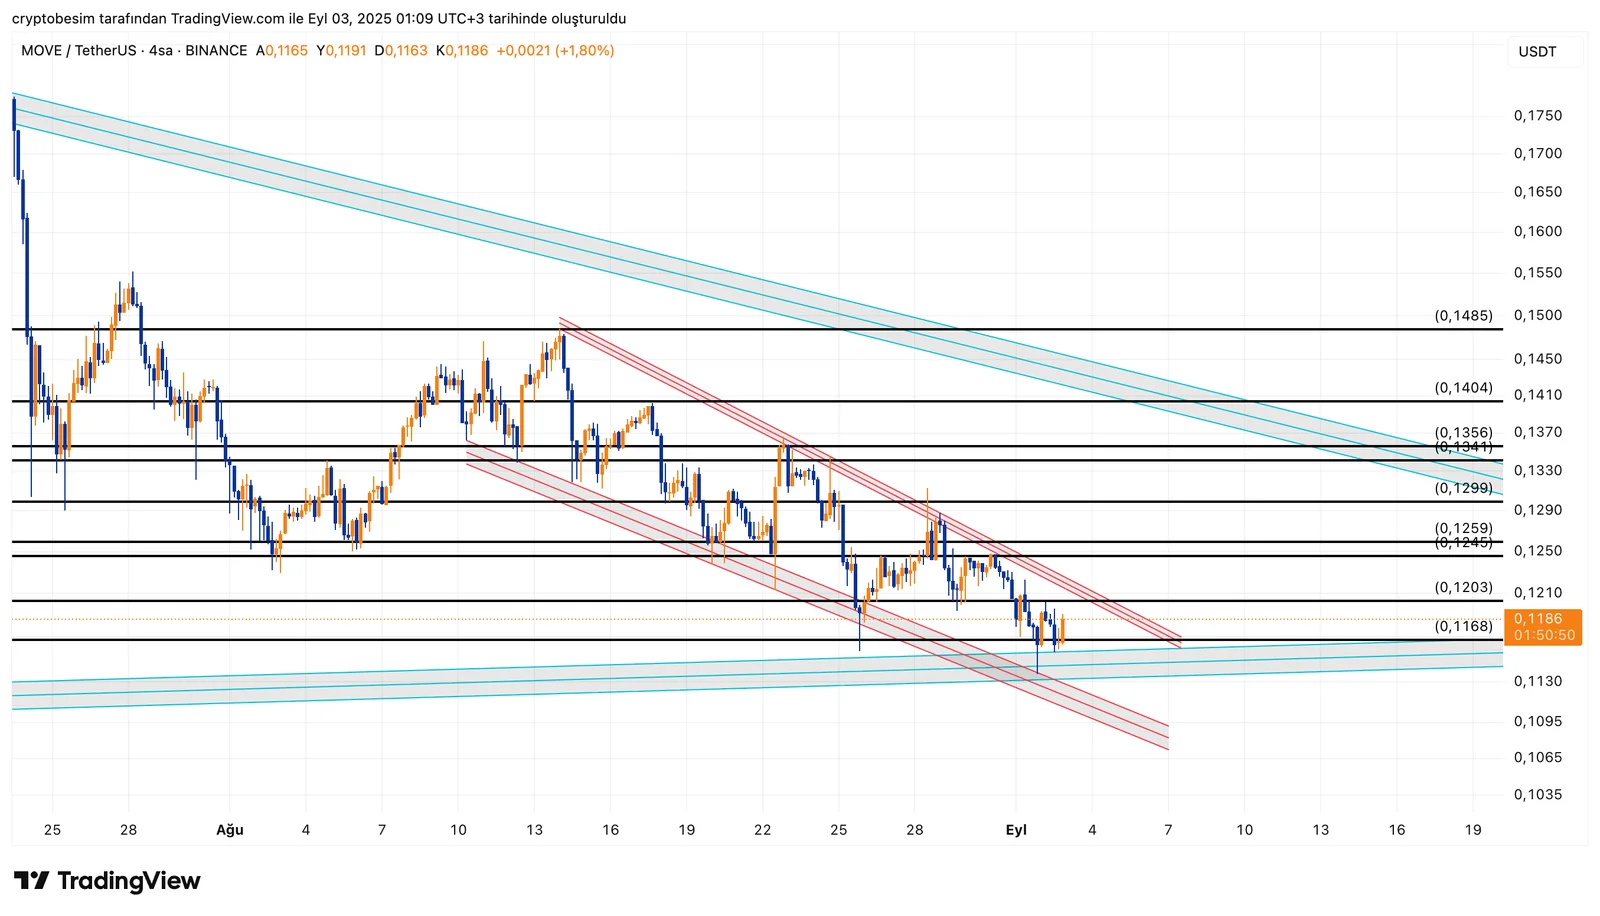
MOVE Bottom ThemeMOVE chart shows two patterns at the same time on the 4-hour timeframe. Blue trends show the main trend on the daily chart, while red trends show a short-term downward channel.The price is currently at an important daily support level, which also matches the lower line of the red downward channel. When these two levels meet, it can be an important signal for a possible price reversal.If the price breaks upwards from the red channel, the first target is $0.12 – $0.125. Moreover, if the price goes higher, the next target is $0.14 – $0.15.In short, MOVE is under short-term downward pressure, but daily support is holding. If this support holds strong, the price could break upwards and move toward $0.14 – $0.15.
These analyses, not offering any kind of investment advice, focus on support and resistance levels considered to offer trading opportunities in the short and medium term according to the market conditions. However, the user is responsible for their own actions and risk management. Moreover, it is highly recommended to use stop loss (SL) during the trades.