SUI Comment and Price Analysis - September 1, 2025

SUI Comment and Price Analysis - September 1, 2025

SUI/USDT Technical Outlook

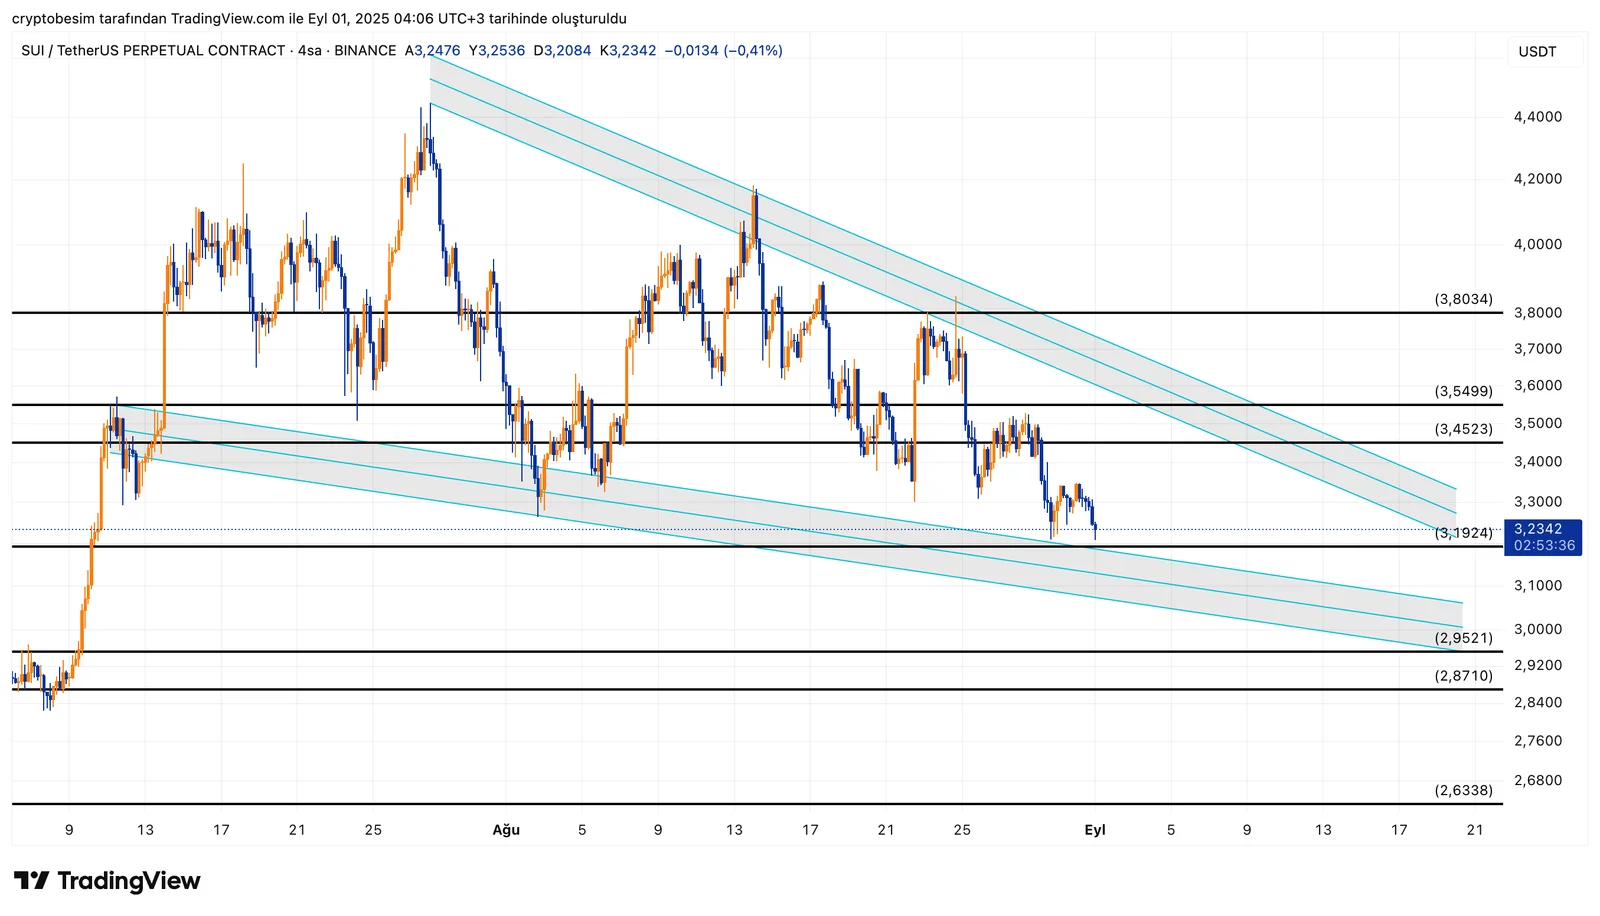
The SUI chart shows a clear falling wedge pattern. This pattern often leads to an upward breakout because the price is getting squeezed with lower highs and higher lows. As the price moves inside the narrowing range, a breakout is likely soon.

SUIUSDT.P_2025-09-01_04-06-24.png
Falling Wedge Formation
SUI is currently $3.23, close to the lower line of the wedge. The first important support is at $3.19. If the price stays above this, the outlook is positive. Below it, watch for strong supports at $2.95, $2.87, and $2.63.On the upside, the first resistance is around $3.45–$3.55. If the price goes above this, it may rise quickly to $3.80 and $4.00. The technical target of the pattern is around $4.30.In short, the falling wedge on SUI is still active. As long as the price stays above $3.19, the pattern is valid. If it breaks up, targets are $3.80–$4.00 first, then $4.30. If support is lost, the price may drop to $2.95–$2.63.

These analyses, not offering any kind of investment advice, focus on support and resistance levels considered to offer trading opportunities in the short and medium term according to the market conditions. However, traders are responsible for their own actions and risk management. Moreover, it is highly recommended to use stop loss (SL) during trades.

#suı#price#sept#Analysis#technical
Light mode logo
Do you have any questions?Feel free to send us your questions or request a free consultation.
© 2025 All rights reserved