
ZRO/USDT Technical Analysis
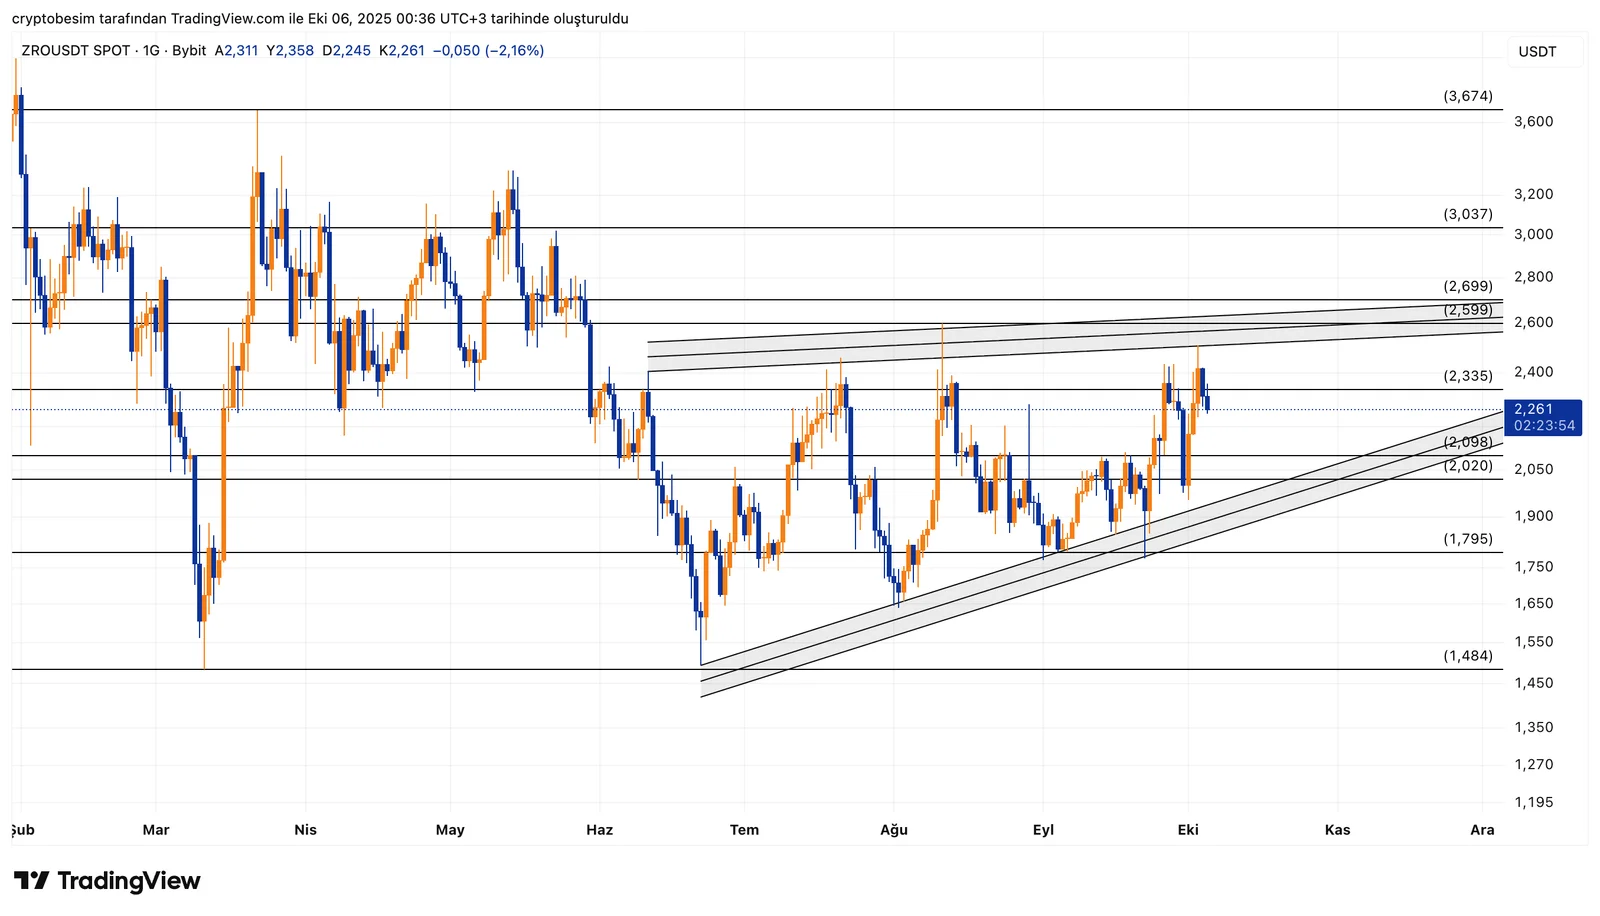
Analyzing the ZRO chart, we see a rising and tightening triangle formation, and the price of the coin has recently been trading inside this pattern with increasing compression. This may signal a potential bullish breakout.ZRO is currently trading around $2.26. The first strong resistance level ahead is $2.33 in the short term. ZRO could move toward the levels of $2.59 and $2.69 if the price can close above this short-term resistance. These levels are crucial as they align with both horizontal resistance and the triangle’s upper boundary. The zone between $3.03 and $3.67 would be the technical target of a potential triangle breakout.We should be watching the support area at $2.09–$2.02 in case of a downside scenario. The price of the coin may retreat to $1.79 if this support area breaks. This zone is also important as it serves as both horizontal and trendline support.
Key levels to follow:Resistance levels: $2.33 → $2.59 → $2.69 → $3.03 → $3.67Support levels: $2.09 → $2.02 → $1.79
These analyses, not offering any kind of investment advice, focus on support and resistance levels considered to offer trading opportunities in the short and medium term according to the market conditions. However, traders are responsible for their own actions and risk management. Moreover, it is highly recommended to use stop loss (SL) during trades.


