
ZK Technical Analysis
Analyzing the ZK chart on a daily time frame, we can clearly see that the coin is still moving inside a long-term downtrend channel. ZK hasn’t been able to break above the main trendline yet, despite some small recovery moves recently. Overall, it remains under selling pressure.
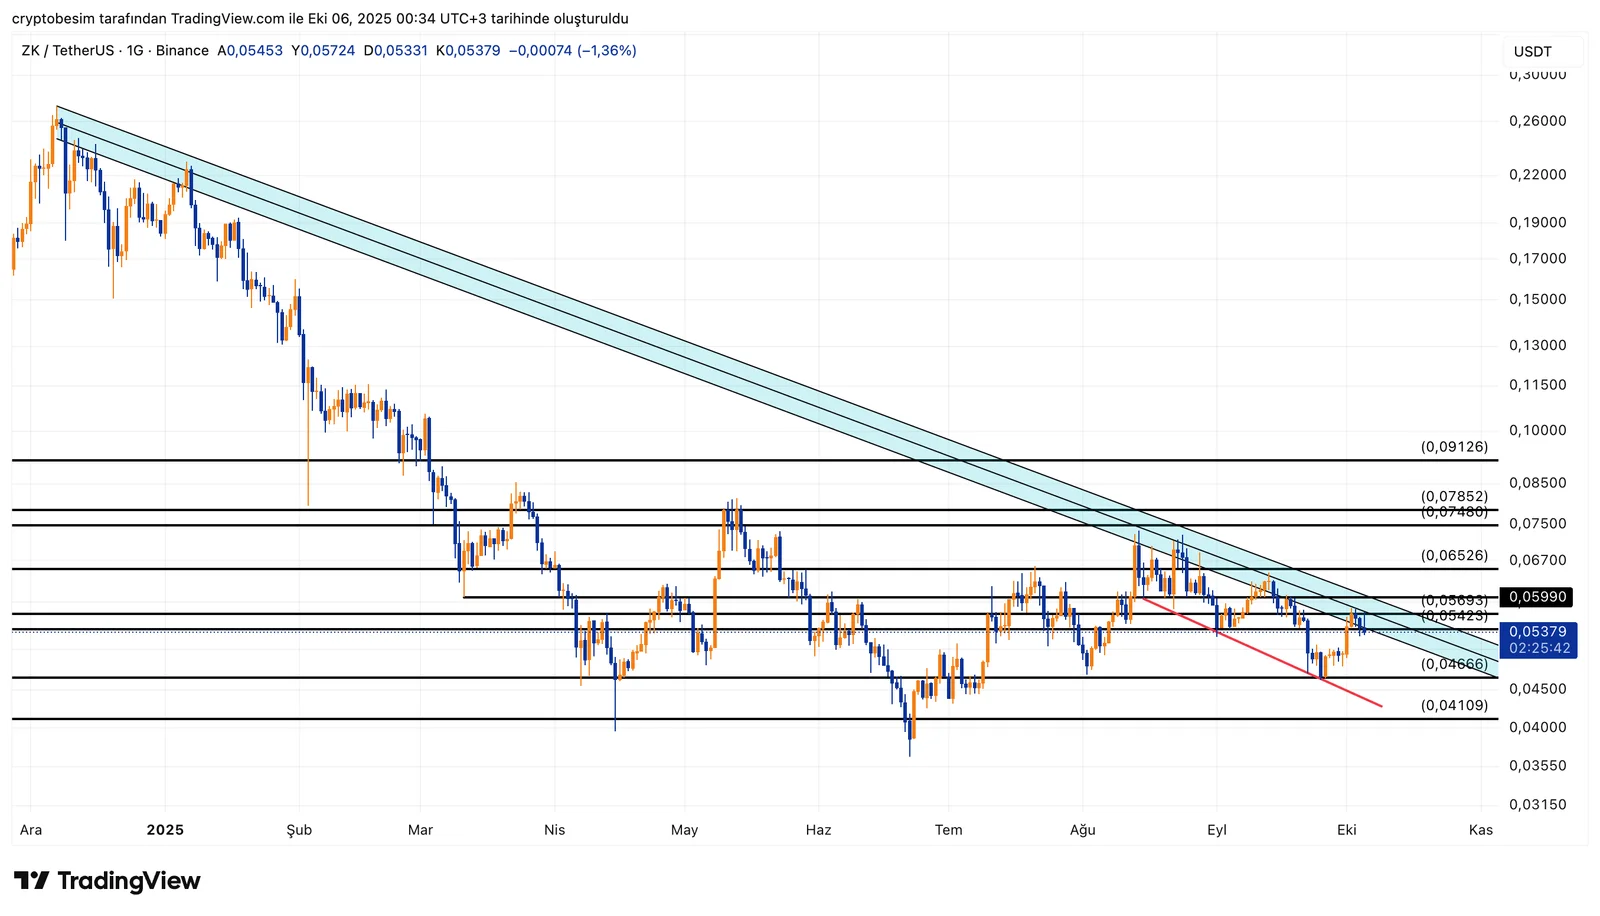
Key levels to follow:
- Resistance levels up: $0.059 → $0.065 → $0.078 → $0.091
- Support levels below: $0.054 → $0.046 → $0.041
These analyses, not offering any kind of investment advice, focus on support and resistance levels considered to offer trading opportunities in the short and medium term according to the market conditions. However, traders are responsible for their own actions and risk management. Moreover, it is highly recommended to use stop loss (SL) during trades.


