
XRP Technical Analysis
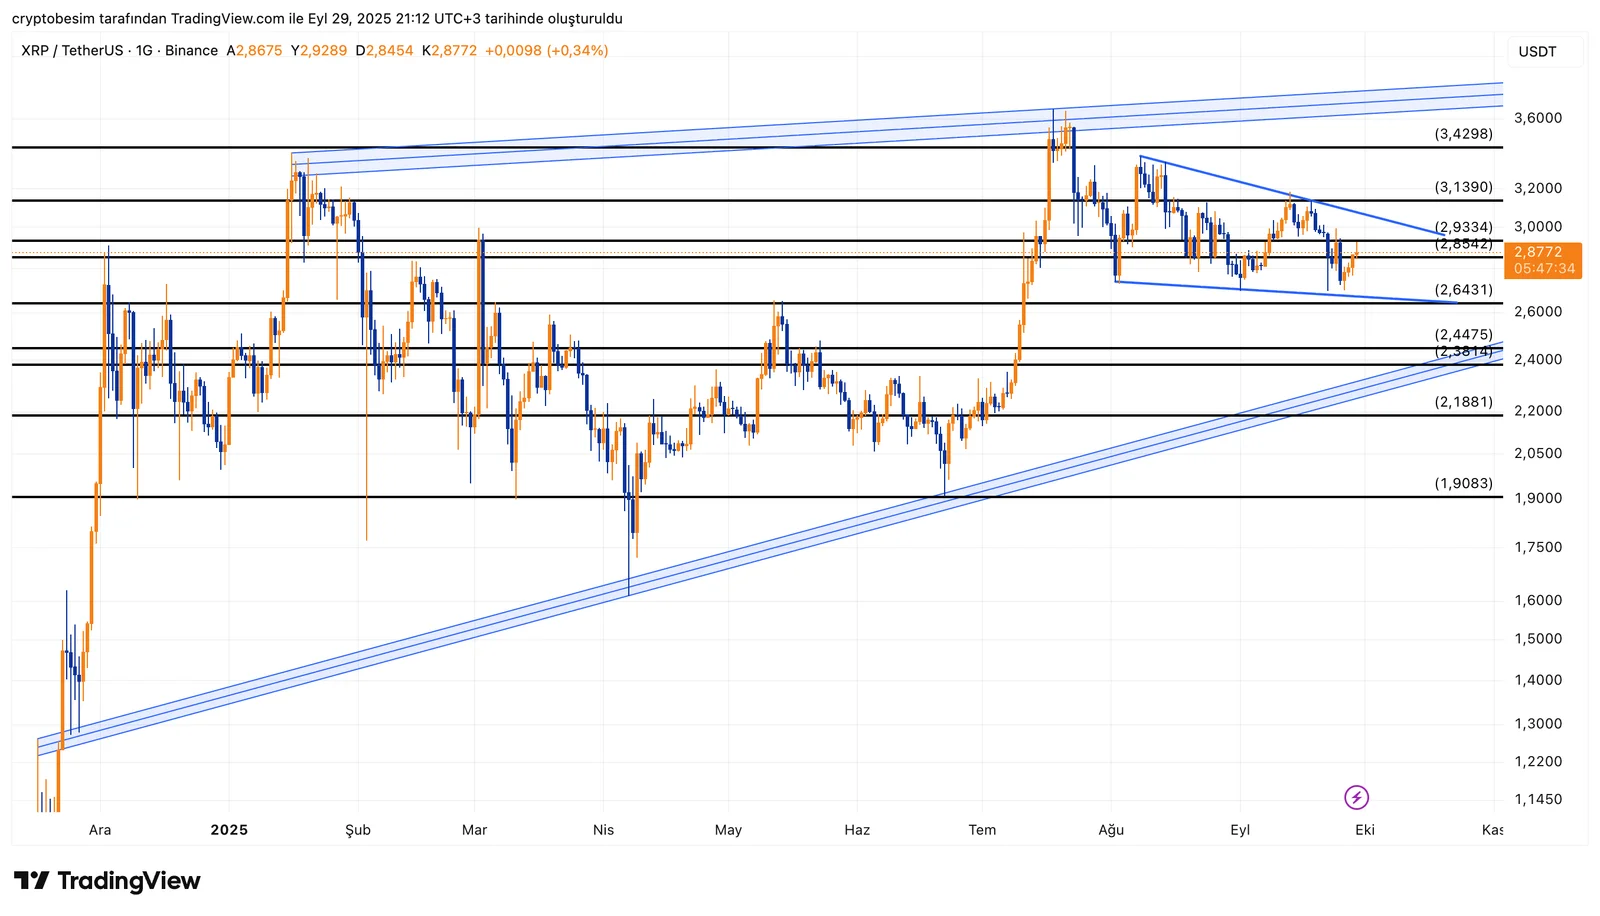
Analyzing XRP chart on a daily time frame, we see that the ascending channel pattern is still valid and working well. The price of the coin is trying to recover following a pullback starting around the level $3.42. The price is trading near the level at $3.01 currently and has approached key resistance levels again.
Short-term resistance levels ahead are $2.93 and $3.13. Above these levels, the price has the potential to move towards the upper border of the channel again — $3.42–$3.50.
According to a bearish scenario, the first strong support below is the range between the levels $2.85–$2.64. If this support level is lost, then the range $2.44–$2.38 and the lower border of the channel would be a potential reversal area. In case the channel pattern gets broken, sell pressure might get intense.
Summary:
- Current price: $3.01
- Key resistances: $2.93 and $3.13
- Support zone: $2.85–$2.64
- Upper border of the channel: $3.42–$3.50
- Last defense line: $2.44–$2.38
These analyses, not offering any kind of investment advice, focus on support and resistance levels considered to offer trading opportunities in the short and medium term according to the market conditions. However, traders are responsible for their own actions and risk management. Moreover, it is highly recommended to use stop loss (SL) during trades.


