
STRK/USDT Technical Analysis
Analyzing the STRK chart, we see that the price has recently broken above the symmetrical triangle formation, signaling a shift in trend direction and short-term momentum. It is currently trading around $0.1509, trying to hold above the breakout area.
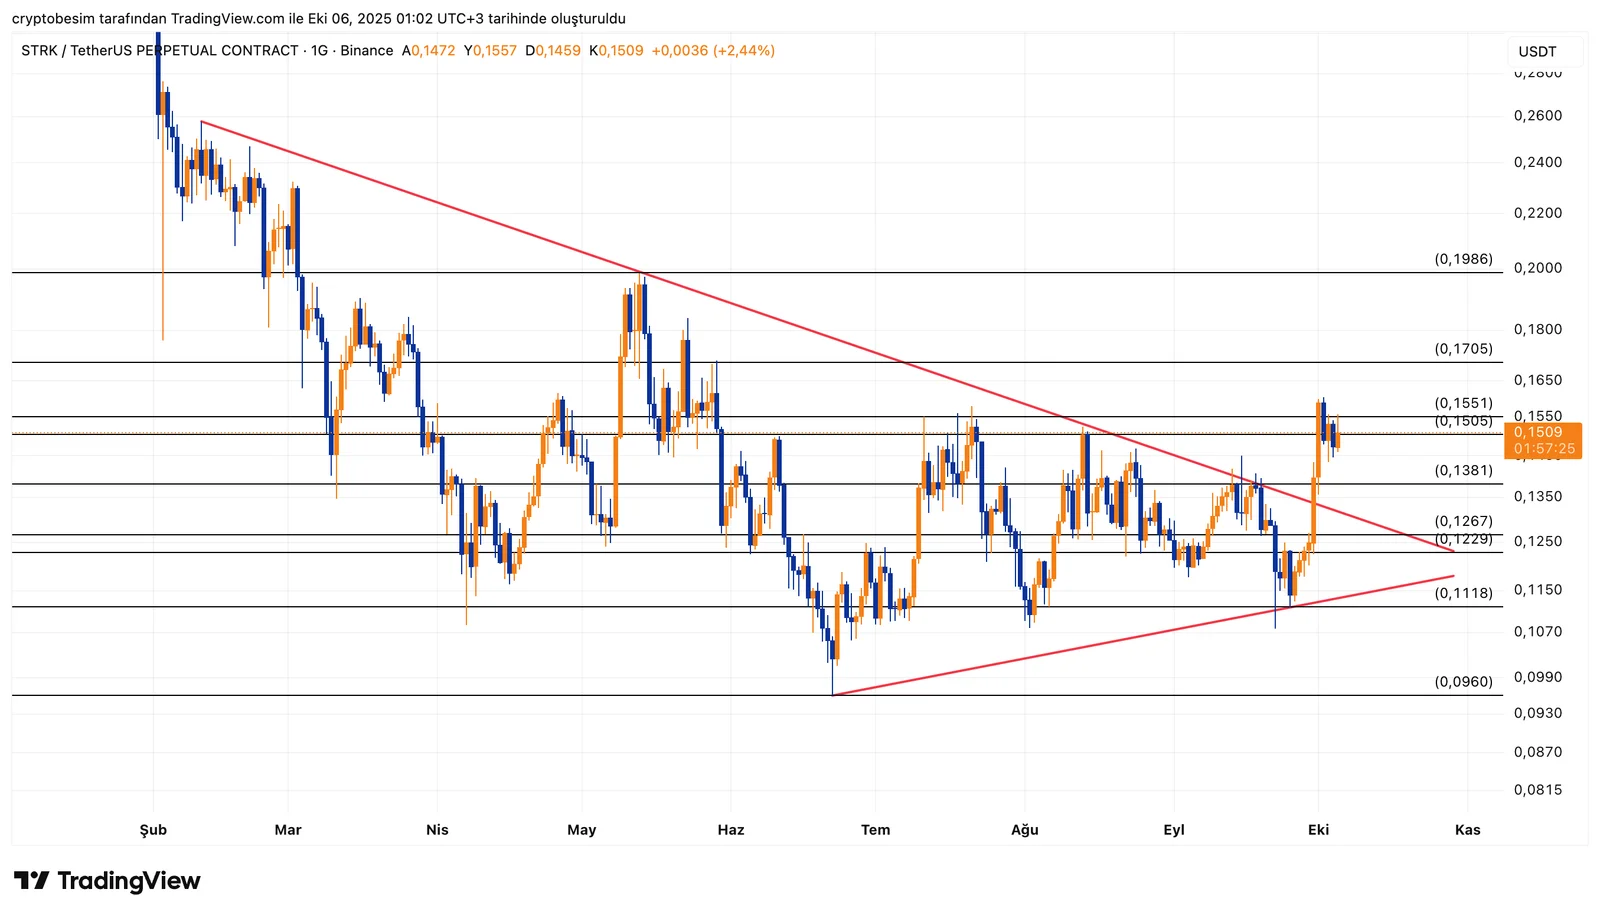
According to a bullish scenario, the area between $0.155 and $0.170 stands as the first resistance to follow. Holding above this resistance, the price may continue its upward move toward $0.198. Based on the height of the triangle, the technical target in the medium term lies between $0.23 and $0.25.
In case of a downward correction, the level at $0.126—aligning with the upper border of the broken triangle—would act as a key support. It is crucial for the price to bounce from here to keep the breakout valid, as this support could serve as a retest zone. If this level fails, the next support to follow would be $0.111.
To summarize: STRK has turned bullish after breaking out of its triangle formation. A move toward $0.17, $0.19, and possibly $0.23 is quite possible as long as the price holds above $0.126.


