Politics
This page lists the latest Politics news and market analysis. Browse articles, expert insights, and updates in this category on JrKripto. Stay informed with in-depth coverage of cryptocurrency trends and developments.
News
Politics News
Politics News
Browse all Politics related articles and news. The latest news, analysis, and insights on Politics.
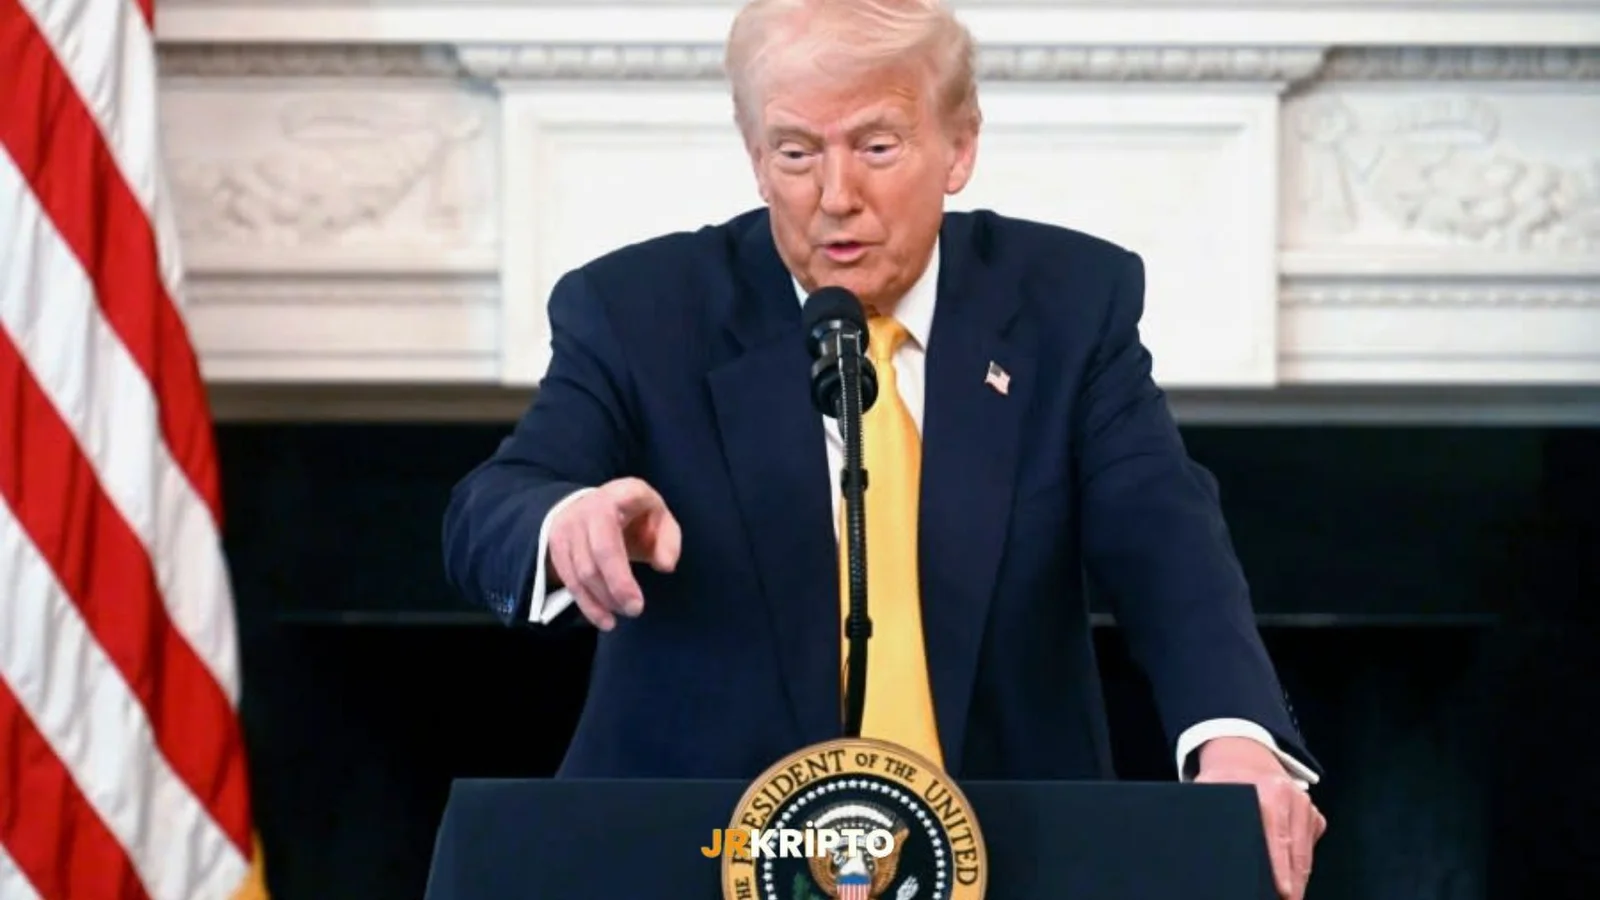
Critical Statements from Trump on Global Economy and Trade
U.S. President Donald Trump set the agenda today with his statements on both foreign trade policies and his evaluations of the markets. Beginning his speech with the words "Today is a very special day," Trump announced agreements signed with Ukraine and the United Kingdom.Agreements with Ukraine and the United KingdomTrump stated that a significant agreement was signed between the U.S. and Ukraine in the field of rare earth elements. It was emphasized that this agreement holds great importance in terms of reducing the U.S.'s dependence on foreign sources for critical minerals and strengthening access to strategic resources.In addition, he announced that a "groundbreaking" trade agreement had been reached with the United Kingdom. Under the new agreement, U.S.-origin products will pass through British customs more quickly and easily. Trump said this arrangement would create significant advantages for U.S. exporters.Global Trade Talks Gain MomentumTrump noted that many countries around the world currently want to make trade deals with the U.S. Emphasizing America's central role on the trade stage, he said, “There are many scheduled meetings. Every country wants to make a deal with us.”Drawing particular attention to negotiations with China, Trump said, “China is eager to make a deal.” He gave the message that if the talks progress positively, tariffs on China could be reduced. This statement sent positive signals to the markets that trade tensions between the two countries could ease.Clear Message to the Markets: Now Is the Time to BuyIn his assessments of the economy, Trump stated that the U.S. continues strongly even without interest rate cuts. However, he also added that possible rate cuts would be a significant driving force for the markets.Saying, “Now is exactly the time to buy stocks,” Trump claimed that the stock markets would experience a significant rise in the near future. With the expression, “The stock market is really going to rally now,” he gave a direct message to investors.Today’s statements carry important clues regarding the U.S.'s global trade moves and economic policies. Both in terms of international agreements and market guidance, Trump’s speech is being closely followed by investors and global actors. With progress in trade negotiations and potential interest rate cuts, we may be on the brink of a new era in global markets.
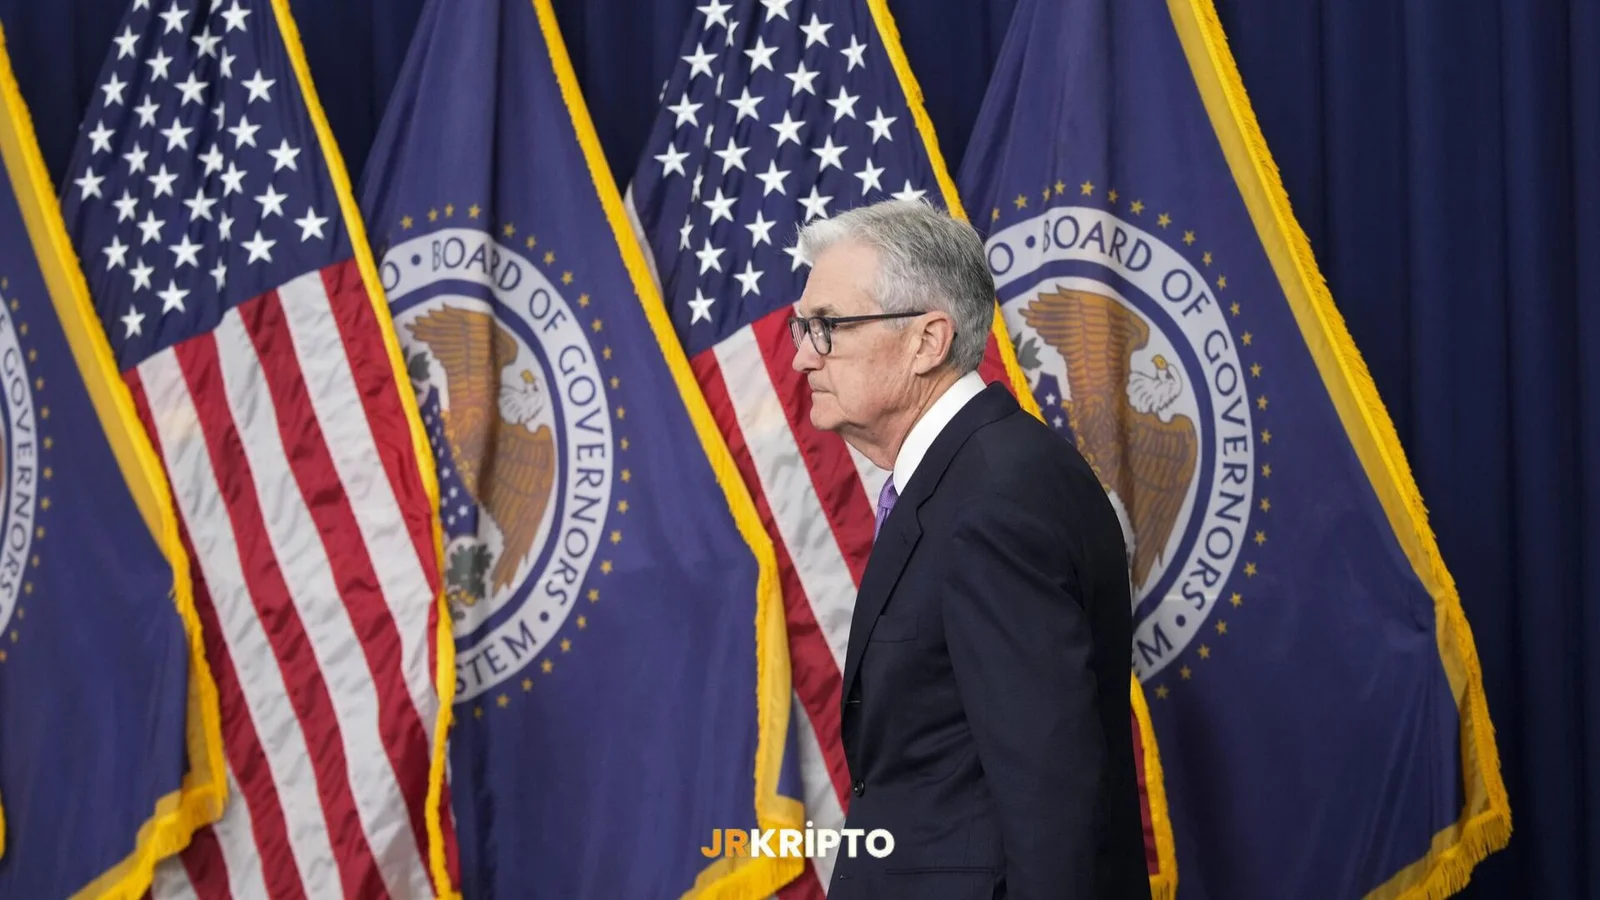
Balanced Message from Powell: Is the Fed Preparing the Ground for June?
On the evening of May 7, 2025, the U.S. Federal Reserve (Fed) kept its policy rate steady at the 4.25–4.50% range. However, what markets were really curious about were the statements made by Fed Chair Jerome Powell following the meeting. Powell, in a cautious yet optimistic tone, signaled the beginning of a new era in monetary policy.Emphasis on "Data-Driven Flexibility" Instead of "Wait and See"Powell stated that the U.S. economy remains strong but noted that upward risks persist on both the inflation and unemployment fronts. He emphasized that despite the slowdown in inflation, concerns about its persistence continue. Nevertheless, he delivered a message of flexibility in monetary policy: he said the Fed will continue to evaluate its decisions in light of current data. This statement keeps the possibility of a rate cut at the June meeting alive.Laying the Groundwork for JuneA recent statement by Cleveland Fed President Beth Hammack, saying "May is too early, but June is seriously on the table," aligns with Powell's message. Market pricing has also taken shape in this direction. Interest rate futures indicate that a 25 basis point cut in June has gained significant probability.Dynamics Between the Trump Administration and the FedPowell, in response to President Trump's explicit calls for a rate cut, emphasized the Fed’s independence. By saying “We base our decisions on data and analysis,” he maintained a balanced stance against political pressure. Still, it appears that the Trump administration expects a rate cut to support growth as inflation declines. This political pressure is one of the factors increasing market expectations for June.Markets and Risk Assets Gain StrengthThere was no sharp correction in markets following the Fed’s decision to hold rates steady. On the contrary, with uncertainty diminishing and expectations of easing in the summer, risk appetite has increased. Gold tested the $3,300 level. A recovery trend was observed in Bitcoin and tech stocks. Especially the retreat in bond yields shows that investors are repositioning.Powell Cautious, Market HopefulPowell’s remarks suggest that the Fed may be creating room to maneuver for a rate cut in the summer. Even if May was a pause, a clear “preparation period” atmosphere has formed for the June meeting. If the downward trend in inflation continues and more signs of slowing growth emerge, summer 2025 could begin with a rate cut.Balances in the economy remain delicate, but the Fed’s clear messaging is being seen as a positive step for markets.
Daily Market Summary with JrKripto 8 May 2025
Daily Market Insights with JrKripto: Global & Local Financial HighlightsWelcome to today’s edition of “Daily Market Insights with JrKripto,” where we break down the most important developments across global and local financial markets. Let’s dive into the broader market landscape and take a closer look at the latest evaluations.Bitcoin (BTC) Price UpdateBitcoin (BTC) is currently trading at $99,700, following a strong upward trend that began at the $75,930 support level. This rally has pushed BTC above the critical $95,000–$96,000 resistance zone, bringing it within striking distance of the psychological $100,000 mark.Should BTC decisively break above $100,000 with strong volume, the next potential targets lie at $101,000 and higher. However, any profit-taking in this region could lead to a pullback, with the $95,000–$96,000 range now acting as the first support. Below that, $94,000, $90,500, and $86,500 will serve as key levels to watch.Ethereum (ETH) Price MovementEthereum (ETH) has climbed to $1,940, extending its rally from the $1,486 level. The coin has successfully tested above both $1,888 and $1,900, displaying strong technical momentum. If the upward trend continues, the immediate target is the psychological $2,000 resistance.A breakout above $2,000 could pave the way to the next resistance levels at $2,277 and $2,428. On the downside, $1,888remains the first major support. A drop below that level would shift attention to $1,790 and $1,700. Holding above $1,888 is crucial for ETH to maintain its bullish structure.Top Crypto HeadlinesFederal Reserve Holds Rates Steady – Investors are pricing in three rate cuts this year.Tether Mints $1 Billion in USDTBessent Announces China Negotiations to Start SaturdayEthereum’s Pectra Upgrade Complete – Featuring 11 Ethereum Improvement Proposals (EIPs), this is the most significant update since the 2022 Merge.Crypto Market MoversTop Gainers:MOG → +43.8% to $0.3662PENGU → +27.9% to $0.0143SAFE → +22.5% to $0.5617IBERA → +20.1% to $3.32EOS → +18.4% to $0.8471Top Losers:LAYER → -28.0% to $1.28VENOM → -7.8% to $0.1177OM → -6.5% to $0.3637SYRUP → -6.1% to $0.2226MX → -1.9% to $2.74Fear Index:Bitcoin: 65Ethereum: 54Dominance:BTC: 65.14% ▼ 0.33%ETH: 7.64% ▲ 3.04%Daily Net ETF Flows:BTC ETFs: +$142.3METH ETFs: -$21.8MKey Economic Data to Watch Today15:30 – U.S. Initial Jobless ClaimsForecast: 231K | Previous: 241KGlobal Markets OverviewDespite post-Fed meeting volatility, U.S. equities closed higher thanks to reports suggesting Donald Trump may ease export restrictions on the chip sector.The Federal Reserve kept its policy rate unchanged at 4.25%–4.50%, in a unanimous decision. While recent economic data points to robust growth, inflation remains elevated. The Fed highlighted ongoing uncertainties in the economic outlook and reiterated a data-dependent stance for future rate decisions.Fed Chair Jerome Powell stated that the central bank is well-positioned to “wait and see,” and is in no rush to change rates. Following his remarks, markets initially wavered but rebounded on Trump’s export news. Trump also hinted at a major trade announcement, likely involving the UK.Market Performance:S&P 500: +0.43%Dow Jones: +0.70%Nasdaq: +0.27%Best-performing sectors included consumer discretionary (+1.02%), tech (+0.91%), healthcare (+0.81%), and finance (+0.62%), while telecom (-1.84%), materials (-0.50%), and real estate (-0.02%) lagged.Asian markets are opening strong today, and European indexes are expected to follow with positive momentum.U.S. Tech Giants: Market Cap & Stock PriceMicrosoft (MSFT): $3.22T | $433.35 ▲ 0.01%Apple (AAPL): $2.93T | $196.25 ▼ 1.14%NVIDIA (NVDA): $2.85T | $117.06 ▲ 3.10%Amazon (AMZN): $2.00T | $188.71 ▲ 2.00%Alphabet (GOOG): $1.84T | $152.80 ▼ 7.51%Borsa Istanbul (BIST) UpdateThe BIST100 index closed around 1% lower yesterday, impacted by geopolitical tensions and growth concerns. Aviation, steel, and petrochemical stocks faced heavy selling, while defense and retail sectors outperformed.Fitch Ratings commented in a recent webinar that it does not expect further rate hikes from Turkey’s central bank. However, it warned of a reassessment of Turkish banks if domestic price volatility continues.As Q1 2025 earnings season winds down, weak corporate results may continue to weigh on BIST. All eyes are now on Finance Minister Mehmet Şimşek’s upcoming meetings with international investors.Technical Outlook:Support: 9044 – 8870 – 8725 – 8618Resistance: 9266 – 9475/9490 – 9594 – 9740 – 9895 – 9953Consolidation around current levels could lead to a rebound, but a drop below key support might accelerate downside risk toward the 8500 region.Top Companies on BIST by Market CapQNB Finansbank (QNBTR): ₺890.26B | ₺268.75 ▲ 1.13%Aselsan (ASELS): ₺657.55B | ₺158.00 ▲ 9.57%Garanti Bank (GARAN): ₺419.58B | ₺99.95 ▲ 0.05%Turkish Airlines (THYAO): ₺384.68B | ₺284.50 ▲ 2.06%ENKA (ENKAI): ₺363.14B | ₺62.40 ▲ 0.73%Precious Metals & Exchange RatesGold: ₺4,229Silver: ₺40.73Platinum: ₺1,228USD/TRY: ₺38.65EUR/TRY: ₺43.84See you again tomorrow with more updates and market insights!

May Interest Rate Decision Is Being Announced: Eyes Are on Powell's Statement
U.S. Federal Reserve Expected to Hold Rates Steady on May 7, 2025, as Attention Turns to JuneThe U.S. Federal Reserve (Fed) is widely expected to keep its policy rate unchanged at its May 7 meeting. However, all eyes are now on June. Recent economic data, market pricing, and political pressures are increasing the likelihood of a rate cut as summer approaches.Hammack Sends a Clear SignalThe Fed has held interest rates steady in the 4.25%–4.50% range for the past two meetings. While inflation data suggests a mild cooling, signs of weakening economic growth are also emerging. Cleveland Fed President Beth Hammack said May is too early for a rate cut, but referred to June as a potential turning point.Powell to Speak: His Messages Will Be CrucialFed Chair Jerome Powell’s statements today will play a key role in shaping market sentiment. With his usual “data-dependent” language, Powell is expected to signal that a rate cut window could open in June. However, he may also adopt a selective tone without fully committing.Trump Sends a Clear Message to the Fed: “Cut Rates”U.S. President Donald Trump has made interest rate cuts a central focus of his economic policy. A statement from the White House emphasized, “Prices are falling, energy is getting cheaper, the Fed should cut rates now.” Having won the 2024 election, Trump aims to establish a growth model driven by employment and investment.What Are Markets Expecting?Markets had already priced in a pause at the May meeting. However, interest rate futures for June now reflect a strong probability of a 25 basis point cut. Assets like gold, Bitcoin, and the Nasdaq have already responded positively to this expectation.June Could Be a Turning PointThe June 17–18 meeting is shaping up to be a pivotal moment for 2025. With inflation momentum slowing and the labor market softening, the first signals of a rate cut could be delivered.If the Fed announces today that it is holding rates steady, it will come as no surprise. The real focus will be on Powell’s nuanced remarks. Any potential rate cut in June will be a key indicator of the direction of the U.S. economy and global market risk sentiment.
The US and China, Ending Trade Tensions China Is Sitting at the Table in Geneva
U.S. Treasury Secretary Scott Bessent to Begin Major Trade Talks with China on Saturday, May 9U.S. Treasury Secretary Scott Bessent announced that they will begin a highly significant round of trade negotiations with China on Saturday, May 9. The meetings, set to take place in Geneva, aim to ease the harsh tariffs and years-long trade war between the two countries.During these first official talks, the U.S. will be represented by Bessent and Trade Representative Jamieson Greer, while China will be represented by Vice Premier He Lifeng. The two sides are expected to discuss the gradual reduction of trade barriers, including U.S. tariffs that have reached up to 145% and China's retaliatory tariffs of up to 125%.Bessent: “Tariffs Are Unsustainable”Bessent emphasized that these talks should be considered preliminary negotiations for now. “The current tariffs are unsustainable for both sides. Prolonging them only increases economic uncertainty,” he stated.Since the beginning of 2025, under President Trump’s direction, the U.S. intensified its trade pressure with tariffs as high as 145% across various sectors, from steel to electronics. China responded with equivalent retaliatory measures, making it more difficult to import U.S. agricultural products, energy, and manufactured goods.Geneva Talks: Just the BeginningThe Chinese Ministry of Commerce said they responded positively to the U.S. invitation for talks, but emphasized that progress would depend on mutual respect. China sees these discussions as a stabilizing step in the face of internal economic pressures and high inflation.These negotiations are considered the first concrete step toward easing the intensifying trade war between the U.S. and China. However, experts believe that while the talks may produce a roadmap, a comprehensive agreement will require much more diplomatic effort over time.Global Impact: Can Markets Breathe Easier?Easing trade tensions is critical not just for the two nations involved, but for the global economy as a whole. Disruptions in supply chains and volatility in energy and steel prices have created uncertainty in markets. That’s why the Geneva talks are being closely watched by global stock and commodity markets alike.In conclusion, this diplomatic step led by Bessent offers hope that diplomacy and compromise may once again take precedence in a world where economic conflicts have replaced hot wars.
Daily Market Summary with JrKripto 7 May 2025
You can find today’s edition of “Daily Market with JrKripto,” where we compile the most important developments in global and local markets, below. Let’s analyze the general market conditions together and take a look at the latest assessments.Bitcoin (BTC) is currently trading at $97,000. With a strong upward trend that started from the $75,930 support, BTC has surpassed the $95,000–$96,000 resistance zone and continues to gain upward momentum. If this movement continues, the next target could be the $101,000 level. However, in case of profit-taking, the $94,000–$95,000 range can be monitored as the first support zone. If this level is breached, $90,500 and then $86,500 will be the next key support levels to watch.Ethereum (ETH) is trading at $1,830. The recovery process that began from the $1,486 support has lifted ETH back above the $1,800 level. If the upward move continues, the $1,888 and $1,950 levels could act as resistance. However, if the price pulls back from $1,830, the first support is at $1,790. If it remains below this level, $1,700 could come into play as strong support. For ETH to maintain its upward trend, holding above the $1,790 level is critically important.Crypto NewsTrump: "I will make an announcement that will shake the world."Trump on China: "They want to negotiate."Bitwise filed a spot ETF application for NEAR.The U.S. and U.K. are expected to sign a new trade deal this week.The Governor of New Hampshire signed a bill allowing the state to invest in Bitcoin and cryptocurrencies.Standard Chartered Bank forecasts $BNB will reach $2,775 by 2028.Chinese President Xi: "We are ready to work with EU leaders to broaden mutual openness and handle frictions and disputes appropriately."Top Gainers in CryptoKAITO → up 49.9% to $1.25SYRUP → up 26.9% to $0.2388CVX → up 14.4% to $3.14STX → up 12.7% to $0.8553LTC → up 12.0% to $91.79Top Losers in CryptoMOVE → down 17.9% to $0.1573VIRTUAL → down 17.4% to $1.36LAYER → down 8.7% to $1.78FARTCOIN → down 7.8% to $1.02FRAX → down 6.0% to $2.00Fear IndexBitcoin: 62Ethereum: 43DominanceBitcoin: 65.25% ▼ 0.03%Ethereum: 7.50% ▲ 0.68%Daily Net ETF FlowsBTC ETFs: -$85.70 MillionETH ETFs: -$17.90 MillionData to Watch Today17:30 – U.S. EIA Crude Oil InventoriesForecast: -1.700M | Previous: -2.696M21:00 – FOMC Statement21:00 – Interest Rate DecisionForecast: 4.50% | Previous: 4.50%21:30 – FOMC Press ConferenceGlobal MarketsThe day began with escalating tensions between Pakistan and India turning into active conflict. Reports indicate missile strikes, downed aircraft, and casualties. As both countries are nuclear powers, this conflict raises serious global concerns. Although markets are currently unresponsive, further escalation could negatively impact global markets.This morning, the focus in global markets is on the U.S.–China tariff talks planned in Switzerland. Optimism prevails with hopes that these negotiations might ease trade wars. U.S. and European futures, along with most Asian markets (excluding India), are trading positively. While Asian indices are seeing strong buying, European markets are expected to open flat but positive.In the U.S., the 9-day rally driven by optimism over tariffs has ended. Trump's newly announced tax policies targeting the film and pharmaceutical industries have dampened investor appetite. Furthermore, the announcement that U.S. Treasury Secretary Scott Bessent will meet China’s Deputy Prime Minister in Switzerland between May 9–12 will be closely watched.U.S. indices dropped yesterday:S&P 500: -0.77%Dow Jones: -0.95%Nasdaq: -0.87%Only infrastructure (+1.23%) and energy (+0.10%) sectors posted gains among the 11 sectors of the S&P 500. Healthcare suffered the biggest loss, falling by 2.76%. The industrials and consumer discretionary sectors both declined by 0.85%.The U.S. also released trade data for March. The trade deficit widened by $17.3 billion to $140.5 billion. Most of this increase came from a $16.5 billion rise in the goods deficit. The services surplus decreased by $800 million. While exports remained unchanged, imports rose by 4.4% in anticipation of expected tariff hikes in April.Today, all eyes are on the Fed's interest rate decision. No change is expected in the rate. However, investors will closely monitor the pace of balance sheet reduction, long-term rate projections, and the Fed’s forward guidance signaled during the March meeting.Meanwhile, oil prices have begun to recover, driven by lower-than-expected crude inventory data and a downward revision of production forecasts by the International Energy Agency due to lower prices. This has supported energy sector performance.In general, markets today are navigating between optimism over U.S.–China talks, cautious pricing ahead of the Fed meeting, and the influence of geopolitical developments.Most Valuable Companies and Stock PricesMicrosoft (MSFT): $3.22T market cap, $433.31/share, ▼ 0.66%Apple (AAPL): $2.96T market cap, $198.51/share, ▼ 0.19%NVIDIA (NVDA): $2.77T market cap, $113.54/share, ▼ 0.25%Alphabet (GOOG): $1.99T market cap, $165.20/share, ▼ 0.51%Amazon (AMZN): $1.96T market cap, $185.01/share, ▼ 0.72%Borsa IstanbulDespite some mild buying yesterday, momentum in Borsa Istanbul remains weak. High interest rates, poor corporate earnings, and ongoing political risks continue to pressure the market. Retail and aviation stocks underperformed on concerns about weakening domestic demand. On the other hand, buying in banking, real estate investment trusts (REITs), mining, and defense stocks provided limited support to the index. Nevertheless, the BIST 100 index closed the day flat at 9,135 points. The intraday high was 9,228 points.Movements in both directions remain limited. Technically, the 9,044–8,870 range is still a strong support zone, consistent with previous lows. If the index holds in or just above this range, a continued rebound is possible. But a break below it could increase selling pressure and push the index down to 8,618–8,500. On the upside, initial resistance lies at 9,266. If this is breached, the 9,490–9,594 range is a key resistance zone. If this range is surpassed, the index may target 9,740–9,895–9,953 in the short term.On the macroeconomic side, TÜİK’s seasonally adjusted data shows monthly inflation rose slightly from 2.61% in March to 2.65% in April. Core inflation indicators (B and C indexes) accelerated to 2.84% and 3.02%, respectively, from 1.94% and 2.25% in March. Monthly increases in services hit 3.15%, while goods prices slightly declined (2.41%). Non-energy, non-food goods prices rose from 2.30% to 2.61%, largely due to currency effects.The CPI-based Real Effective Exchange Rate (REER) dropped 2.1% in April, reaching its lowest point since October 2021. This decline was driven by the Turkish lira’s depreciation—2.8% against the dollar and 7% against the euro. However, on an annual basis, REER remains at 11.6%, still indicating a zone of real appreciation.The Treasury borrowed a total of 35.3 billion TL yesterday through auctions, including non-competitive bids. In the 2-year fixed coupon bond auction, the average compound interest rate came in at 47.19%.Central Bank Governor Fatih Karahan stated in his presentation to the Turkish Parliament’s Planning and Budget Committee that current reserves are insufficient compared to short-term external debt and emphasized ongoing efforts to boost reserves.Also today, international credit rating agency Fitch will hold a webinar titled “Turkey’s Credit Outlook and Banking Sector.”Most Valuable Companies on Borsa IstanbulQNB Finansbank (QNBTR): 891.1B TL market cap, 267.75 TL/share, ▲ 0.66%Aselsan (ASELS): 626.54B TL market cap, 145.30 TL/share, ▲ 5.75%Garanti Bank (GARAN): 426.72B TL market cap, 101.50 TL/share, ▼ 0.10%Turkish Airlines (THYAO): 402.62B TL market cap, 289.50 TL/share, ▼ 0.77%ENKA Construction (ENKAI): 375.16B TL market cap, 63.10 TL/share, ▼ 1.41%Precious Metals and Exchange RatesGold: 4,199 TLSilver: 40.73 TLPlatinum: 1,228 TLDollar: 38.64 TLEuro: 43.90 TLWe’ll see you again tomorrow with the latest updates!

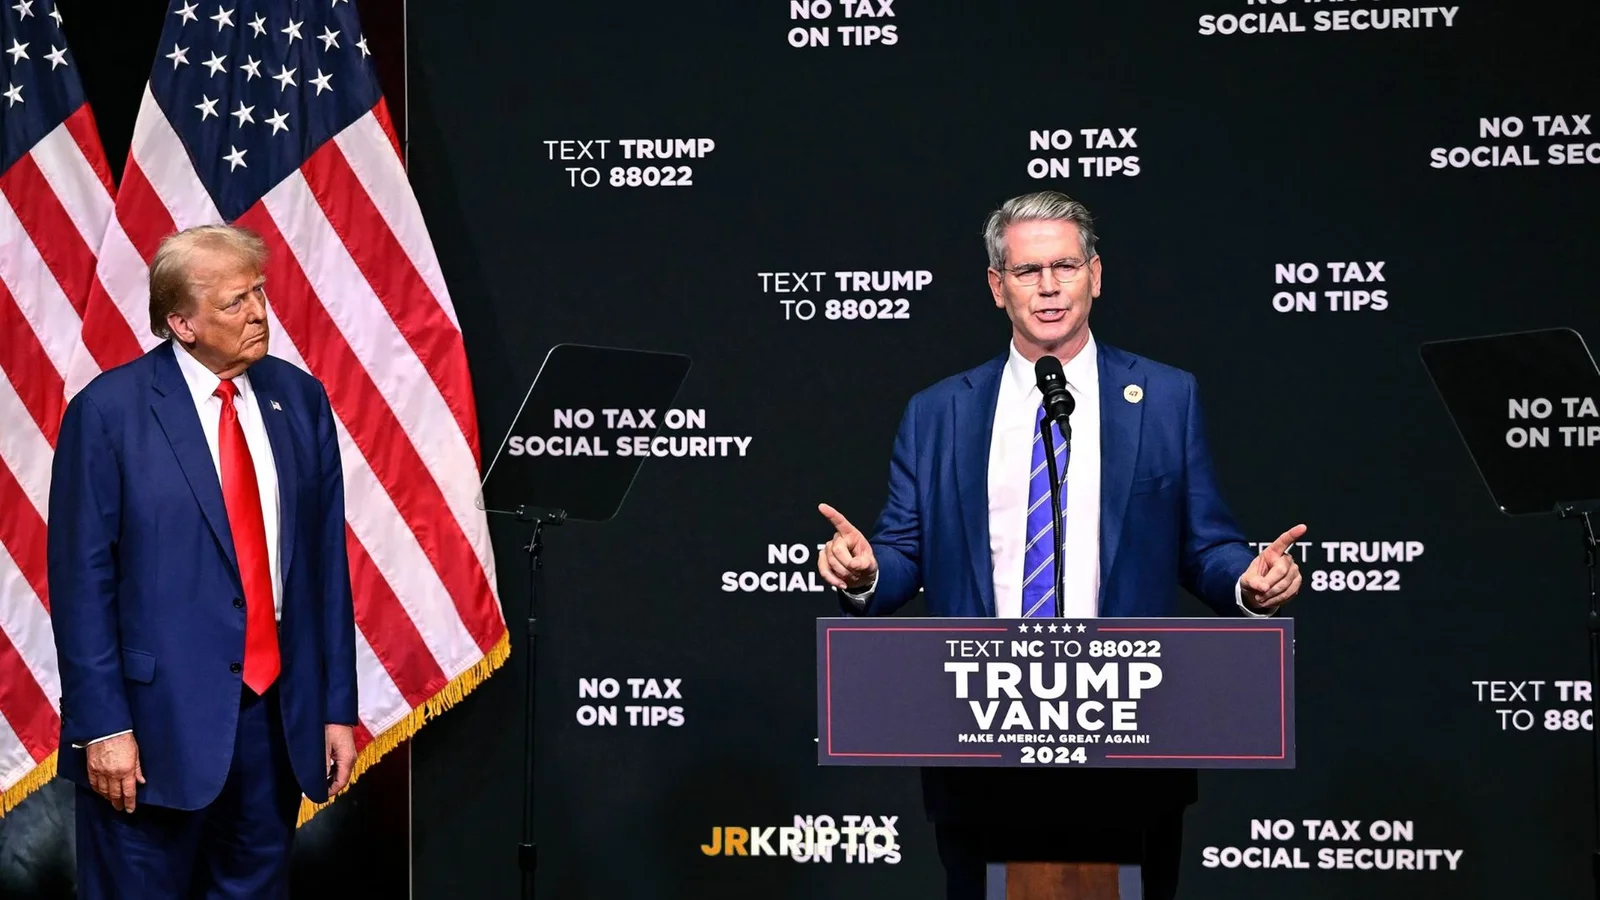
A New Trade Agreement Between the US and the UK is on the Way
The United Kingdom, United with the United States, is preparing to sign a new trade agreement this week. This step shows that despite the Trump administration's publicly perceived attitude as far from compromise, his team is conducting negotiations with 17 of the 18 major trading partners behind the scenes. According to the Financial Times, the new agreement between the US and the UK will be signed this week. Dec.What Does the Agreement Bring?The new trade package is aimed at reducing the effects of steel and automobile tariffs, especially those introduced during the Trump era. The UK had suffered losses in car and steel exports due to US tariffs of up to 25%. London hopes to reach a compromise by the end of this week to eliminate these harmful effects.Treasury Secretary Scott Bessent had previously stated in a statement that a tariff agreement for a major economy could be signed "as early as this week." The FT confirms that this country is the UK.Strategic Effects: Change of Direction in Trade?Sunday Sunday statements from the U.S. side,"we do not need our market, they want access to our market" draws attention to the emphasis. Trump has said in various press conferences that "we don't lose anything by not doing trade," arguing that the United States has the upper hand at the bargaining table.The UK's attitude towards the upcoming agreement with the United States is associated with the country's flexibility in the digital services tax and tariffs on US agricultural products. However, this situation may also set the stage for conflicts that may arise, especially in veterinary agreements with the European Union.Impact on the Cryptocurrency MarketThe signing of this trade agreement will show that the United States is not isolated and is open to compromise. This may trigger the perception that "uncertainty has been lifted" in the market. It is observed that such positive foreign trade news pushes up the price. For the cryptocurrency market, this agreement may be critical both for the recovery of the general market mood and for the legitimization of digital assets.

Trump on China: They want to meet.
Trump: “We’re Not Losing Anything by Not Trading with China”U.S. President Donald Trump made statements regarding trade negotiations with China, saying, “China wants to negotiate with us, but we are waiting for the right time.” Speaking during a meeting at the White House with Canadian Prime Minister Mark Carney, Trump noted that while China wants to engage in talks, such a meeting has not yet taken place.“We’re not losing anything by not trading with China,” said Trump, emphasizing that China has significantly benefited from the U.S. and that the suspension of trade is currently hurting the Chinese economy.“We’re Not Interested in Their Market”Trump stressed that the U.S. does not need to sign trade deals with other countries, stating, “They are the ones who need to make deals with us. They want access to our market. We don’t want access to theirs; we don’t care about their market.” With these remarks, Trump highlighted the advantage the U.S. holds due to its strong consumer market.Recalling that the U.S. was running multibillion-dollar trade deficits daily when he took office, Trump claimed they had reversed this situation. He mentioned that following the imposition of tariffs on the automotive, aluminum, and steel sectors, many companies had returned to the U.S. with trillions of dollars in investment.“We Could Sign 25 Trade Deals Right Now, But We Don’t Have To”When asked, “When will you sign a trade deal?” Trump replied, “If we wanted to, we could sign 25 trade deals right now. But we’re not obligated to sign anything. Even under current conditions, everyone wants to make a deal with us because our market is attractive.”Trump added that, together with Vice President JD Vance, Treasury Secretary Scott Bessent, and Commerce Secretary Howard Lutnick, they would be evaluating trade deal matters over the next two weeks. He stated that they would proceed with fair, low, and enforceable figures.“We Want to Be Friends with Countries, Not Cause Harm”Trump emphasized that their trade strategy is not harsh but flexible: “We’re not chaotic, but we’re adaptable. The numbers we set will be fair. We don’t want to harm countries; we want to help. We want to build friendly relations,” he said.Trump’s remarks underscore the U.S.’s strong bargaining position in trade, signaling that while negotiations with China will continue, they will not be made under pressure. The global trade order continues to evolve under the firm direction of Trump’s trade policies.

Daily Market Summary with JrKripto 6 May 2025
You can find today’s “Daily Market with JrKripto,” where we compile the most important developments in global and local markets, below. Let’s analyze the general market conditions together and take a look at the latest updates.Here’s the updated version, aligned with current prices and presented as a single, cohesive text:Bitcoin (BTC) is currently trading at $94,300. Following an upward trend that began at the $75,930 support level, the price has managed to hold above the $94,000 mark. BTC continues to test the resistance zone between $95,000 and $96,000. If this level is broken to the upside, $101,000 could emerge as the next target. However, if profit-taking occurs around current levels, the first support lies at $90,500. Below that, $86,500 is considered a stronger support level.Ethereum (ETH) is trading at around $1,800. The recovery that started from the $1,486 support has pushed ETH back above the $1,800 level. Should the upward momentum continue, the resistance levels to watch are $1,888 and $1,950. On the downside, $1,790 will be the first support point in case of a pullback. If ETH drops below this level, $1,700 could act as the next support. Staying above $1,790 is key for ETH to maintain its current upward trend.Crypto NewsChinese President Xi stated: “We are ready to work with EU leaders to expand mutual openness and properly manage frictions and disagreements.”Tether minted $1 billion worth of USDT.Strategy announced the purchase of 1,985 BTC.Binance founder CZ stated that he proposed BNB and BTC as the initial reserve currencies for Kyrgyzstan’s national crypto fund. Previously, CZ had joined Kyrgyzstan’s National Crypto Committee upon the invitation of President Sadyr Japarov.VanEck submitted an S-1 filing for a BNB ETF.President Trump said, “I want crypto. Crypto is important because if we don’t do it, China will.”Top Gainers:DAKU → Up 28.6% to $0.1833SAROS → Up 14.8% to $0.1510TURBO → Up 14.1% to $0.0060MOVE → Up 11.4% to $0.1870SAFE → Up 10.7% to $0.4922Top Losers:LAYER → Down 37.6% to $1.96RAY → Down 13.4% to $2.31DEEP → Down 9.0% to $0.1734BRETT → Down 8.4% to $0.0505FLR → Down 8.4% to $0.0180Other Metrics:24-Hour Volume: $64.06BMarket Cap: $2.92TFear & Greed Index:Bitcoin: 57 (Greed)Ethereum: 51 (Neutral)Dominance:Bitcoin: 64.87% ▲ 0.05%Ethereum: 7.54% ▼ 0.45%Daily Net ETF Flows:BTC ETFs: $425.50 MillionETH ETFs: $0.0 MillionGlobal MarketsU.S. stock indices ended the first trading day of the week with minor losses after nine consecutive days of gains. The S&P 500 fell by 0.64%, the Dow Jones by 0.24%, and the Nasdaq by 0.74%. The consumer staples sector stood out with a slight increase, while energy (-2.02%), consumer discretionary (-1.32%), and tech (-0.85%) were the weakest.The drop in energy stocks was triggered by OPEC+ announcing an additional daily output of 411,000 barrels. Following the announcement, oil prices dropped by 1.85%. Furthermore, former President Donald Trump’s proposal to impose a 100% import tariff on foreign films led to selling pressure in media and entertainment stocks.Looking at economic data, the U.S. ISM services PMI rose to 51.6 in April, beating expectations of 50.2 and March’s 50.8, indicating accelerated activity in the service sector. The new orders index rose to 52.3, suggesting increased demand. However, the employment index remained in contraction territory at 49. The prices index surged to 65.1, the highest since January 2023, reflecting mounting cost pressures. The delivery times index rose to 51.3, suggesting slower deliveries.On the other hand, the S&P Global Services PMI for April was revised down from 51.4 to 50.8, indicating slight weakness. Today, the U.S. will release its March trade balance data; in February, the trade deficit was $122.7 billion.In global markets, China’s Caixin services PMI came in at 50.7, below the expected 51.7, creating a mixed outlook across Asian markets, while European markets are expected to open flat.Markets are now focused on the Fed’s interest rate decision and Chair Powell’s remarks. The Fed is expected to hold rates steady. U.S. weekly crude oil inventory data is also on today’s economic agenda.Most Valuable Companies and Stock PricesMicrosoft (MSFT) → $3.24T market cap, $436.17 per share, up 0.20%Apple (AAPL) → $2.99T market cap, $198.89 per share, down 3.15%NVIDIA (NVDA) → $2.78T market cap, $113.82 per share, down 0.59%Alphabet (GOOG) → $2T market cap, $166.05 per share, up 0.14%Amazon (AMZN) → $1.98T market cap, $186.35 per share, down 1.91%Borsa IstanbulIn Borsa Istanbul, weak momentum and capital outflows persist. Due to high interest rates, poor earnings reports, and ongoing political risks, the pressure on BIST is expected to continue. Technically, the 9000–9100 range serves as support, while the 9250–9280 zone is resistance. About 35% of companies have reported Q1 2025 results, and only 15% showed positive outcomes across six key metrics: revenue, gross profit, EBITDA, EBITDA margin, net profit, and return on equity. This is likely to lead to downward revisions in 12-month average targets and keep the index in a narrow range.Today, PMI and PPI data from Europe will be monitored. Turkey’s 5-year CDS started the day at 349 basis points.In April, Turkey’s CPI rose by 3.0% monthly, slightly below the 3.2% forecast. Annual inflation dropped to 37.86%, down 0.2 points. Core inflation indicators — the B index at 36.8% and the C index at 37.1% — showed minor declines. Due to currency movements, PPI increased by 2.76% month-on-month and fell to 22.5% year-on-year. This trend suggests an upward pressure on inflation, driven by TL depreciation and regulated price adjustments.Today, Turkey’s real effective exchange rate for April will be released. The Treasury will also conduct auctions for 2-year fixed coupon and 7-year floating rate bonds.Following the inflation report, Finance Minister Mehmet Şimşek stated that the year-end inflation is still expected to remain within the Central Bank’s forecast range. He also mentioned that due to new U.S. trade policies, some American companies are in talks to manufacture in Turkey, and efforts to combat the informal economy will be intensified. He will meet with investors in London and Doha next week.Data shows that demand for automobiles, especially imported ones, hit record highs in April. Externally, risk-off sentiment prevails ahead of the Fed meeting. Domestically, Central Bank Governor Fatih Karahan will present to the Parliament’s Planning and Budget Committee today.The BIST 100 index climbed to 9241 yesterday but closed at 9112 after selling pressure. The rebound from 9058 confirms that the 9044–8870 band is a strong support zone. As long as the index stays above this range, recovery may continue. However, sustained trading below this level could lead to a sharper decline toward the 8618–8500 zone. On the upside, 9490–9594 is the next resistance zone, and if breached, the 9740–9895 band may come into play. The index is expected to remain flat in the short term.Most Valuable Companies on Borsa IstanbulQNB Finansbank (QNBTR) → 900.31B TL market cap, 270.00 TL per share, up 0.47%Aselsan (ASELS) → 591.89B TL market cap, 136.90 TL per share, up 5.47%Garanti Bank (GARAN) → 425.88B TL market cap, 102.80 TL per share, up 1.38%Turkish Airlines (THYAO) → 405.72B TL market cap, 293.75 TL per share, down 0.09%ENKA Construction (ENKAI) → 373.70B TL market cap, 64.35 TL per share, up 0.94%Precious Metals and Currency RatesGold: 4,165 TLSilver: 41.06 TLPlatinum: 1,216 TLUSD: 38.60 TLEUR: 43.73 TLLooking forward to seeing you again tomorrow with the latest updates!

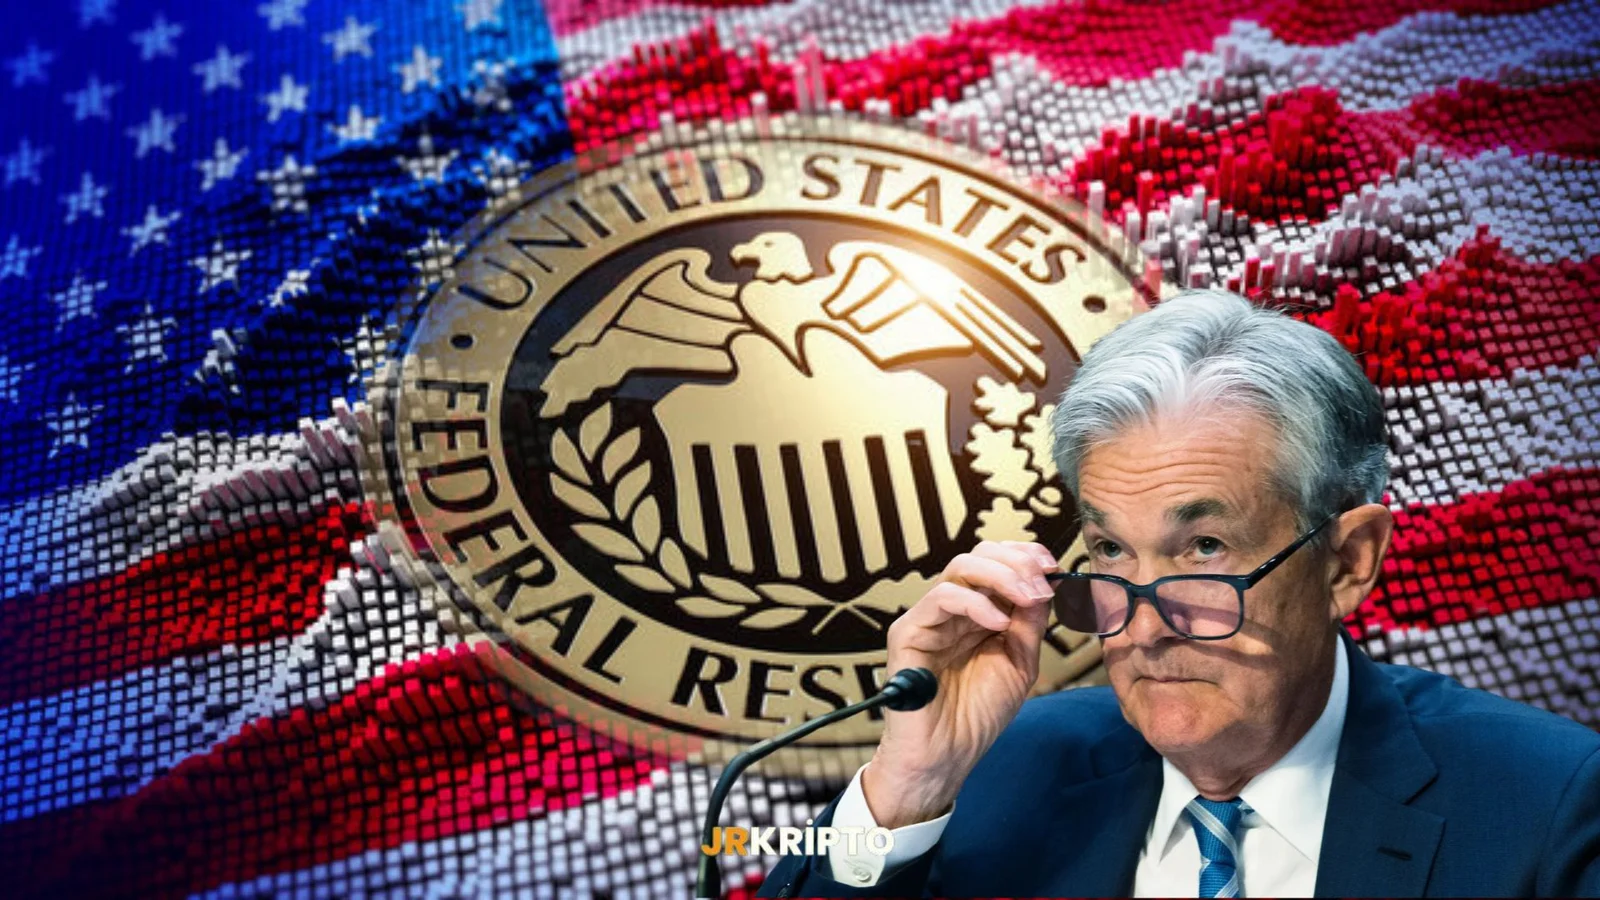
Countdown To Fed Rate Cut Begins
The U.S. Federal Reserve’s interest rate policy has once again become the focal point of global markets.After keeping rates steady at the last two meetings, the Fed has now begun signaling potential cuts.A slowdown in inflation, a drop in the pace of economic growth, and public calls from President Trump have strengthened expectations of a rate cut.Markets broadly expect no change at the May meeting, but anticipate that cuts could begin as early as June.Signals Point to JuneCleveland Fed President Beth Hammack said that the May meeting would be too early for a rate cut, while highlighting June as a key threshold.If the relative decline in inflation continues and the slowdown in economic activity deepens, rate cuts are expected to be on the agenda at the June 17–18 meeting.This expectation has already been reflected in the markets.Interest rate futures are now pricing in a 25 basis point cut in June.The Fed’s continued emphasis on “economic activity remaining strong” signals that they will time the move with caution.Trump Increases PressureU.S. President Donald Trump has intensified his calls for rate cuts.In a White House statement, he said,“Overall prices are falling, energy prices are declining. I hope the Fed lowers rates,” delivering a direct message.Trump’s bid for re-election increases the risk of the Fed’s rate policy becoming more politicized.Especially a White House looking to boost economic activity may see inflation nearing the 2% target as sufficient justification for a rate cut.Gold, Bonds, and Market ReactionsMarkets have already started pricing in expectations.Gold has reached its highest levels in recent times.Rate cut expectations are pulling down bond yields, while interest in risk assets is once again rising.Recovery signals are also visible in Bitcoin and the Nasdaq.Investors Watching June CloselyNo changes are expected in May, but June represents a critical turning point for the Fed.The direction of inflation and other economic data suggest that rate cuts may not be far off.The Fed is likely to enter the summer of 2025 with a rate cut.As the economy starts signaling a rebound, this move could define the new trajectory for financial markets.
Trump: "I Want Crypto, Because If We Don't, China Will"
US President Donald Trump has caused repercussions in the cryptocurrency market with his recent statements. Speaking to NBC News, Trump said that digital assets are no longer just an investment vehicle, but have become a national priority. “I want crypto, crypto is important because China will do it if we don't,” he said, adding that the United States cannot remain passive in the digital finance race.Digital Finance Is Now a Strategic Issue For the United StatesTrump's exit is not only at the level of rhetoric. The USD1 stablecoin, which was launched through his family-owned World Liberty Financial, will be used by Abu Dhabi-based MGX for a $2 billion investment. This step reveals that the Trump family intends to shape the digital dollar on its own initiative.Given the aggressive steps China has taken on the digital yuan, Trump's words take on even more meaning. The president draws attention to the risk that the United States will lose leadership in this area and argues that competition in the digital economy no longer has a technological, but a geopolitical dimension.The Markets Got The MessageAnalysts say that this clear stance of Trump may create an atmosphere of confidence for institutional investors in the long run.Although it seems to have had a limited impact on prices in the short term, Trump's cryptocurrency-friendly messages are the kind that could determine the direction of regulations in the future. This attitude may trigger developments such as relaxing SEC policies, accelerating ETF approval processes, and increasing public-private cooperation in next-generation stablecoin infrastructures.Trump's words ”I want crypto, because if we don't, China will," are not just a political outlet. This statement is a reemergence of the US's claim to leadership in the digital economy. While the world is talking about crypto, now the White House is also in this game.
Daily Market Summary with JrKripto 1 May 2025
You can find our article “Daily Market with JrKripto” below, where we have compiled the most important developments in global and local markets. Let's analyze the general market conditions together and take a look at the latest assessments.Bitcoin (BTC) is currently trading at $95,300. With a strong bullish movement starting from the $75,930 support, the price has settled in the $95,000 – $96,000 resistance band. If this region is exceeded, it can be expected that the rise in BTC will continue to the level of $ 101,000. However, the first support point for profit sales that may occur at current levels will be $ 90,500. If it hangs below this level, it is possible for the decline to deepen to the level of $ 86,500.Ethereum (ETH) is trading at $1,810. With the rise that started at the level of $ 1,486, the price continues to stay above $ 1,800. If the upward movement continues, the resistance levels of $1,888 and $1,950 can be targeted. However, $1,790 will be followed as the first support in possible withdrawals. If persistence is achieved below this level, the $1,700 level for ETH will be the next strong support. Persistence above $1,790 is critical for the continuation of the short-term upward trend.Crypto NewsDonald Trump's son Eric has said that banks that do not adopt crypto will disappear within 10 years.Coinbase has added WLD to its listing roadmap.The United States has contacted China for talks on customs tariffs, Chinese media have confirmed this.North Carolina has passed a bill to create a Strategic Bitcoin Reserve.Canary has applied for a spot ETF for SEI.CryptocurrenciesThose Who Have Risen The Most:VIRTUAL →increased by 42.4% to $ 1.77.BEAM →increased by 23.0% to $0.0088351.PRIME →increased by 22.8% to $3.33.AI16Z →increased by 20.8% to $0.30912477.AERO →increased by 20.7% to $0.71983165.The Ones Who Fell The Most:DRIFT → fell by 7.7% to $0.67915288.LAYER → fell 6.7% to $3.01.DCR → fell 5.6% to $13.13.QGOLD → fell 2.3% to $3,225.41.XAUT → fell 2.1% to $3,234.26.Other Data:Fear Index:Bitcoin: 55Ethereum: 49Dominans:Bitcoin: 64.57% ▲ 0.11%Ethereum: 7.48% ▲ 0.08%Total Net ETF Inflows Per Day BTC ETFs: -56.30 Million$ ETH ETFs: -2.30 Million$ Data to Follow TodayMay 1 - Turkish Labor DayApplications for Unemployment BenefitsExpectation: 224KPrevious: 223KManufacturing Purchasing Managers' Index (PMI) (April)Expectation: 50.7Previous: 50,2ISM Manufacturing Purchasing Managers' Index (PMI) (April)Expectation: 48.0Previous: 49.0Global MarketsUS stock markets ended the day yesterday with a mixed and low volume course. However, the strong technology balance sheets announced after the session close, especially Microsoft's 6.9% and Meta's 5.4% increases, caused positive pricing in futures. Nasdaq futures indices were at a premium of up to 1.5%. While positive expectations in the negotiations with the US trading partners are also influential in this optimism, the fact that China has not yet officially participated in this process continues the cautious approach in the markets.The macroeconomic data showed a weak picture. Private sector employment in the US increased by only 62 thousand people and remained well below expectations. This situation shows that companies are being more cautious in hiring, especially due to tariff-related uncertainties. In addition, the US economy contracted by 0.3% in the first quarter of the year. This contraction was based on a higher-than-expected increase in imports and a weakening in personal consumption. While PCE inflation gave mixed signals, it registered a decrease on an annual basis, indicating an easing in price pressures.The ISM Manufacturing PMI data for March has moved back into contraction territory with 49 points. The index, which can only stay in the expansion zone for two months, showed that the contraction in new and accumulated orders slowed down, but employment losses increased. Supply shortages have accelerated price increases, while inventories have grown and delivery times have extended. This index is expected to decline to 48 points in April. Such data is critical for interpreting the impact of tariffs on businesses.On the international front, while the Bank of Japan left its policy rate unchanged, its failure to give clear signals about an interest rate hike led to the weakening of the Japanese Yen. Oil prices, on the other hand, tested 4-year lows with the news that OPEC+ may increase production. The OPEC+ meeting on May 5 will be critical in this sense.In addition, an agreement was signed between Ukraine and the United States on access to Ukraine's natural resources Dec. This development is interpreted as an effort to get support from Kiev's Trump wing before the upcoming elections in the United States.For the rest of the week, the data calendar is quite busy. In particular, the non-agricultural employment data to be announced on Friday is of great importance for the Fed's monetary policy and may be decisive on the direction of the markets. Apple and Amazon balance sheets will be announced today, and the general mood in the technology sector will be clarified with these data.The Most Valuable Companies and Their Stock PricesApple (AAPL) → market capitalization of $3.19T, price per share of $212.50, an increase of 0.61%Microsoft (MSFT) → market capitalization of $2.94T, price per share is $395.26, an increase of 0.31%NVIDIA (NVDA) → market capitalization of $2.66T, price per share of $108.92, down 0.09%Amazon (AMZN) → market capitalization of $1.96T, price per share of $184.42, down 1.58%Alphabet (GOOG) → market capitalization of $1.94T, price per share of $160.89, down 0.72%Precious Metals and Foreign Exchange PricesGold: 3961 TL Silver: 39.31 TL Platinum: 1191 TL Dollar: 38.44 TL Euro: 43.62 TL Hope to meet you again tomorrow with the latest news!

Daily Market Summary with JrKripto 30 April 2025
Below is today's "Daily Market Update with JrKripto," where we compile the most significant developments in global and local markets. Let's analyze the general market conditions together and review the latest assessments.Bitcoin (BTC) is currently trading at $95,090. Following a strong upward movement from the $75,930 support level, the price has settled above $94,000. BTC is now testing the resistance band between $95,000 and $96,000. If this area is surpassed with significant volume, the next target could be $101,000. However, if profit-taking occurs at current levels, the first support is at $90,500. Sustained movement below this level could lead to a correction down to $86,500.Ethereum (ETH) is trading at $1,820. The recovery process that began from the $1,486 support level has maintained the price above $1,800. In the continuation of the upward movement, the $1,888 and $1,950 levels can be monitored as resistance. However, a pullback from the $1,820 level highlights $1,790 as the first support. Below this, a stronger support at $1,700 can be observed. To maintain ETH's current upward trend, staying above $1,790 is critically important.Crypto NewsThe SEC has concluded its investigation into PayPal's PYUSD stablecoin without enforcement action.Trump: "India is doing great; I think we will have an agreement on tariffs."The UK Chancellor states that the United Kingdom aims to be a "world leader in digital assets."The UK will collaborate with the US to increase cryptocurrency adoption.China has lifted the 125% tariff on imported ethanol from the US.CryptocurrenciesTop Gainers:DRIFT → Increased by 31.8% to reach $0.7651.AKT → Increased by 14.7% to reach $1.53.PLUME → Increased by 12.8% to reach $0.1925.AIC → Increased by 10.5% to reach $0.2011.FLOKI → Increased by 10.3% to reach $0.00009251.Top Losers:SAFE → Decreased by 13.9% to $0.5254.PENGU → Decreased by 13.3% to $0.0106.VIRTUAL → Decreased by 10.5% to $1.32.AI16Z → Decreased by 7.2% to $0.2799.DEEP → Decreased by 6.9% to $0.1942.Other Data:Fear Index:Bitcoin: 57Ethereum: 49Dominance:Bitcoin: 64.50% ▲ 0.10%Ethereum: 7.46% ▼ 0.14%Daily Total Net ETF Inflows:BTC ETFs: $172.80 MillionETH ETFs: $18.40 MillionData to Watch TodayADP Non-Farm Employment (April):Expectation: 114K | Previous: 155KGross Domestic Product (GDP) (Quarterly) (Q1):Expectation: 0.2% | Previous: 2.4%Core Personal Consumption Expenditures (PCE) Price Index (Monthly) (March):Expectation: 0.1% | Previous: 0.4%Core PCE Price Index (Annual) (March):Expectation: 2.6% | Previous: 2.8%Energy Information Administration Crude Oil Inventories:Expectation: -0.600M | Previous: 0.244MGlobal MarketsUS stock indices closed higher following optimistic statements on tariffs by Commerce Secretary Lutnick, marking the sixth consecutive positive trading day. The S&P 500 rose by 0.58%, the Dow Jones by 0.75%, and the Nasdaq by 0.55%. All sectors in the S&P 500, except for energy, closed in positive territory. The strongest performing sectors were financials (0.97%), materials (0.92%), consumer staples (0.77%), and real estate (0.74%).On the economic data front, a weak outlook persisted. The Conference Board Consumer Confidence Index fell from 93.9 in April to 86.0, reaching its lowest level in five years. The expectation was 87.7. The expectations index dropped by 12.5 points to 54.4, the lowest since October 2011, remaining below the 80-point level considered a recession indicator for the third consecutive month. The current conditions index declined to 133.5, while consumers' 12-month inflation expectations rose from 6% to 7%, the highest since November 2022. The JOLTS job openings data came in at 7.19 million, below the expectation of 7.49 million, marking the lowest level in four years. The housing price index also recorded a lower-than-expected increase.Asian markets showed mixed trends, while European markets are expected to start the day flat. Today, US markets will focus on Q1 GDP data, PCE inflation data, and ADP private sector employment data.Most Valuable Companies and Stock PricesApple (AAPL) → Market Cap: $3.17T, Share Price: $211.21, ▲ 0.51%Microsoft (MSFT) → Market Cap: $2.93T, Share Price: $394.04, ▲ 0.74%NVIDIA (NVDA) → Market Cap: $2.66T, Share Price: $109.02, ▲ 0.27%Amazon (AMZN) → Market Cap: $1.99T, Share Price: $187.39, ▼ 0.17%Alphabet (GOOG) → Market Cap: $1.95T, Share Price: $162.06, ▼ 0.22%Borsa IstanbulA weak outlook and capital outflows continue in Borsa Istanbul. Yesterday, the BIST 100 index fell below the 9,250 support level, with technical indicators showing clear sell signals. This decline positions the 9,000 – 9,100 range as the next support area. On the upside, the 9,250 – 9,300 band now serves as resistance. Given that today is the last trading day of April, the closing of arbitrage positions in VIOP share contracts and the stock market may create additional selling pressure on BIST.The Central Bank's weighted average funding cost (WAFC) remains close to 49%. Q1 financial results have generally been weak, though some stocks like ASELS and TABGD have shown positive performance. However, the expected strong outlook for the earnings season has not been achieved. Today's agenda includes Koç Holding (KCHOL) financial results, domestic foreign trade data, growth data in Europe, and employment, housing, and consumption-focused data in the US.Turkey's 5-year CDS premium has risen to 362 basis points, showing an upward trend contrary to the average of emerging markets. This indicates an increased risk perception specific to TL assets and the continuation of foreign sales in BIST.The unemployment rate fell to 7.9% in March, seasonally adjusted, reaching the lowest level in the series. However, the underemployment rate increased over the past three months, reaching 28.8%, the highest since June 2023. The labor force participation rate stood at 53.4%. The Economic Confidence Index for April decreased by 4.2% monthly to 96.6, marking the sharpest decline since August 2023. The subcomponents of the index indicate weakened expectations on both the consumer and producer sides.Yesterday, sales in aviation stocks determined the direction of the index, and the BIST 100 closed the day with a 0.9% loss. Generally weak earnings and rising interest rates are increasing pressure on the index. A selling trend is expected to continue in Borsa Istanbul today.The BIST 100 index fell to 9,217 yesterday before closing at 9,225. The 9,221 level is being monitored as short-term support, while the 9,044 – 8,870 range serves as a stronger support area due to previous lows. As long as the index stays above this region, rebound buying may occur. Otherwise, a stronger decline towards the 8,618 – 8,500 band could be experienced. On the upside, the 9,494 – 9,594 band stands out as near-term resistance. If this band is surpassed, movement towards the 9,740 – 9,895 range may be seen. Support levels for BIST 100: 9,221 – 9,044 – 8,870 – 8,725 – 8,618; resistance levels: 9,494 – 9,594 – 9,740 – 9,895 – 9,953.Most Valuable Companies in Borsa Istanbul (According to Visual Data):QNB Finansbank (QNBTR) → Market Cap: 938 billion TL, Share Price: 270.50 TL, ▼ 3.39%Aselsan Elektronik Sanayi (ASELS) → Market Cap: 626.54 billion TL, Share Price: 132.90 TL, ▼ 3.28%Türkiye Garanti Bankası (GARAN) → Market Cap: 430.08 billion TL, Share Price: 101.70 TL, ▼ 0.68%Türk Hava Yolları (THYAO) → Market Cap: 410.89 billion TL, Share Price: 289.00 TL, ▼ 2.94%ENKA İnşaat ve Sanayi (ENKAI) → Market Cap: 373.11 billion TL, Share Price: 63.80 TL, ▲ 0.24%Precious Metals and Exchange RatesGold: 4091 TLSilver: 39.97 TLPlatinum: 1201 TLUSD: 38.50EURO: 43.90

The Spot Crypto ETF Era Begins in South Korea: A Wind of Pre-Election Reform
South Korea Set to Take Major Steps in the Digital Asset SpaceAhead of the early presidential elections scheduled for June 3, the ruling People Power Party (PPP) has unveiled reform plans aimed at energizing the crypto market.Single Bank Requirement to Be RemovedThe PPP intends to remove the current rule that allows crypto exchanges to operate with only one bank.The new regulation would enable exchanges to partner with multiple banks, a move expected to increase investor access and boost competition.Legal Framework for Spot Crypto ETFsOne of the most notable pledges: Spot Bitcoin and altcoin ETFs are expected to become legally approved within this year.The PPP argues that such products would offer a safe entry point for institutional investors.Citing the growing interest in the U.S., the party believes South Korea must not fall further behind in this area.Digital Assets Promotion Act in the WorksThe PPP also plans to introduce a new legislative framework titled the “Basic Act for the Promotion of Digital Assets.”Key goals include:Clarifying listing criteriaStrengthening transparency regulationsCreating a legal foundation for security tokens (STOs)Ensuring international compliance for stablecoinsA special Digital Assets Committee, directly reporting to the president, is also under consideration to oversee the entire process.Crypto Policies Take Center Stage in Election CampaignPPP’s presidential candidate Hong Joon-pyo is campaigning on a promise to liberalize crypto regulations.He drew attention with his statement: “We will roll back regulations just like the Trump administration did.”Crypto is now not only an economic issue but a central theme in the broader political message.Parallel Announcements from RegulatorsThe Financial Services Commission (FSC) is also preparing new regulations.In January, it was announced that restrictions on institutional investors' crypto activities would be eased.The upcoming regulations will cover areas such as stablecoins, listing rules, and market transparency.Digital Transformation to Be Shaped by Election OutcomeSouth Korea is entering a new phase in crypto reform.With spot ETFs, flexible banking rules, and legal frameworks, the country could become one of Asia’s leading crypto hubs.However, the future of this transformation hinges on the election outcome.If the PPP wins, reforms could be implemented rapidly — the opposition’s stance, however, remains unclear.

Daily Market Summary with JrKripto 29 April 2025
You can find today’s “Daily Market with JrKripto” article below, where we compiled the most important developments in global and local markets. Let’s analyze the general market conditions together and take a look at the latest evaluations.Bitcoin (BTC) is currently trading at $94,700. The price has strongly continued the upward trend that started from the $75,930 support level and has now surpassed the $94,000 levels. Currently hovering near the $95,000 – $96,000resistance zone, a breakout from this region could bring $101,000 into focus. However, if profit-taking occurs around $95,000, the first support lies at $90,500. If this level is broken downward, $86,500 will be the next support level to watch.Ethereum (ETH) is trading at $1,824. The price continues its recovery that began from the $1,486 support. If the upward movement continues from the current level, the resistance levels to watch will be $1,888, followed by $1,950. On possible pullbacks, $1,790 will act as the first defense level. If that level fails, $1,700 will be the stronger support. To maintain the uptrend in ETH, staying above $1,790 is important.Crypto NewsCircle ($USDC) received approval to operate as a money services provider in Abu Dhabi, UAE.South Korea plans to approve spot crypto ETF trading later this year.Arizona became the first U.S. state to pass a $BTC reserve bill allowing 10% of public funds to be invested in virtual assets like Bitcoin. The bill now awaits Democratic Governor Katie Hobbs’ signature to become law.Standard Chartered predicts a new all-time high (ATH) for Bitcoin in Q2.U.S. Treasury Secretary Bessent says the first trade deal may be finalized this week or next.MicroStrategy purchased 15,355 BTC.Tether minted $1 billion in USDT.Top Gainers in Cryptocurrencies:SAFE → up 27.9%, now at $0.5898LAYER → up 15.0%, now at $3.12BABY → up 10.8%, now at $0.0926VIRTUAL → up 10.3%, now at $1.44MOCA → up 8.3%, now at $0.0968Top Losers:POPCAT → down 14.6%, now at $0.3684DEEP → down 11.1%, now at $0.2071WIF → down 10.3%, now at $0.5922TRUMP → down 9.7%, now at $13.75KAITO → down 9.6%, now at $0.9009Other Metrics:Fear Index:Bitcoin: 58Ethereum: 49Dominance:Bitcoin: 64.23% ▼ -0.25%Ethereum: 7.51% ▲ +1.25%Daily Total Net ETF Inflows:BTC ETFs: $591.20 millionETH ETFs: $64.10 millionData to Watch Today:Conference Board (CB) Consumer Confidence (April): Forecast: 87.7 | Previous: 92.9Job Openings and Labor Turnover Survey (JOLTS) (March): Forecast: 7.490M | Previous: 7.568MGlobal MarketsU.S. stock markets started the week positively with a heavy flow of economic data and earnings reports but couldn’t maintain gains and ended the day flat.S&P 500: +0.06%Dow Jones: +0.28%Nasdaq: -0.10%8 out of 11 major sectors closed in the green. The top performers were:Infrastructure: +0.70%Real Estate: +0.68%Energy: +0.63%Sectors underperforming included:Technology: -0.30%Consumer Staples & Discretionary: -0.15% eachEuropean markets also ended the day mostly flat to slightly positive.Today, company earnings will be the focus, especially from Visa, Coca-Cola, Spotify, and Mondelez, which will be key in assessing consumer trends and corporate outlooks.On the data side, the U.S. will release:Consumer confidenceJOLTS (Job openings)Trade balanceHousing pricesIn March, the trade deficit fell by $7.7B to $147.9B. JOLTS showed open jobs declined by 194K to 7.57M, with a hiring rate of 3.4%. Layoff and quit rates were stable at 1.1% and 2.0%, respectively.ECB will release March inflation expectations today. Asian markets showed mixed performance, while European indexes are expected to open higher.Most Valuable Companies & Stock PricesApple (AAPL) → $3.16T market cap, $210.14/share, ▲ 0.41%Microsoft (MSFT) → $2.91T, $391.16/share, ▼ 0.18%NVIDIA (NVDA) → $2.65T, $108.73/share, ▼ 2.05%Amazon (AMZN) → $1.99T, $187.70/share, ▼ 0.68%Alphabet (GOOG) → $1.97T, $162.42/share, ▼ 0.87%Borsa Istanbul (BIST)Rising interest rates, weak earnings, and ongoing risks have kept the BIST 100 index tightly ranged between 9250–9500for nearly a month.Yesterday, the index dropped 1.3%, closing at 9307, with banking stocks falling 3.2%, diverging negatively.Technical levels to watch:Support: 9250 → 9100/9000 → 8870/8618Resistance: 9390 → 9500 → 9580 → if broken, a move to 9740–9895 is possibleUpcoming Turkish data:March unemployment rateApril economic confidence index (previous: 100.8, decline expected)CDS risk premium started the day at 357 bps.Both technical and fundamental indicators suggest staying cautious on BIST.Top Companies by Market Cap in BISTQNB Finansbank (QNBTR) → ₺927.95B, ₺281.00/share, ▲ 1.44%Aselsan (ASELS) → ₺632.02B, ₺138.20/share, ▼ 0.29%Turkish Airlines (THYAO) → ₺431.60B, ₺301.75/share, ▼ 3.52%Garanti Bank (GARAN) → ₺425.46B, ₺101.90/share, ▲ 0.59%ENKA (ENKAI) → ₺376.33B, ₺63.55/share, ▼ 1.01%Precious Metals & FXGold: ₺4,086Silver: ₺41.18Platinum: ₺1,227USD/TRY: ₺38.43EUR/TRY: ₺43.82Looking forward to seeing you again tomorrow with the latest updates!
