In-Depth Analysis of Bitcoin (BTC) and the Crypto Market – Critical Levels and Possible Scenarios
The cryptocurrency markets are fluctuating in parallel with the movements of Bitcoin (BTC). It is of great importance to examine the critical levels in order to assess whether the bull season has arrived. Developments in global markets, macroeconomic factors and technical indicators play an important role in determining the future direction of BTC.
In this analysis, in addition to the main support and resistance levels of Bitcoin, the USDT Dominance (USDT.D) We will consider in detail the impact of the rate, the total market value and the impact of macroeconomic factors on the BTC price.
Bitcoin's Important Support and Resistance Levels
Maintaining certain support levels is critical for Bitcoin to maintain its upward movement. At the same time, strong resistance levels need to be overcome for the upward movements to be permanent.
Bitcoin Support Levels (Regions where Buyers Are Influential)
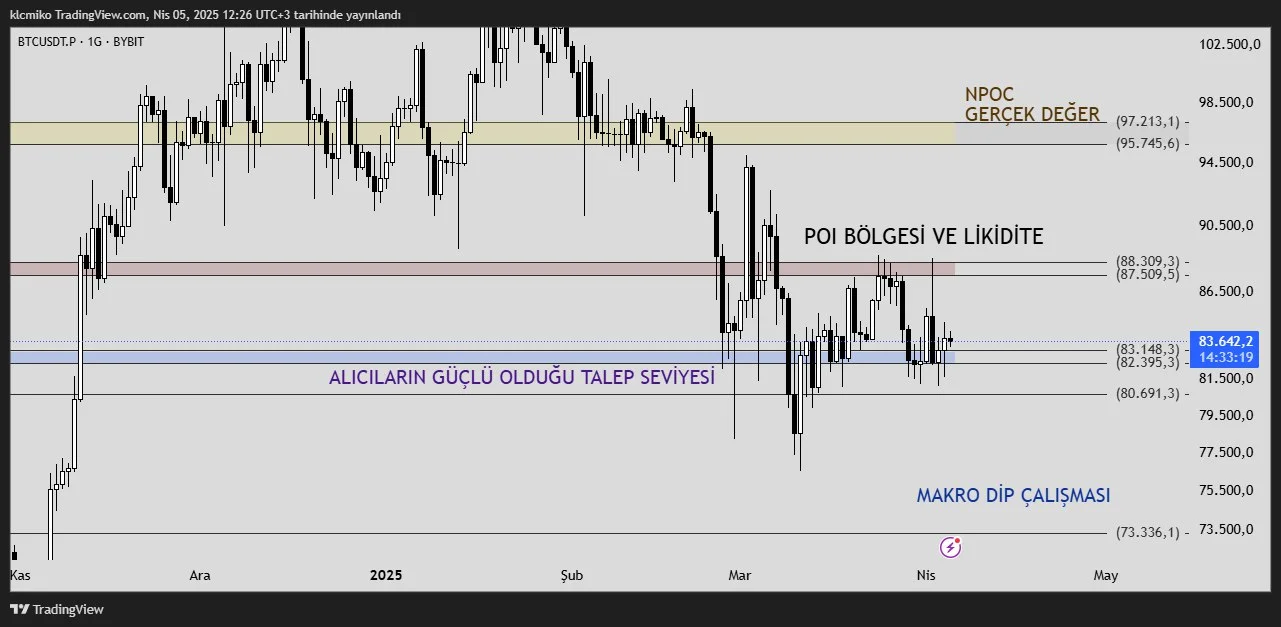
December 82,300 - $ 83,100: It stands out as a strong support area in the short term. This region is located among the levels where buyers are active and their interest is concentrated. Dec.
$80,691 Level: The main support level where Bitcoin shows strong buying reactions. If the price remains above this level, the upward trend can be expected to continue.
Macro Support Level of $73,336: This region is a critical turning point in Bitcoin's ascent, which started at the $15,500 level. Previously, BTC had experienced an increase of more than 150% after this level. If the price falls back here, it is likely that a strong buying movement will begin. If the $80,691 level is lost, the $73,336 zone can be tested.
Bitcoin Resistance Levels (Regions where Sellers are Strong)
$87,500 Level: An important resistance zone for Bitcoin. This level, which acted as support in the past, has now become one of the main resistance points faced by the price. If BTC exceeds this level, it can gain bullish momentum.
$92,591 Level: Another of the key resistance levels that will determine the price direction of BTC. If there is a permanent movement above this level, BTC could move towards the December range of $95,745 - $97,213.
$95,745 - $97,213 (NPOC) Region: This region stands out as an area that has attracted attention with high trading volumes in the past and where market balance has not been achieved. If BTC passes this level, the probability increases that the price will quickly move towards $ 110,000.
$ 110,000 Main Goal: When Bitcoin reaches this level, new peaks may be opened. From a technical point of view, it can be expected that the upward movement will accelerate when the price discovery process is entered. A break of the $87,500 level further strengthens the bullish trend for Bitcoin, while the $110,000 target becomes a closer possibility if it holds above $95,745.
The Impact of Macroeconomic Factors on Bitcoin
The price of Bitcoin depends not only on technical levels, but also on global economic developments, US Central Bank (FED) policies, inflation rates and political events.
April 2 Trump Customs Tariffs Statement:
The new tariffs imposed by the United States have led to additional taxes being imposed on many countries. Oct. This situation has created a risky environment by creating uncertainty for the markets.
FED Rate Decisions and Bitcoin:
If the FED signals an interest rate cut in May, this could be a positive development for Bitcoin. The low interest rate environment provides more liquidity to the market and increases interest in risky assets such as BTC.
The future movement of Bitcoin's price will depend not only on technical levels, but also on macroeconomic developments. Therefore, it is important for investors to carefully monitor both factors.
Ethereum (ETH): Price Map, Critical Levels and Direction-Determining Regions
Ethereum is trading at price levels that play a key role in determining the direction of the market. In the current situation, the regions where both buyers and sellers are concentrated are clearly separated. This separation allows us to read the short- and medium-term roadmap of ETH more clearly.
Below, we have discussed in detail the main support, resistance and conversion levels that will shape Ethereum's ascension scenario.
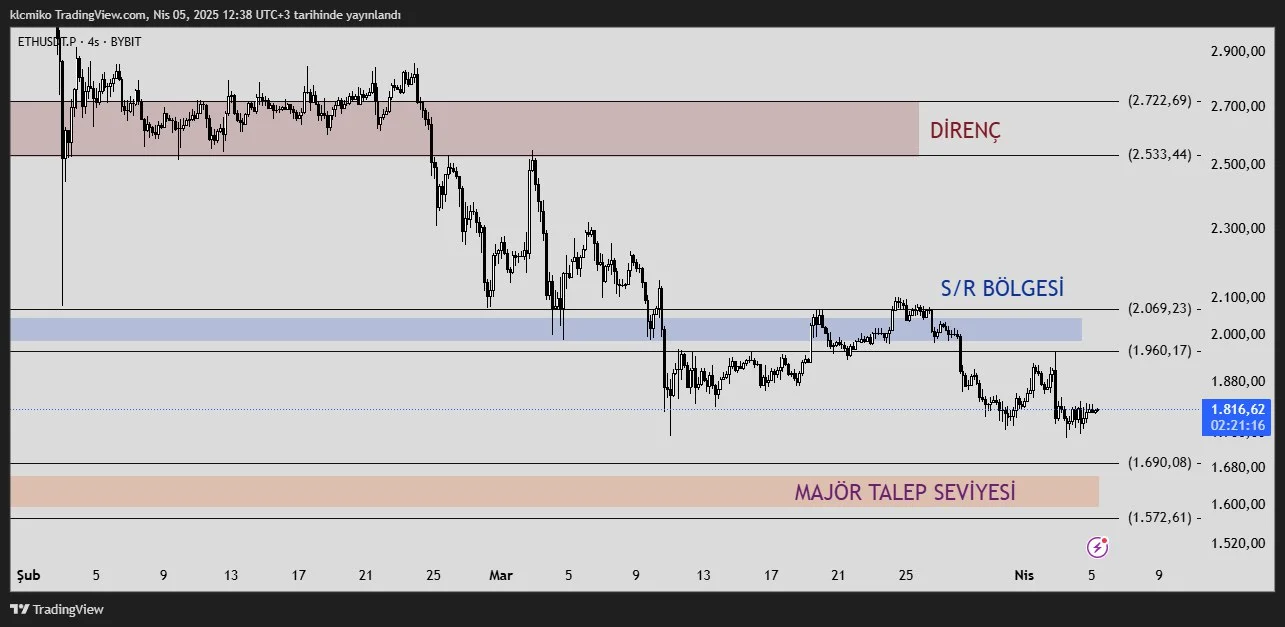
$1572 – $1690: Deep Demand Area and the Basis of the Rise
This region is the main support line for Ethereum, where there is strong buyer interest. When historical data are examined, it is noteworthy that while hard sales come when these levels are below; strong reaction purchases are seen when they stay above.
Persistence above the $1690 level ensures that the bullish potential for ETH remains alive.
If it goes below $1572, it comes across as a corporate safe zone
This region serves as the basic base that forms the basis for Ethereum to establish a healthy ascension structure.
1960$ – 2069$: SR Flip Area – The Heart of the Direction Selection
This is not only a resistance zone, but also a strategic decision point that will determine the direction of the price. The term SR Flip (Support to Resistance Flip) refers to the testing of an area that previously worked as support in technical analysis as resistance after going below the price. In the case of Ethereum, this region provided strong support in the past, but now we see that the same region serves as a resistance.
Why is this area so important?
The $1960 - $2069 region is an area where investor psychology has been broken and retested. If ETH breaks this level up with a high trading volume and provides permanence here, this is interpreted as a “confirmed trend turn” in technical terms.
This breakdown can lead to the start of new waves of purchases by instilling confidence in investors.
However, a rejection in this region will bring up the ”false breakout" scenario and push the price back to support levels.
In this respect, the SR flip area is not only a technical dam; it is also a litmus test on which we can measure market sentiment. The price behavior to be seen here may determine the short-term fate of Ethereum.
$2533 – $2722: High Time Zone Resistance and Trend Formation Zone
These levels are strong resistance points that Ethereum faces in higher time periods (for example, on weekly charts). This region is known as the area where the price has previously turned down, slowed down volumetrically and profit realizations have increased.
If ETH can pass these levels in volume, a new trend structure will be formed in the medium term.
However, if the selling pressure increases here, the market may enter into a consolidation process for some time.
This resistance band may be the trigger for the second stage of the ascent.
$3,400 and $5,000: The Route of the Big Players and the Layer 2 Effect
These two levels, which are among the long-term goals of Ethereum, are in the focus of institutional investors. Dec. In particular, the $3,400 level stands out as an area where liquidity has been concentrated in the past and large orders have been collected.
If persistence above $3,400 is achieved, the $5,000 target comes to the table by entering the price discovery area.
The fact that ETH crosses such psychological thresholds activates not only itself, but also ecosystem projects.
Especially Layer 2 projects (such as OP, ZKSYNC, ARB, STRK) may be positively affected by this increase and may see a serious flow of funds.
USDT Dominance (USDT.D): Market Confidence, Fund Flow and Critical Turning Points
One of the most effective ways to understand investor behavior in the cryptocurrency market is USDT Dominance (USDT.D) to analyze the graph. This metric shows whether investors are using their capital in favor of risky assets or safe havens. USDT.When D rises, investors run away from risk by turning to stablecoins, while when it falls, capital flows back into crypto assets. Therefore, it is USDT to understand the direction in BTC and altcoins.D levels play a critical role.
Below we have detailed the effects on the market according to the current technical levels:
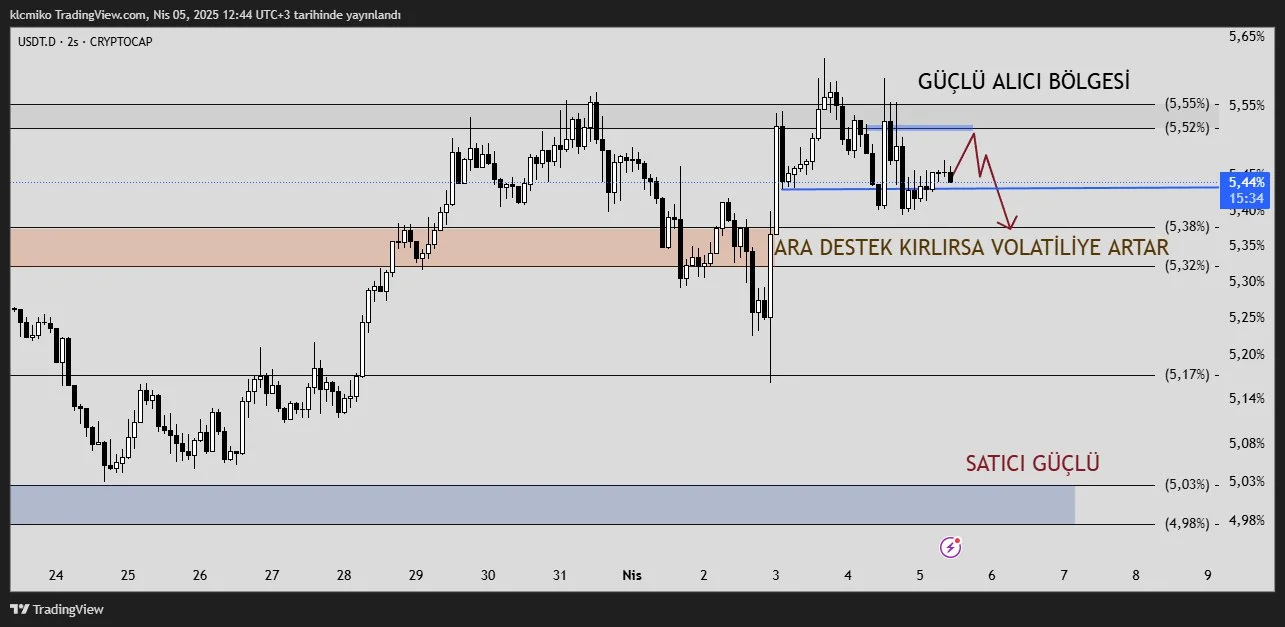
5.52% - Decision Moment: Buyer Pressure Is Building, But It Must Be Broken For the Sale To Be Completed
This level indicates that the panic mood in the market is gradually ending, but investors are still cautious. USDT.The fact that D has reached this level indicates that sales in cryptocurrencies have slowed down, but confidence has not fully returned.
If USDT.If D starts making closures below this level, we can say that the selling pressure has decreased and the flow of funds to cryptocurrencies may start again.
However, a persistence above 5.52% indicates that investors are still maintaining their stablecoin positions and the market is having a difficult time recovering.
This level is a region where the market is approaching the neutral position; a clear bullish signal is not received unless there is a downward break.
5.32% - Breaking Threshold: May Initiate Retreat, Descent Below Triggers Rise
the level of 5.32%, USDT.It stands out as the “critical decision zone” of D. The downward break of this area indicates that investors are quickly leaving their stablecoin positions and re-entering cryptocurrencies.
If the 5.32% downside breaks, the market will breathe a sigh of relief and sudden rises in BTC and altcoins may be seen along with an increase in volatility.
This breakdown is also the clearest sign that investor confidence is returning.
This area is the front door of the bull scenario. Strong reception waves can be triggered after this point.
5.03% - The Region Dominated by Sellers: It Should be Carefully Monitored
Although the decline of USDT Dominance to the 5.03% level indicates that the market's appetite for buying is increasing, this region should be followed carefully as it is also a potential bottoming region.
It is observed that sales are intensifying at this level and investors are aggressively switching to risky assets.
However, a support that may occur here may temporarily end the selling wave and USDT.D may start to rise again.
- A clear break of this level opens up the possibility of a strong rally in Ethereum and altcoins. However, the jumps that can be experienced from here can also prepare the ground for sudden snow realizations.
- Strategic Foresight
- going below 5.52%: Risk appetite is increasing in the market, the bullish scenario is strengthening.