Politics
This page lists the latest Politics news and market analysis. Browse articles, expert insights, and updates in this category on JrKripto. Stay informed with in-depth coverage of cryptocurrency trends and developments.
News
Politics News
Politics News
Browse all Politics related articles and news. The latest news, analysis, and insights on Politics.
Daily Market Summary with JrKripto 27 May 2025
You can find below today’s “Daily Market with JrKripto” report, in which we compile the most important developments in global and local markets. Let’s analyze the general market conditions together and take a look at the latest evaluations.Bitcoin (BTC) is currently trading at $109,750. The long-term upward trend that started from the level of $75,930 gained momentum by breaking through the $101,059 and $104,000 resistances and reached $111,880, refreshing the all-time high (ATH) record. The slight pullback seen after this peak is considered as the market’s process of digesting profit-taking. Technically, the level of $108,000 continues to act as an important short-term support. As long as it holds above this level, $114,500 and $118,300 levels may be targeted again. In case of increasing downward pressure, the levels of $104,629 and $101,059 will be followed as supports. For the positive trend in BTC to continue, maintaining above $108,000 is of great importance.Ethereum (ETH) is currently trading at $2,630. The upward trend that started from the level of $1,486 gained speed after surpassing the $2,453 and $2,595 resistance levels, and ETH has once again gained upward momentum following the correction. In the current outlook, the level of $2,595 now acts as strong support. As long as it remains above this level, $2,800 and $2,981 stand out as potential targets. In possible pullbacks, if it drops below $2,595, the support zones of $2,453 and $2,095 may come into focus respectively. To maintain the upward trend in ETH, staying above $2,595remains important.Crypto News– Japan plans to allocate 900 billion yen in government funds for an emergency aid package in response to U.S. tariffs.– Florida has become the first state to promote lifting capital gains taxes on Bitcoin.– Trump: “Countries around the world want to make trade agreements with us.”– Strategy announced that it has purchased 4,020 Bitcoins at $106,237.– Trump Media Group aims to raise $3 billion in funds to invest in cryptocurrencies.CryptocurrenciesTop Gainers:CAKE → up 15.3%, reaching $2.86CHEX → up 13.6%, reaching $0.23239787QNT → up 12.4%, reaching $107.73FRAX → up 11.2%, reaching $3.57VIRTUAL → up 9.6%, reaching $2.45Top Losers:ZBCN → down 18.8%, falling to $0.00416172KTA → down 7.7%, falling to $0.80173763TEL → down 6.8%, falling to $0.000442572XMR → down 6.2%, falling to $386.28SYRUP → down 4.9%, falling to $0.42535468Fear Index:Bitcoin: 74Ethereum: 57Dominance:Bitcoin: 64.22% ▼ 0.19%Ethereum: 9.21% ▲ 0.61%Global MarketsOn the last trading day of the week, new tariff policies announced by U.S. President Donald Trump caused selling pressure in global markets. Trump announced that a 50% customs tariff would be applied to products imported from the European Union and that a 25% customs tax would be applied to iPhones if Apple produces them outside the U.S. He also stated that similar taxes would be imposed on Samsung and other smartphone manufacturers.Following these announcements, U.S. stock indexes started the day with losses. However, some of the losses were recovered during the day. The S&P 500 closed down 0.67%, the Dow Jones down 0.61%, and the Nasdaq down 1.00%. Only 4 out of 11 sectors in the S&P 500 closed positive. The best performance was seen in the infrastructure sector with a 1.16% rise. Consumer staples, energy, and real estate stayed flat with slight gains. Technology, telecommunications, and consumer discretionary showed the weakest performance of the day with losses of 1.33%, 0.99%, and 0.91% respectively.Trump's postponement of the implementation of the 50% EU customs tariff from June 1 to July 9 gave a signal of recovery in markets at the start of the week. U.S. stock markets were closed on Monday due to Memorial Day. On the first trading day of the week, futures saw recovery. U.S. and European futures indexes rose up to 1%, while Asian markets moved in a mixed and volatile pattern.Global investors' risk appetite is slightly positive as of this morning. The postponement of Trump’s tariff decisions was perceived positively, especially in the U.S. and Europe. In the upcoming period, trade policies and tariff decisions will continue to be decisive in markets.On the other hand, the Consumer Confidence Index announced by the Conference Board in the U.S. has been declining for five months. In April, the index fell to 86, the lowest level since May 2020. Consumers’ 12-month inflation expectation rose from 6.2% to 7%, reaching its highest level since November 2022. It is estimated that this index will rise to 87.1 in May.Most Valuable Companies and Stock PricesMicrosoft (MSFT) → $3.35 trillion market cap, share price $450.18, 1.03% dropNVIDIA (NVDA) → $3.2 trillion market cap, share price $131.29, 1.16% dropApple (AAPL) → $2.92 trillion market cap, share price $195.27, 3.02% dropAmazon (AMZN) → $2.13 trillion market cap, share price $200.99, 1.04% dropAlphabet (GOOG) → $2.05 trillion market cap, share price $169.59, 1.39% dropBorsa IstanbulImportant economic data will be announced domestically this week. On Tuesday, the economic confidence index, on Thursday the final version of April’s foreign trade data, and on Friday, April’s unemployment rate and Q1 2025 GDP growth data will be announced. Also on Friday, the CBRT will publish the year’s first Financial Stability Report.According to preliminary data from the Ministry of Trade, exports in April increased by 8.5% to $20.9 billion, while imports rose by 12.9% to $33 billion. As a result, April’s foreign trade deficit increased to $12 billion, marking a $2.1 billion increase compared to the same period last year. The 12-month cumulative trade deficit reached $86.6 billion, the highest level since June 2024.The growth data to be announced on Friday will be the most critical agenda item of the week for the markets. Our growth estimate for the first quarter is approximately 2% year-on-year and around 1.5% quarter-on-quarter. The CBRT’s updated output gap forecasts in the Inflation Report also indicate growth above potential, around 1.5% during this period.At Borsa Istanbul, the BIST-100 index fell to the 9,300 level yesterday, then moved within a horizontal band in line with expectations. Although there was volatility in stocks, no significant sectoral divergence was observed. Today, with U.S. and U.K. markets reopening after the holiday, an increase in foreign investor participation may be seen on Borsa Istanbul. The main index continues to show a sideways and tight pattern.Technically, the BIST-100 index pulled back to 9296 yesterday and closed at 9345 points. The 9331 level stands out as support in the short term. As long as it remains above this level, a sideways and tight movement is more likely than a significant drop. Closings above 9475 on the index may signal a new wave of optimism. Support levels are 9331, 9233, 9148, 9044, and 8984; resistance levels are 9475/9500, 9588, 9740/9760, 9895, and 9953.Most Valuable Companies on Borsa IstanbulQNB Finansbank (QNBTR) → ₺872.68 billion market cap, share price ₺258.75, ▼ 0.67%Aselsan (ASELS) → ₺621.53 billion market cap, share price ₺136.10, ▼ 0.15%Garanti Bank (GARAN) → ₺469.56 billion market cap, share price ₺111.20, ▼ 0.54%Turkish Airlines (THYAO) → ₺386.4 billion market cap, share price ₺277.00, ▼ 1.07%Koç Holding (KCHOL) → ₺372.78 billion market cap, share price ₺144.50, ▼ 1.70%Precious Metals and Exchange RatesGold: ₺4,164Silver: ₺41.29Platinum: ₺1,349Dollar: ₺38.97Euro: ₺44.32See you again tomorrow with the latest updates!

July 9 Deadline: Trump Postpones 50% Tax Implementation to the EU
U.S. President Donald Trump announced that the implementation date of the planned 50% import tariff on the European Union (EU) has been postponed from June 1 to July 9, 2025. The decision was announced following a phone call with European Commission President Ursula von der Leyen. After the call, Trump said, “Ursula von der Leyen called me and requested additional time. I decided to extend it until July 9.”Phone Diplomacy and Postponement DecisionVon der Leyen also stated that the conversation was constructive, and said, “Europe is ready to start negotiations quickly and decisively.” The EU side indicates that more time is needed until July 9 to reach a good trade agreement.Trump’s move aligns with his previous statements. In April, he announced a 20% tariff on EU goods, and by the end of May, said that this rate would increase to 50%. However, due to stalled negotiations, he had signaled that it would be implemented directly.Trade Tensions Between the EU and the U.S.The EU side acknowledges that there is still significant distance in the negotiations, but emphasizes that these differences can be overcome. European Commission spokesperson for Economic Security and Trade Olof Gill stated that direct contact continues in the talks and that both sides are open to constructive solutions. Gill added, “If Trump’s statements signal a step forward, Europe is ready for it.”As of 2024, the goods trade deficit between the U.S. and the EU has reached $236 billion. The EU, however, claims that the real gap is around €50 billion when the U.S. dominance in the services sector is taken into account.During this process, the EU announced that it is preparing retaliatory tariffs worth approximately €100 billion on U.S. products in case of a failed negotiation.July 9: A Critical DateAccording to Trump’s decision, the implementation date for the 50% customs tariff has been set for July 9. During this period, both sides will conduct negotiations to reach a permanent and mutually beneficial trade agreement.Trump defended this move by saying, “There are many countries that want to trade with the U.S.”, while the EU continues to emphasize reciprocity and cooperation.This development appears likely to affect not only transatlantic trade relations, but also global supply chains and the investment environment. All eyes are now on July 9.

Daily Market Summary with JrKripto 26 May 2025
We present below today’s edition of “Daily Market with JrKripto”, in which we compile the most important developments from global and local markets. Let’s analyze the general market conditions together and take a look at the latest assessments.Bitcoin (BTC) is currently trading at $109,800. The long-term upward trend that started from the $75,930 level accelerated after the $101,059 and $104,000 resistances were broken, reaching $111,880 and setting a new all-time high (ATH) record. However, the pullback seen after this peak is considered a natural correction caused by profit-taking. At this stage, the $108,000 level stands out as the first important support. As long as this level holds, the upward movement may regain strength, targeting the $114,500 – $118,300 levels. If downward pressure increases, the $104,629 and $101,059 levels will be monitored as supports. In order to maintain the overall bullish trend in BTC, it is crucial that the price does not fall below $108,000.Ethereum (ETH), on the other hand, has pulled back to the $2,570 level. The uptrend that began at $1,486 gained momentum after breaking through the $2,453 and $2,595 resistances. The current correction after the recent rise can be interpreted as a technical breather. The $2,595 level still acts as the first important support. If this level is broken upward again, the $2,800 and $2,981 levels may be monitored as potential resistance targets. On the other hand, if the price falls below $2,595, the $2,453 and $2,095 support levels may come into focus again. It is important for the positive outlook in ETH to maintain price movement above $2,595.Crypto News– Japan plans to allocate ¥900 billion in government funds for an emergency aid package in response to U.S. tariffs.– PFVS has been added to the Binance Alpha project.– Florida has become the first U.S. state to promote removing capital gains tax on Bitcoin.– President Powell did not comment on the economy or policy outlook in his commencement address at Princeton.CryptocurrenciesTop Gainers:– ZBCN → up 33.1%, reaching $0.00502794– SAROS → up 19.7%, reaching $0.19175176– VIRTUAL → up 17.2%, reaching $2.24– GRASS → up 17.2%, reaching $2.44– JUP → up 17.0%, reaching $0.61145538Top Losers:– USDB → down 1.9%, to $0.98728466– CHEEMS → down 1.5%, to $0.00000162– JST → down 1.0%, to $0.03539383– SYRUP → down 0.9%, to $0.44254981– BORG → down 0.8%, to $0.21739263Fear Index:Bitcoin: 72Ethereum: 58Dominance:Bitcoin: 64.21% ▼ 0.01%Ethereum: 9.14% ▲ 0.10%Daily Total Net ETF InflowsBTC ETFs: $211.70 millionETH ETFs: $58.60 millionGlobal MarketsPresident Trump’s tax cut bill and trade policies are increasing uncertainties about the future of the U.S. economy, while the decision to impose a 50% tariff on goods imported from the European Union and additional tariff threats targeting Apple have brought global trade concerns back into focus. However, Trump announced that the implementation date for these measures has been postponed from June 1 to July 9, 2025.These developments created selling pressure in global stock markets at the end of the week, while demand for goldincreased due to safe haven appeal, and Brent oil prices rose amid supply concerns. As we begin the new week, Trump’s decision to delay the implementation helped improve risk appetite slightly and created a more positive mood in global markets.Meanwhile, U.S. stock markets are closed today for Anna Day, and UK markets are closed due to the spring holiday.Most Valuable Companies and Stock Prices– Microsoft (MSFT) → $3.35 trillion market cap, share price: $450.18, ▼ 1.03%– NVIDIA (NVDA) → $3.2 trillion market cap, share price: $131.29, ▼ 1.16%– Apple (AAPL) → $2.92 trillion market cap, share price: $195.27, ▼ 3.02%– Amazon (AMZN) → $2.13 trillion market cap, share price: $200.99, ▼ 1.04%– Alphabet (GOOG) → $2.05 trillion market cap, share price: $169.59, ▼ 1.39%Borsa IstanbulAccording to domestic data released by the Ministry of Culture and Tourism, the number of foreign tourists increased by 8% year-over-year in April. However, in the first four months of the year, the total number of foreign visitors dropped by 0.6% compared to the same period last year, totaling 10.6 million. By country:– Visitors from Germany increased by 31.3%– From the UK, by 13.3%– But arrivals from Russia and Bulgaria declined by 5.1% and 14.2%, respectivelyThis limited the overall growth rate.Looking at the real sector’s foreign currency position, non-financial firms’ net FX short position decreased by $0.6 billionin March to $153.9 billion. During this period:– FX assets rose by $8.2 billion– FX liabilities increased by $7.7 billion– Domestic loans rose by $3.3 billion– Foreign loans rose by $2.8 billion– Short-term net FX surplus increased by $4.7 billion to $12.4 billionAccording to the CBRT’s May inflation expectations report:– 12-month forward inflation expectations declined to 25.1% among market participants– 41.0% in the real sector– But rose to 59.9% among householdsAt the same time, the CBRT increased reserve requirements for foreign repo transactions and foreign loan users in Turkish lira:– For up to 1-month maturity: raised to 18%– For up to 3-month maturity: raised to 14% (previously 12%)On Friday, the BIST-100 index fell by 1.3%, giving up its weekly gains and dropped to the 240 level in dollar terms, among the lowest levels in the last two years. The newly announced Credit Guarantee Fund (KGF) package included only limited credit expansion, while the U.S. trade war statements added to global selling pressure.This week, local markets will focus on:– Wednesday: Economic confidence index– Thursday: Foreign trade data– Friday: Q1 GDP (national income) and CBRT Financial Stability ReportTechnically, the BIST-100 index tested 9,505 on the last trading day of the week, then pulled back and closed at 9,356. The failure to break above the 9,475/9,500 resistance, and the index staying above 9,331, currently points to more of a consolidation than a decline.– Nearby supports: 9,331, 9,233– Strong support: 9,148–9,044 band– For upside movement: a close above 9,475 could signal optimismImportant levels:– Supports: 9,331 / 9,233 / 9,148 / 9,044 / 8,984– Resistances: 9,475–9,500 / 9,588 / 9,740–9,760 / 9,895 / 9,953Top Market Cap Companies on Borsa Istanbul– QNB Finansbank (QNBTR) → ₺871.84 billion market cap, share price: ₺260.25, no change– Aselsan (ASELS) → ₺621.07 billion market cap, share price: ₺136.40, ▲ 0.15%– Garanti Bank (GARAN) → ₺465.36 billion market cap, share price: ₺110.20, ▼ 0.54%– Turkish Airlines (THYAO) → ₺386.06 billion market cap, share price: ₺281.00, ▲ 0.45%– Koç Holding (KCHOL) → ₺374.30 billion market cap, share price: ₺147.70, ▲ 0.07%Precious Metals and Exchange Rates– Gold: ₺4,155– Silver: ₺41.62– Platinum: ₺1,378– Dollar: ₺39.02– Euro: ₺44.17See you again tomorrow with the latest news!

Daily Market Summary with JrKripto 23 May 2025
You can find today’s edition of “Daily Market with JrKripto,” where we compile the most important developments from global and local markets, below. Let’s analyze the general market conditions together and review the latest evaluations.Bitcoin (BTC) is currently trading at $111,030. The long-term uptrend that began at $75,930 accelerated after surpassing the $101,059 and $104,000 resistance levels, with the price reaching a new all-time high (ATH) at $111,880 today. The limited pullback seen after this peak is considered a healthy profit-taking. If the upward move continues, the next resistance targets stand at $114,500 and $118,300. In potential downward corrections, $108,000 serves as the first strong support, followed by $104,629 and $101,059 as lower support levels. To maintain the positive outlook, staying above $108,000 is crucial.Ethereum (ETH) is currently trading sideways at $2,665. The strong upward trend from $1,486 gained momentum after breaking the $2,453 and $2,595 resistance levels. ETH continues to hold above $2,595, and as long as this level holds, the next resistance targets are $2,800 and $2,981. In case of downward movement, $2,595 will be the first support. If breached, $2,453 and $2,095 will come back into focus. Maintaining above $2,595 is key to preserving ETH’s upward momentum.Crypto NewsSEC approves Canary Staking TRX ETF application.CFTC’s Mersinger: Crypto perpetual futures may be tradable in the U.S.Kraken to offer over 50 tokenized stocks and ETFs, including Apple, Tesla, and NVIDIA.Strategy plans to sell $2.1 billion in preferred shares to fund Bitcoin purchases.Cetus protocol on $SUI exploited.FIFA partners with Avalanche (AVAX) to launch its own blockchain network.Binance to list World Liberty Financial USD (USD1).Top Gainers:MEW → up 27.6%, now at $0.00466798WLD → up 23.0%, now at $1.56DOG → up 21.0%, now at $0.00546503HYPE → up 18.2%, now at $36.83WHYPE → up 17.6%, now at $36.66Top Losers:KTA → down 13.8%, now at $0.73976103TRUMP → down 9.4%, now at $13.95DEEP → down 9.1%, now at $0.19136417FRAX → down 9.1%, now at $3.22WAL → down 8.5%, now at $0.58493299Fear & Greed Index:Bitcoin: 75Ethereum: 60Market Dominance:Bitcoin: 63.81% ▼ 0.31%Ethereum: 9.32% ▲ 0.49%Daily Total Net ETF Inflows:BTC ETFs: $934.80 millionETH ETFs: $110.50 millionGlobal MarketsU.S. stock markets started the day under selling pressure but ended flat thanks to bond market buying. The S&P 500 and Dow Jones indices moved sideways, while the Nasdaq rose 0.28%, with the "Magnificent Seven" tech stocks showing strong performance. Only 3 out of 11 sectors in the S&P 500 closed in the green.S&P Global's services and manufacturing PMI came in at 52.3, beating expectations. This strong performance was supported by potential delays in U.S. tariffs on China. However, existing home sales fell 0.5%, reflecting weakness in that area.Meanwhile, a tax cut bill passed the House of Representatives by a vote of 215 to 214, and now moves to the Senate. This development is shaping market expectations for future tax policies. Still, near-term budget deficit concerns are suppressing demand for bond auctions. As of this morning, U.S. futures are showing mild declines.The VIX volatility index fell 0.6 points to 20.3, indicating a relatively calm market.Weekly jobless claims in the U.S. dropped by 2,000 to 227,000 for the week ending May 17. However, the 4-week average rose by 1,000 to 231,500, signaling slight labor market cooling. Continuing claims rose by 36,000 to 1.9 millionfor the week ending May 10.In Asia, markets were mixed, while European indices opened positively. Today’s U.S. new home sales and building permits data will be closely watched.In Japan, core inflation (excluding fresh food) rose from 3.2% in March to 3.5% in April, pointing to continued price pressures.Most Valuable Companies & Stock PricesMicrosoft (MSFT) → $3.38T market cap, share price: $454.86, ▲ 0.51%NVIDIA (NVDA) → $3.24T market cap, share price: $132.83, ▲ 0.78%Apple (AAPL) → $3.01T market cap, share price: $201.36, ▼ 0.36%Amazon (AMZN) → $2.16T market cap, share price: $203.10, ▲ 0.98%Alphabet (GOOG) → $2.08T market cap, share price: $171.98, ▲ 1.13%Borsa Istanbul (BIST)Yesterday, Borsa Istanbul saw a ~2% intraday rebound, closing near 9,500, driven by expectations related to the Credit Guarantee Fund. There is evidence of foreign buying and inflows from major institutions. However, technical indicators show that momentum is still weak. A clear upward move would require the index to break above the 9,700–9,800 range. As long as this does not happen, a cautious tone may persist.In the short term, 9,530 points is a resistance level, while the 9,350–9,400 band is support. Below that, 9,000–9,100 is seen as the main support zone.Q1 earnings from companies were weak, and rising interest rates prompted downward revisions in target prices. However, these were not as severe as expected. The 12-month average target for BIST 100, previously around 14,400 points, has been revised to 13,800. This still suggests an upside potential of about 46%—but for this to materialize, new market catalysts are needed, such as:Falling interest ratesAccelerating economic growthReduction in domestic and global political/economic uncertaintyUntil these factors align, no meaningful short-term rally is expected.Today, the market will follow the CBRT’s weekly foreign investor flows report. While there was a $670 million inflow over the past four weeks, a significant outflow is expected for the May 12–16 week.Turkey’s 5-year CDS started the day at 298 basis points, indicating continued high risk perception.According to the CBRT’s second Inflation Report of the year, inflation forecasts remain:2025 year-end: 24%2026: 12%2027: 8%The upper and lower bounds of these forecasts remain unchanged (e.g., 19–29% for 2025), and the CBRT notes that upward and downward risks are currently balanced.Highest Market Cap Companies on Borsa Istanbul:QNB Finansbank (QNBTR) → 886.08B TL market cap, share price: 262.75 TL, ▼ 0.66%Aselsan (ASELS) → 624.72B TL market cap, share price: 136.10 TL, ▼ 0.66%Garanti Bank (GARAN) → 472.08B TL market cap, share price: 113.20 TL, ▲ 0.71%Turkish Airlines (THYAO) → 392.26B TL market cap, share price: 285.00 TL, ▲ 0.26%Koç Holding (KCHOL) → 382.41B TL market cap, share price: 151.20 TL, ▲ 0.27%Precious Metals and Exchange RatesGold: 4,155 TLSilver: 41.62 TLPlatinum: 1,378 TLUSD: 39.02 TLEUR: 44.17 TLSee you again tomorrow with the latest updates!

Daily Market Summary with JrKripto 22 May 2025
You can find today’s edition of “Daily Market with JrKripto”, where we compile the most important developments in global and local markets, below. Let’s analyze general market conditions together and review the latest insights.Bitcoin (BTC) is currently trading at $110,600. The long-term uptrend that began at $75,930 gained momentum after breaking through the $101,059 and $104,000 resistance levels, and as of today, BTC has reached $111,880, setting a new all-time high (ATH). The slight pullback following this new peak can be seen as a natural profit-taking movement. If the upward momentum continues, potential resistance levels to watch are $114,500 and $118,300. In downward corrections, the first support is at $108,000; below that, $104,629 and $101,059 stand out as key support zones. Maintaining stability above $108,000 is critical for BTC to sustain its bullish trend.Ethereum (ETH) is currently trading at $2,665. The strong rally from $1,486 has accelerated with the breakout of the $2,453 and $2,595 resistance levels. With current pricing, ETH’s next potential targets are $2,800 and $2,981. In possible correction scenarios, the first support level will be $2,595. If this level breaks, $2,453 and $2,095 are the next support areas to watch. To maintain upward momentum, ETH needs to hold above $2,595.Crypto NewsBinance to list World Liberty Financial USD (USD1)Senator Cynthia Lummis said Americans are ready to update U.S. gold reserves with BitcoinSEC approved in-kind redemptions for BlackRock's Spot Ethereum ETFThe Texas House of Representatives officially passed the Strategic Bitcoin Reserve Act SB21WLD raised $135 million from Andreessen Horowitz and Bain Capital Crypto to fund network expansionBitcoin breaks its all-time high with a new recordTether minted $2 billion USDTTop Gainers:SPX → Up 25.1%, now at $0.92172304DOG → Up 24.8%, now at $0.00452217FARTCOIN → Up 21.0%, now at $1.56WIF → Up 20.6%, now at $1.16POPCAT → Up 19.8%, now at $0.53627774Top Losers:OM → Down 3.2%, now at $0.4199871KAITO → Down 2.3%, now at $2.10FRAX → Down 1.8%, now at $3.65DEXE → Down 1.1%, now at $12.61BTSE → Down 0.5%, now at $1.51Fear & Greed Index:Bitcoin: 71 (Greed)Ethereum: 60 (Greed)Dominance:Bitcoin: 64.21% ▼ 0.13%Ethereum: 9.16% ▲ 0.81%Daily Total Net ETF InflowsBTC ETFs: $607.10 millionETH ETFs: $1 millionGlobal MarketsConcerns over tax cuts in the U.S. and the resulting budget deficit led to weak demand in the bond market and selling pressure in equity markets. Particularly, the weak demand for the 20-year U.S. Treasury auction caused a sharp increase in yields. While these budget concerns create short-term pressure, a potential corporate tax cut in the future could support U.S. equities.U.S. stock indexes started the day lower, attempted to recover during the session, but fell again after the Treasury auction and ended the day with losses. The 20-year bond yield came in at 5.04%. The 2-year yield rose by 5 basis points, climbing above 4.00%, while 10- and 20-year yields rose by 11 basis points.As a result:S&P 500 fell 1.61%Dow Jones fell 1.91%Nasdaq fell 1.41%10 of the 11 major sectors in the S&P 500 closed negative. The only sector in the green was telecommunications, with a 0.67% gain. The steepest losses were in real estate (-2.63%), healthcare (-2.37%), financials (-2.05%), and infrastructure (-1.91%).Today’s economic data includes:S&P Global PMIHome sales data10-year TIPS (inflation-indexed bonds) auctionU.S. index futures are showing a flat trend in early hours, while European futures and Asian markets display a selling bias. European markets are also expected to start the day weak.Top Companies and Stock PricesMicrosoft (MSFT) → $3.36T market cap, stock price $452.57, ▼ 1.22%NVIDIA (NVDA) → $3.21T market cap, stock price $131.80, ▼ 1.92%Apple (AAPL) → $3.02T market cap, stock price $202.09, ▼ 2.31%Amazon (AMZN) → $2.14T market cap, stock price $201.12, ▼ 1.45%Alphabet (GOOG) → $2.05T market cap, stock price $170.06, ▲ 2.87%Borsa IstanbulThe BIST 100 index failed to break through the 9750–9800 resistance range for four consecutive days last week and fell slightly below 9400 amid continued capital outflows. Short-term indicators show weakening momentum, and the weak outlook in global markets is adding pressure on BIST.In this context, the 9200–9250 range is the first key support zone. On the upside, 9500 is the critical resistance.Following weak Q1 2025 earnings, analysts revised their BIST 100 target price downward. The new 12-month target average is around 13,800, implying a 47% potential return. However, the lack of strong catalysts to realize this potential reinforces the view that “a stock market that can’t rise, falls,” bringing the 9000–9100 zone back into focus.Today, attention in Türkiye is on the CBRT’s second Inflation Report of the year. In February, the central bank raised its 2025 year-end inflation forecast from 21% to 24%, while maintaining the 2026 forecast at 12%. The report will be released at 10:30 AM. Key data releases today also include:Manufacturing capacity utilization rateReal sector confidence indexSectoral confidence indicesMeanwhile, the Treasury has authorized Bank of America, BNP Paribas, HSBC, and Morgan Stanley for a new 2032 dollar-denominated bond issuance abroad. According to Bloomberg, the issue totals $2 billion with a yield of 7.45%. This brings the total international issuance for the year to $4.5 billion.Yesterday, the BIST 100 dropped for the second day in a row, closing down 1.2% at 9398 points. It is still up 3.5% for the month but down 4.4% year-to-date. Energy and REIT stocks slightly outperformed, while Turkish Airlines, Pegasus, Koç Holding, and Ereğli weighed on the index. Retail stocks also saw continued selling pressure.Technically, the close below 9475 signals continued weakness. Immediate support levels are at 9331–9233, with stronger support at 9148–9044. If the downward move persists, 8984 will be the next level to watch. On the upside, a close above 9475 is needed for recovery. Key resistance levels are:9475, 9740–9760, 9895, and 9953.A stabilization attempt may be seen today after two days of decline.Top Companies by Market Cap on Borsa IstanbulQNB Finansbank (QNBTR) → ₺893.61B market cap, ₺265.00 per share, ▼ 0.66%Aselsan (ASELS) → ₺606.48B market cap, ₺131.60 per share, ▼ 1.05%Garanti Bank (GARAN) → ₺467.04B market cap, ₺113.50 per share, ▲ 2.07%Turkish Airlines (THYAO) → ₺386.06B market cap, ₺280.25 per share, ▲ 0.18%Koç Holding (KCHOL) → ₺383.93B market cap, ₺150.50 per share, ▼ 0.59%Precious Metals & Exchange RatesGold: ₺4172Silver: ₺41.52Platinum: ₺1337USD/TRY: ₺38.83EUR/TRY: ₺44.04See you again tomorrow with the latest updates!

Daily Market Summary with JrKripto 21 May 2025
You can find today’s edition of “Daily Market with JrKripto,” where we compile the most important developments from global and local markets, below. Let’s analyze the general market conditions together and review the latest evaluations.Bitcoin (BTC) is currently trading at $104,700. The upward trend that started at $75,930 has continued strongly after breaking through the resistance levels of $101,059 and $104,000. Most recently, BTC is priced above the $104,629 resistance. If it maintains permanence above this level, the next targets appear to be $108,000 and $109,850. In the event of a pullback, $104,629 now serves as the first support level. Below that, $101,059 and subsequently $96,115 can be followed as support. While the overall trend remains positive, holding above $104,629 is critical for the continuation of the rise.Ethereum (ETH) is currently trading at $2,480. After starting its rise from the $1,486 level, it broke the $2,453 resistance and tested $2,595 before pulling back. At present, ETH is trying to hold above the $2,453 level. If this support holds, $2,595 and $2,981 could again become targets. However, if it drops below $2,453, the levels of $2,095 and $1,790 should be watched as support levels. Maintaining above $2,453 is important for ETH to preserve its positive outlook.Crypto NewsIndia’s Supreme Court stated that cryptocurrencies should be regulated rather than banned.Coinbase’s customer data theft will be investigated by the DOJ.The SEC has delayed its decision on Fidelity’s spot Solana ETF application.Trump said his meeting with Putin went very well and that ceasefire negotiations between Russia and Ukraine would begin immediately.Putin: "My meeting with Trump was very meaningful. It was very informative and beneficial."JPMorgan CEO Jamie Dimon announced that the company will not offer Bitcoin custody services but will allow customers to purchase Bitcoin.A class action lawsuit has been filed against MicroStrategy and its executives for allegedly making misleading statements about their Bitcoin strategy.The Central Bank of Russia plans to lift restrictions on financial instruments linked to Bitcoin and cryptocurrencies.Top Gainers:KTA → up 31.0%, reached $0.80163842LAUNCHCOI → up 21.8%, reached $0.24297025AAVE → up 19.7%, reached $261.82SYRUP → up 15.9%, reached $0.36833722SPX → up 11.8%, reached $0.72499049Top Losers:PYTH → down 8.3%, dropped to $0.13006234NEIRO → down 5.6%, dropped to $0.00053275AMP → down 5.2%, dropped to $0.00463428IP → down 3.5%, dropped to $4.58SFP → down 3.1%, dropped to $0.54123572Fear & Greed Index:Bitcoin: 72 (Greed)Ethereum: 61 (Greed)Dominance:Bitcoin: 63.80% ▼ 0.13%Ethereum: 9.33% ▲ 0.38%Daily Total Net ETF Inflows:BTC ETFs: $667.40 millionETH ETFs: $13.70 millionGlobal MarketsVolatility in global markets continues, though signs of recovery are evident this morning. Following a 90-day trade agreement between the U.S. and China, tariff-related concerns have taken a backseat for now. Meanwhile, credit rating agency Moody’s downgraded the U.S. credit rating by one notch to Aa1 for the first time in 108 years, citing high debt and widening deficits. The outlook was revised from “negative” to “stable.”Despite the pressure from the downgrade, a constructive two-hour meeting between President Donald Trump and Russian President Vladimir Putin, with calls to begin peace talks for the Russia-Ukraine war, helped limit market fallout.Markets started the day with selling pressure due to Moody’s move but later recovered thanks to buying activity. Stock and bond markets ended the day flat to slightly positive. The U.S. 10-year Treasury yield tested 4.56% during the day but fell to 4.45% on increased buying.Out of the 11 major sectors in the S&P 500, 7 closed in positive territory. The top-performing sectors were healthcare (+0.96%), consumer staples (+0.42%), and industrials (+0.38%). Energy (-1.55%) and consumer discretionary (-0.27%) were the weakest.New York Fed President John Williams and Atlanta Fed President Raphael Bostic stated there were no short-term rate cut expectations. Meanwhile, China’s central bank (PBOC) cut its policy rate by 10 basis points for the first time in 7 months to support markets. This move was welcomed in Asia, and European markets are expected to start the day positively.Most Valuable Companies & Stock PricesMicrosoft (MSFT) → $3.41T market cap, stock at $458.87, up 1.01%NVIDIA (NVDA) → $3.31T market cap, stock at $135.57, up 0.13%Apple (AAPL) → $3.12T market cap, stock at $208.78, down 1.17%Amazon (AMZN) → $2.19T market cap, stock at $206.16, unchangedAlphabet (GOOG) → $2.03T market cap, stock at $167.87, up 0.26%Borsa IstanbulAfter climbing from the 9,000 level to 9,800, the BIST 100 index remains in search of direction. Toward the week’s close, limited capital inflows replaced recent outflows, leading to a recovery trend—especially driven by the banking sector. Today, the effort to hold above the 9,600 level is expected to continue.While today’s data calendar is relatively quiet, the Inflation Report to be released by the CBRT on Thursday will be a key highlight for monetary policy direction. Turkey’s 5-year CDS started the day at 295 basis points, signaling relatively balanced risk perception.According to CBRT’s May Market Participants Survey, year-end inflation expectations rose slightly from 30% to 30.35%. The end-2026 forecast is 20.6%, 24-month forward expectation is 17.8%, and 5-year forward is 11.2%, showing little change from the previous month.Bloomberg HT’s Consumer Confidence Preliminary Index dropped by 1.8% in May to 70.90, signaling a slight decline in consumer confidence.The BIST 100 index finished last week with a 3.0% gain, mainly due to strong demand for banking stocks. The average weekly return of bank shares was 6.9%. Globally, the highlight was the announcement that Russia-Ukraine peace negotiations would begin urgently following the Trump-Putin meeting.This week’s data calendar includes:Today: Consumer confidence indexThursday: Real sector and sectoral confidence indices, capacity utilization rateFriday: Sectoral inflation expectationsThe focus is clearly on Thursday’s Inflation Report.Technically, the BIST 100 tested 9,516 during the day and closed at 9,668. The 9,475–9,580 range remains a key support zone. Staying above these levels suggests continued upward movement. A break above 9,740–9,760 could bring the 9,895 resistance level back into play. However, falling below the 9,475–9,580 band could trigger renewed weakness.Key Support Levels: 9,490/9,475, 9,230, 9,044Key Resistance Levels: 9,740/9,760, 9,895, 9,953Highest Market Cap Companies on Borsa Istanbul:QNB Finansbank (QNBTR) → 901.15B TL market cap, stock at 267.00 TL, down 0.74%Aselsan (ASELS) → 632.02B TL market cap, stock at 130.80 TL, down 5.63%Garanti Bank (GARAN) → 475.86B TL market cap, stock at 114.00 TL, up 0.62%Turkish Airlines (THYAO) → 404.34B TL market cap, stock at 290.25 TL, down 0.94%Koç Holding (KCHOL) → 403.21B TL market cap, stock at 158.00 TL, down 0.63%Precious Metals and Exchange RatesGold: 4,006 TLSilver: 39.87 TLPlatinum: 1,226 TLDollar: 38.83 TLEuro: 43.72 TLSee you again tomorrow with the latest news!

Daily Market Summary with JrKripto 20 May 2025
You can find today’s edition of “Daily Market with JrKripto,” where we compile the most important developments from global and local markets, below. Let’s analyze the general market conditions together and review the latest evaluations.Bitcoin (BTC) is currently trading at $104,700. The upward trend that started at $75,930 has continued strongly after breaking through the resistance levels of $101,059 and $104,000. Most recently, BTC is priced above the $104,629 resistance. If it maintains permanence above this level, the next targets appear to be $108,000 and $109,850. In the event of a pullback, $104,629 now serves as the first support level. Below that, $101,059 and subsequently $96,115 can be followed as support. While the overall trend remains positive, holding above $104,629 is critical for the continuation of the rise.Ethereum (ETH) is currently trading at $2,480. After starting its rise from the $1,486 level, it broke the $2,453 resistance and tested $2,595 before pulling back. At present, ETH is trying to hold above the $2,453 level. If this support holds, $2,595 and $2,981 could again become targets. However, if it drops below $2,453, the levels of $2,095 and $1,790 should be watched as support levels. Maintaining above $2,453 is important for ETH to preserve its positive outlook.Crypto NewsIndia’s Supreme Court stated that cryptocurrencies should be regulated rather than banned.Coinbase’s customer data theft will be investigated by the DOJ.The SEC has delayed its decision on Fidelity’s spot Solana ETF application.Trump said his meeting with Putin went very well and that ceasefire negotiations between Russia and Ukraine would begin immediately.Putin: "My meeting with Trump was very meaningful. It was very informative and beneficial."JPMorgan CEO Jamie Dimon announced that the company will not offer Bitcoin custody services but will allow customers to purchase Bitcoin.A class action lawsuit has been filed against MicroStrategy and its executives for allegedly making misleading statements about their Bitcoin strategy.The Central Bank of Russia plans to lift restrictions on financial instruments linked to Bitcoin and cryptocurrencies.Top Gainers:KTA → up 31.0%, reached $0.80163842LAUNCHCOI → up 21.8%, reached $0.24297025AAVE → up 19.7%, reached $261.82SYRUP → up 15.9%, reached $0.36833722SPX → up 11.8%, reached $0.72499049Top Losers:PYTH → down 8.3%, dropped to $0.13006234NEIRO → down 5.6%, dropped to $0.00053275AMP → down 5.2%, dropped to $0.00463428IP → down 3.5%, dropped to $4.58SFP → down 3.1%, dropped to $0.54123572Fear & Greed Index:Bitcoin: 72 (Greed)Ethereum: 61 (Greed)Dominance:Bitcoin: 63.80% ▼ 0.13%Ethereum: 9.33% ▲ 0.38%Daily Total Net ETF Inflows:BTC ETFs: $667.40 millionETH ETFs: $13.70 millionGlobal MarketsVolatility in global markets continues, though signs of recovery are evident this morning. Following a 90-day trade agreement between the U.S. and China, tariff-related concerns have taken a backseat for now. Meanwhile, credit rating agency Moody’s downgraded the U.S. credit rating by one notch to Aa1 for the first time in 108 years, citing high debt and widening deficits. The outlook was revised from “negative” to “stable.”Despite the pressure from the downgrade, a constructive two-hour meeting between President Donald Trump and Russian President Vladimir Putin, with calls to begin peace talks for the Russia-Ukraine war, helped limit market fallout.Markets started the day with selling pressure due to Moody’s move but later recovered thanks to buying activity. Stock and bond markets ended the day flat to slightly positive. The U.S. 10-year Treasury yield tested 4.56% during the day but fell to 4.45% on increased buying.Out of the 11 major sectors in the S&P 500, 7 closed in positive territory. The top-performing sectors were healthcare (+0.96%), consumer staples (+0.42%), and industrials (+0.38%). Energy (-1.55%) and consumer discretionary (-0.27%) were the weakest.New York Fed President John Williams and Atlanta Fed President Raphael Bostic stated there were no short-term rate cut expectations. Meanwhile, China’s central bank (PBOC) cut its policy rate by 10 basis points for the first time in 7 months to support markets. This move was welcomed in Asia, and European markets are expected to start the day positively.Most Valuable Companies & Stock PricesMicrosoft (MSFT) → $3.41T market cap, stock at $458.87, up 1.01%NVIDIA (NVDA) → $3.31T market cap, stock at $135.57, up 0.13%Apple (AAPL) → $3.12T market cap, stock at $208.78, down 1.17%Amazon (AMZN) → $2.19T market cap, stock at $206.16, unchangedAlphabet (GOOG) → $2.03T market cap, stock at $167.87, up 0.26%Borsa IstanbulAfter climbing from the 9,000 level to 9,800, the BIST 100 index remains in search of direction. Toward the week’s close, limited capital inflows replaced recent outflows, leading to a recovery trend—especially driven by the banking sector. Today, the effort to hold above the 9,600 level is expected to continue.While today’s data calendar is relatively quiet, the Inflation Report to be released by the CBRT on Thursday will be a key highlight for monetary policy direction. Turkey’s 5-year CDS started the day at 295 basis points, signaling relatively balanced risk perception.According to CBRT’s May Market Participants Survey, year-end inflation expectations rose slightly from 30% to 30.35%. The end-2026 forecast is 20.6%, 24-month forward expectation is 17.8%, and 5-year forward is 11.2%, showing little change from the previous month.Bloomberg HT’s Consumer Confidence Preliminary Index dropped by 1.8% in May to 70.90, signaling a slight decline in consumer confidence.The BIST 100 index finished last week with a 3.0% gain, mainly due to strong demand for banking stocks. The average weekly return of bank shares was 6.9%. Globally, the highlight was the announcement that Russia-Ukraine peace negotiations would begin urgently following the Trump-Putin meeting.This week’s data calendar includes:Today: Consumer confidence indexThursday: Real sector and sectoral confidence indices, capacity utilization rateFriday: Sectoral inflation expectationsThe focus is clearly on Thursday’s Inflation Report.Technically, the BIST 100 tested 9,516 during the day and closed at 9,668. The 9,475–9,580 range remains a key support zone. Staying above these levels suggests continued upward movement. A break above 9,740–9,760 could bring the 9,895 resistance level back into play. However, falling below the 9,475–9,580 band could trigger renewed weakness.Key Support Levels: 9,490/9,475, 9,230, 9,044Key Resistance Levels: 9,740/9,760, 9,895, 9,953Highest Market Cap Companies on Borsa Istanbul:QNB Finansbank (QNBTR) → 901.15B TL market cap, stock at 267.00 TL, down 0.74%Aselsan (ASELS) → 632.02B TL market cap, stock at 130.80 TL, down 5.63%Garanti Bank (GARAN) → 475.86B TL market cap, stock at 114.00 TL, up 0.62%Turkish Airlines (THYAO) → 404.34B TL market cap, stock at 290.25 TL, down 0.94%Koç Holding (KCHOL) → 403.21B TL market cap, stock at 158.00 TL, down 0.63%Precious Metals and Exchange RatesGold: 4,006 TLSilver: 39.87 TLPlatinum: 1,226 TLDollar: 38.83 TLEuro: 43.72 TLSee you again tomorrow with the latest news!

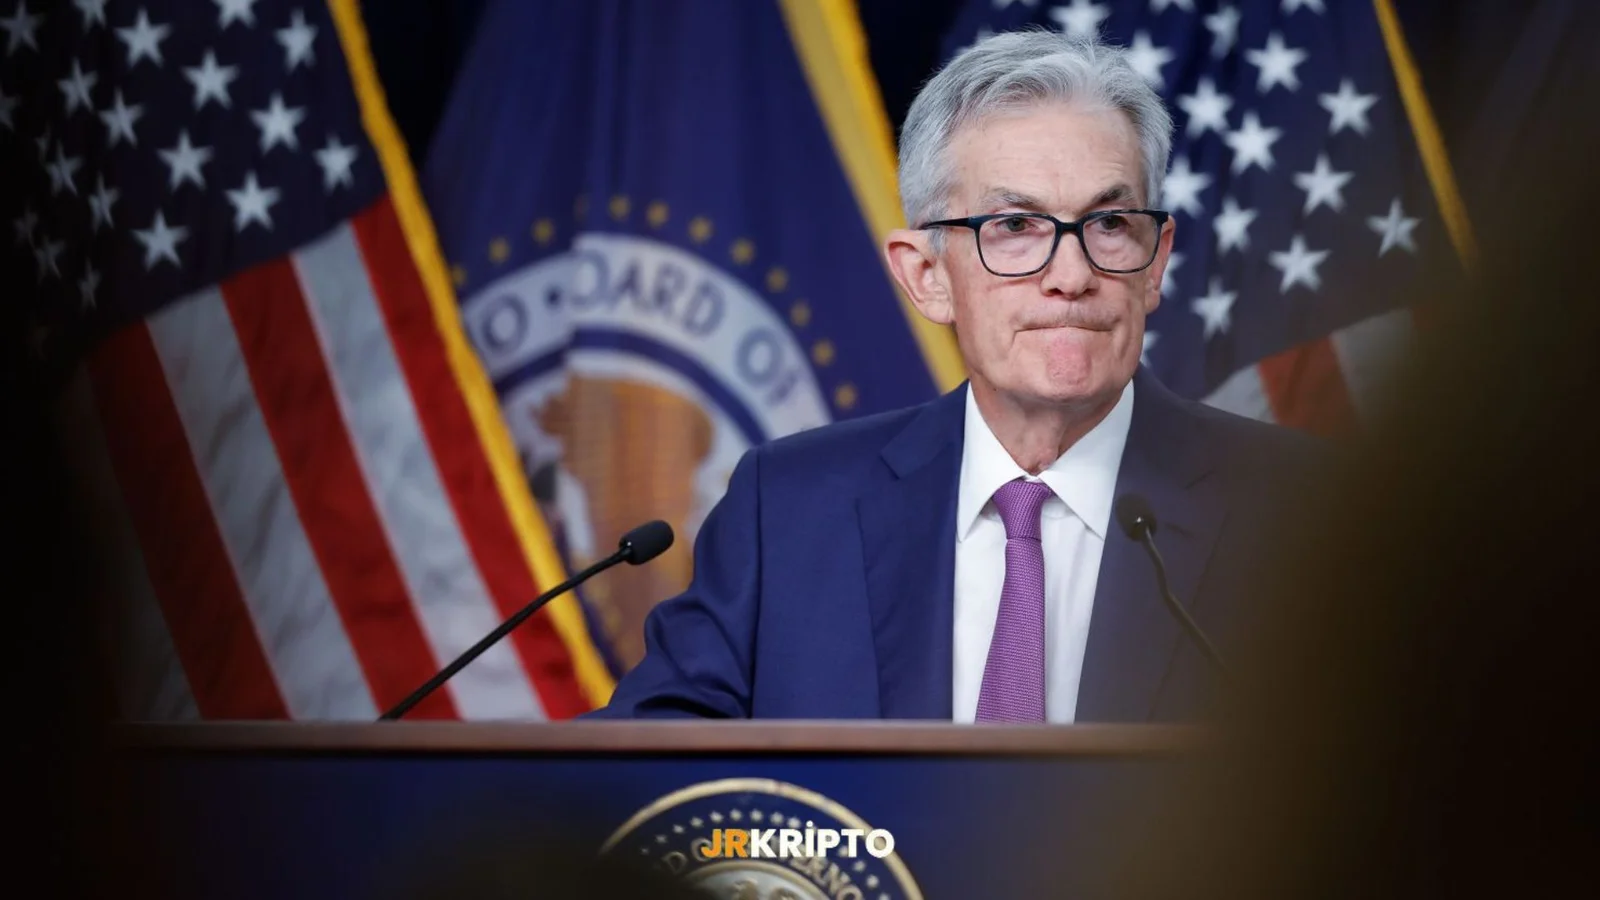
Data Showed Hope, Powell Did not Release the Brake
We are in a critical turning point week for the U.S. economy. The Producer Price Index (PPI) data announced on May 15 and the statements made by Fed Chair Jerome Powell on the same day gave critical signals for the direction of the markets.There Is a Softening on the Inflation FrontIn April, PPI was announced at 2.4% on a yearly basis. The expectation was 2.5%. The previous figure was 2.7%. On a monthly basis, while a 0.2% increase was expected, PPI showed a 0.5% decrease. This picture reveals that price pressure on the producer side has started to ease.The data is a strong indication that inflation has lost its upward momentum. However, this alone does not mean a permanent decline. Powell was already clear on this.Powell: Supply Shocks Are Becoming PermanentFed Chair Jerome Powell emphasized in his statements that “we are now in a period where supply shocks may occur more frequently,” highlighting the need for the central bank to adopt a new monetary policy framework. Updating the approach adopted after 2020 is on the agenda.Powell stated that they no longer consider the idea that “inflation would naturally decline after some weakening” to be valid, and noted that the framework forming the basis of monetary policy must function more robustly in high uncertainty environments.The Fed Will Remain Cautious But the Door to a Rate Cut Is OpeningThe data caused short-term relief in the market. Especially a decline in bond yields and a recovery in technology stocks were seen. However, Powell's tone shows that the Fed is still far from making a sudden rate cut decision.Nevertheless, the slowdown in inflation and the weakness in growth data keep the expectation of a rate cut during the summer months on the table. Trump and Powell U.S. Federal Reserve Preparing a New StrategyThe U.S. Federal Reserve (Fed) aims to review its monetary policy strategy in 2025 to adapt to the economic changes experienced in the last five years. In his statement on May 15, Fed Chair Jerome Powell stated that the “average inflation targeting” approach adopted in 2020 is no longer valid. This strategy allowed inflation to temporarily exceed 2% to compensate for periods when inflation remained below the target. However, when inflation reached 7.2% in 2021, it became clear that this approach was unsustainable.Strategic Revision and New ApproachesPowell stated that the Fed’s current strategy has become inadequate in an economic environment where supply shocks are more frequent and persistent. For this reason, significant changes are planned for the Fed's document on "long-term goals and monetary policy strategy." In particular, redefinition of the concept of “shortfalls” in employment and a review of the inflation targeting approach are on the agenda.Changes in Communication StrategyThe Fed aims to restructure not only its policy tools but also its communication strategy. Powell emphasized the importance of providing clearer and more transparent information to the public and markets during periods of increased economic uncertainty. In this context, it is planned to better communicate the uncertainties in economic forecasts and make the Fed’s decision-making processes more understandable.Developments in Inflation and UnemploymentAs of April 2025, personal consumption expenditures (PCE) inflation dropped to 2.2%, aligning with the Fed’s 2% target. This decline occurred without a sharp rise in the unemployment rate; this is considered a rare success in history.Future ExpectationsPowell stated that the Fed’s new strategic framework will be completed by the summer of 2025 and that this framework will be more resilient to economic fluctuations. However, the Fed’s 2% inflation target and its commitment to keeping inflation expectations anchored will not change. These revisions will allow the Fed to manage its monetary policy more flexibly and effectively.Key Points – Highlights During the Strategy ReviewThe economic environment has significantly changed since 2020.Long-term real interest rates are noticeably high; inflation expectations are stable.Inflation fell from 7.2% to 2.2%, but combating it remains an important task.The decline in inflation occurred without a sharp increase in unemployment—a rare situation historically.The risk of more frequent and persistent supply shocks in the economy has increased.A prolonged period of low interest rates is no longer the baseline scenario for the foreseeable future.It is important to keep inflation expectations anchored at the 2% target.The Fed’s 2025 strategy review will be completed in the coming months.The definition related to “shortfalls” in employment is planned to be revised.The Fed’s communication needs to be clearer, especially during periods of economic uncertainty.The magnitude of uncertainty in forecasts must be better communicated to the public and markets.The reform of the Federal Reserve System’s strategic documents will be adapted to new economic conditions.Maintaining transparency and trust in the regulator’s actions remains a priority.
Daily Market Summary with JrKripto 15 May 2025
You can find today’s “Daily Market with JrKripto,” where we compile the most important developments in global and local markets, below. Let’s analyze the general market conditions together and take a look at the latest evaluations.Bitcoin (BTC) is currently trading at $101,550. The strong upward trend that started from the $75,930 level gained significant momentum after surpassing the $101,059 and $104,000 resistance levels. However, with the selling pressure from the $104,629 level, a short-term pullback is being observed in BTC. Currently, the $101,059 level is being tested as a critical support. If staying above this zone is maintained, the upward movement may regain strength, and if the $104,629 resistance is surpassed, the $108,000 and $109,850 levels may again become targets. On the other hand, if the $101,059 support is lost, the $96,115 and $94,570 levels are strong support zones to follow on the downside.Ethereum (ETH) has dropped to the $2,530 level. With the strong rise that started from the $1,486 support, ETH broke the $2,453 resistance and, after testing the $2,595 level, faced some profit-taking. It is currently trading above the $2,453 level. As long as it remains above this zone, with the continuation of the upward trend, the $2,595 and $2,981 levels may again become targets. However, in case the $2,453 level is broken to the downside, the $2,095 and $1,790 levels should be followed as the next support zones. To maintain the positive outlook in ETH, price action above $2,453 is important.Crypto NewsPresident Trump stated that India has offered zero customs duty on U.S. goods.JP Morgan completed the first publicly tokenized bond transaction on the Ondo blockchain.Trump: We are ahead of China in crypto.Trump: I am a big crypto fan.Coinbase announced that cbADA, cbDOGE, cbLTC, and cbXRP are coming soon.Twent One announced that it purchased 4,812 BTC at an average price of 95,300.CryptocurrenciesTop Gainers:FAI → Increased by 38.5%, reaching $0.02676225.ATH → Increased by 20.2%, reaching $0.05417113.LAUNCHCOI → Increased by 18.9%, reaching $0.24307398.AMP → Increased by 13.2%, reaching $0.00516593.NEIRO → Increased by 8.3%, reaching $0.0006159.Top Losers:PI → Decreased by 25.1%, falling to $0.88510663.GIGA → Decreased by 14.7%, falling to $0.02361419.TOSHI → Decreased by 14.3%, falling to $0.00068798.TDCCP → Decreased by 13.1%, falling to $0.36088537.PYTH → Decreased by 12.8%, falling to $0.16686662.Fear Index:Bitcoin: 71 (Greed)Ethereum: 60 (Greed)Dominance:Bitcoin: 62.59% ▲ 0.01%Ethereum: 9.56% ▼ 0.27%Daily Total Net ETF InflowsBTC ETFs: $319.50 MillionETH ETFs: $63.50 MillionThank you, and here are the data to be announced on Thursday, May 15, 2025:Data to Watch Today15:30 – Core Retail Sales (Monthly) (April)Expectation: 0.3% – Previous: 0.5%15:30 – Jobless ClaimsExpectation: 229K – Previous: 228K15:30 – Philadelphia Fed Manufacturing Index (May)Expectation: -11.3 – Previous: -26.415:30 – Producer Price Index (PPI) (Monthly) (April)Expectation: 0.2% – Previous: -0.4%15:30 – Retail Sales (Monthly) (April)Expectation: 0.0% – Previous: 1.4%15:40 – Fed Chair Powell’s SpeechGlobal MarketsPositive developments in global trade and the U.S.'s agreements with Gulf countries on the technology sector led to strong gains, especially in tech stocks. With these developments, the Nasdaq index rose by 0.72%, the S&P 500 gained 0.10%, while the Dow Jones index declined by 0.21%.Among the 11 main sectors in the S&P 500 index, technology, telecommunications, and consumer discretionary sectors showed gains. The weakest performance came from the healthcare sector, which fell by 2.31%, followed by the materials sector (0.96%) and real estate sector (0.90%).Especially Nvidia and Tesla shares contributed significantly to the overall performance of the technology sector, rising by 16% and 16.6% respectively in the first three trading days of the week.With U.S. crude oil inventories showing the highest increase in the last two months, concerns about oversupply in oil prices increased. Brent oil fell by 0.8% to $66.1, while U.S. crude oil inventories rose by 3.5 million barrels last week to reach 441.8 million barrels.Gold prices also fell by 2.2%, declining to $3,177/ounce, the lowest level in the last five weeks, due to reduced safe-haven demand amid decreasing economic uncertainties.The U.S. 10-year bond yield rose to 4.54%, the highest level since February 18, while the 2-year bond yield climbed to 4.05%, the highest since February 27. This indicates a continued upward trend in bond market interest rates. The spread between the 10-year and 2-year bond yields increased from 46 to 49 basis points.The Dollar Index (DXY) ended the day flat at 101.0. The euro/dollar parity closed the day down by 0.2% at 1.118.While a mixed outlook dominates Asian stock markets this morning, European markets are expected to start the day with a flat to slightly negative trend. Today, U.S. PPI (Producer Price Index) data for April stands out in the economic calendar. Also, peace negotiations between Russia and Ukraine are planned to be held in Istanbul today and are being closely followed by the markets.Most Valuable Companies and Stock PricesMicrosoft (MSFT) → $3.37T market cap, $452.94 per share, up 0.85%NVIDIA (NVDA) → $3.30T market cap, $135.34 per share, up 4.16%Apple (AAPL) → $3.17T market cap, $212.33 per share, down 0.28%Amazon (AMZN) → $2.23T market cap, $210.25 per share, down 0.53%Alphabet (GOOG) → $2.01T market cap, $166.81 per share, up 3.68%Borsa İstanbulDomestically, today’s key data includes the central government’s April budget balance, the March service and construction production indices, and the number of salaried employees. In March, the central government budget deficit came in at TRY 261.5 billion, below the Treasury’s previously announced cash deficit of TRY 298.4 billion. In April, the Treasury’s cash balance posted a deficit of TRY 183.5 billion, while the primary balance recorded a surplus of TRY 73.6 billion. The service production index had lost momentum in February; the annual increase, which was 7.0% in January, slowed to 1.2% in February.Yesterday, Borsa Istanbul showed a generally flat market trend. Shares of Garanti Bank, Turkcell, and Aselsan outperformed, while sales pressure on Turkish Airlines (THY), which holds significant weight in the index, limited the upward movement. Additionally, expectations of extended settlement periods due to the upcoming May 19th public holiday led to cautious market behavior. On top of that, news suggesting that top leaders will not attend the Russia–Ukraine ceasefire talks dampened market optimism. However, any potential ceasefire decision coming out of today’s discussions could positively impact market sentiment. Therefore, a slightly bullish tone is expected on the BIST today.From a technical perspective, the BIST100 index dropped to 9,658 during the session but recovered with reactionary buying to close at 9,702. The index’s ability to stay above the 9,475–9,580 band—considered a transition zone—signals continued market optimism. As long as this zone holds, upward momentum could strengthen, and if the 9,740/9,750 intermediate resistance is surpassed, the 9,895 resistance could come into play. Hence, the 9,580–9,475 range now serves as a critical support zone.Top Companies by Market Capitalization on Borsa IstanbulQNB Finansbank (QNBTR) → Market Cap: TRY 929.63 billion, Share Price: TRY 270.75, ▼ 2.43%Aselsan Electronic Industry (ASELS) → Market Cap: TRY 629.28 billion, Share Price: TRY 139.40, ▲ 1.01%Garanti Bank (GARAN) → Market Cap: TRY 477.12 billion, Share Price: TRY 111.50, ▼ 1.85%Turkish Airlines (THYAO) → Market Cap: TRY 412.62 billion, Share Price: TRY 298.00, ▼ 0.33%ENKA Construction and Industry (ENKAI) → Market Cap: TRY 398.61 billion, Share Price: TRY 67.65, ▼ 0.51%Precious Metals and Currency RatesGold: TRY 3,940Silver: TRY 39.87Platinum: TRY 1,226USD/TRY: 38.77EUR/TRY: 43.49Looking forward to seeing you again tomorrow with the latest updates!

Daily Market Summary with JrKripto 14 May 2025
You can find today’s “Daily Market with JrKripto,” where we compiled the most important developments in global and local markets, below. Let’s analyze the general market conditions together and take a look at the latest evaluations.Bitcoin (BTC) is currently trading at $103,170. The strong upward trend that started from the $75,930 level gained momentum after surpassing the $101,059 and $104,000 resistance levels. However, with the price pulling back from the $104,629 level, a short-term correction movement is being observed. During this process, the $101,059 level stands out as the first significant support. If this level is maintained, the upward trend may gain momentum again, and if the $104,629 resistance is broken, the targets of $108,000 – $109,850 may come back into focus. Otherwise, the $96,115 and $94,570 levels will be followed as support levels in downward movements.Ethereum (ETH), on the other hand, is trading at the $2,600 level. With the effect of the upward movement that started from the $1,486 level, the $2,453 resistance was broken, and the price rose up to the $2,550 level. However, with some profit-taking at this point, the price has pulled back slightly. Currently, the $2,453 level is being tested as support. If it can remain above this level, the $2,595 and $2,981 resistance levels may once again become targets. However, if it drops below $2,453, the $2,095 and $1,790 levels should be followed as gradual support zones. Holding above $2,453 is critically important for the upward trend in ETH to continue.Crypto NewsTrump: I’m a big fan of crypto.SEC has accepted 21Shares’ spot DOGECOIN ETF application.SEC has postponed Grayscale’s Litecoin spot ETF application.Trump: What’s up with “Always Delayed Powell”? It’s not fair for an America that’s ready to bloom.Nvidia announced a “strategic partnership” with Humain to build artificial intelligence factories in Saudi Arabia.CryptocurrenciesTop Gainers:GRASS → increased by 32.5% to $2.14ETHFI → increased by 30.3% to $1.35TDCCP → increased by 30.1% to $0.41883782RAY → increased by 19.4% to $3.78SYRUP → increased by 17.3% to $0.30284282Top Losers:MOODENG → decreased by 10.9% to $0.27000123KAITO → decreased by 8.3% to $1.87PNUT → decreased by 4.5% to $0.41688071DEXE → decreased by 3.9% to $12.31MOG → decreased by 3.8% to $0.00000107Fear Index:Bitcoin: 71 (Greed)Ethereum: 58 (Greed)Dominance:Bitcoin: 62.07% ▼ 0.18%Ethereum: 9.72% ▼ 0.05%Daily Total Net ETF InflowsBTC ETFs: -$91.40 MillionETH ETFs: $13.50 MillionGlobal MarketsInflation data released in the U.S. in April came in below expectations, and with this development, the positive news from U.S. President Donald Trump’s investment talks with Gulf countries led to positive closings in the stock markets.According to the released CPI data, headline inflation came in at 0.2% monthly, below the expected 0.3%. Annual inflation also came in at 2.3%, below the market expectation of 2.4%. This marked the lowest level seen since February 2021. Core inflation, which excludes food and energy, remained in line with expectations at 2.8% annually, while it was 0.2% monthly, below the 0.3% forecast.The slowdown in service inflation continued, but the price increases in housing and rent items remained strong. Additionally, decreases were observed in food, used car, and clothing prices. On a monthly basis, energy prices rose by 0.7%, healthcare services by 0.5%, and housing costs by 0.3%. In some items, price increases due to tariffs were also observed.In addition to the inflation data, investments announced during U.S. President Donald Trump’s meeting with Saudi Crown Prince Mohammed bin Salman also supported the markets. Trump announced that a total investment of $600 billion is being worked on between the two countries. As part of this, a $142 billion arms deal was signed. Investment plans for data centers from tech giants like Nvidia, Amazon, and Google were also announced.With the impact of these developments, the Nasdaq Index rose by 1.61%, and the S&P 500 increased by 0.72%. However, the decline in shares of healthcare company United Health negatively affected the Dow Jones Index, which ended the day with a 0.64% loss.Today, markets will focus on the weekly crude oil inventory data. While Asian markets started the day on a positive note, European markets are expected to start the day flat.Most Valuable Companies and Stock PricesMicrosoft (MSFT) → $3.34T market cap, $449.14 per share, ▼ 0.03%Apple (AAPL) → $3.18T market cap, $212.93 per share, ▲ 1.02%NVIDIA (NVDA) → $3.17T market cap, $129.93 per share, ▲ 5.63%Amazon (AMZN) → $2.24T market cap, $211.37 per share, ▲ 1.31%Alphabet (GOOG) → $1.94T market cap, $160.89 per share, ▲ 0.82%Borsa IstanbulIn March, Turkey’s current account deficit came in at $4.1 billion, slightly above market expectations. The 12-month cumulative current account deficit remained steady at $12.6 billion, while excluding gold and energy, the current account surplus showed a limited increase of $0.3 billion compared to the previous month, reaching $51.6 billion. According to seasonally adjusted data, a limited improvement was observed in the general current account balance in March due to recovery in gold and energy balance. However, there was a monthly deterioration in the current account balance excluding gold and energy. This indicates that both upside and downside risks remain for year-end current account balance expectations.On Borsa Istanbul (BIST-100), after Monday’s strong rise, the index lost 0.5% on Tuesday due to profit-taking. Investors are focused on the expected Russia-Ukraine ceasefire talks in Istanbul on Thursday. The dollar-based value of BIST-100 is around the 250 level, about 15% below the March 2025 peak. Signs of recovery in inflation indicators and positive geopolitical developments could lay the groundwork for the index to move back toward its previous peaks. In this context, a flat performance is expected on BIST today.From a technical standpoint, the BIST100 index fell to the 9652 level at the start of the day yesterday, but closed the day at 9700 after buying interest. The 9475–9580 range is considered a key transition zone, and as long as it stays above this band, the upward expectation is thought to continue. If the index exceeds the 9740/9750 level, testing the 9895 resistance may come into play. In downward movements, the 9580–9475 band stands out as the first strong support region. If these levels are broken, the 9230, 9044, and 8870 levels will be followed as support. On the upside, the 9740/9750, 9895, and 9953 levels will be followed as resistance points.Most Valuable Companies on Borsa IstanbulQNB Finansbank (QNBTR) → ₺904.5 billion market cap, ₺279.50 per share, ▲ 3.52%Aselsan Electronic Industry (ASELS) → ₺623.81 billion market cap, ₺138.00 per share, ▲ 0.88%Garanti Bank (GARAN) → ₺460.74 billion market cap, ₺113.90 per share, ▲ 3.83%Turkish Airlines (THYAO) → ₺420.21 billion market cap, ₺300.75 per share, ▼ 1.23%ENKA Construction and Industry (ENKAI) → ₺404.47 billion market cap, ₺69.50 per share, ▲ 0.72%Precious Metals and Exchange RatesGold: ₺4,022Silver: ₺41.25Platinum: ₺1,242Dollar: ₺38.78Euro: ₺43.43Looking forward to meeting again tomorrow with the latest news!

Daily Market Summary with JrKripto 12 May 2025
JrKripto Daily Market Overview: Key Developments in Global and Local MarketsLet's analyze the general market conditions together and review the latest assessments.Bitcoin (BTC) is currently trading at $103,170. The strong upward trend that began at $75,930 gained momentum after surpassing the $101,059 and $104,000 resistance levels. However, following a pullback from the $104,629 level, a short-term correction is observed. In this process, the $101,059 level stands out as the first significant support. If this level holds, the upward trend may regain momentum, and surpassing the $104,629 resistance could bring the $108,000 – $109,850 targets back into focus. Otherwise, the $96,115 and $94,570 levels will be monitored as supports in downward movements.Ethereum (ETH) is trading at $2,470. The upward movement that started from the $1,486 level led to the surpassing of the $2,453 resistance, with the price reaching up to $2,550. However, profit-taking at this point caused a slight pullback. Currently, the $2,453 level is being tested as support. If this level holds, the $2,595 and $2,981 resistances could become targets again. However, if the price falls below $2,453, the $2,095 and $1,790 levels should be monitored as gradual support areas. Holding above $2,453 is critical for the continuation of the upward trend in ETH.Crypto NewsCoinbase Global is preparing to join the S&P 500.White House Senior Advisor Hassett: We are restarting relations with China. Markets can expect some normalization.Canary has applied to the CBOE for a Staked TRX ETF.NYC Mayor Eric Adams stated his goal is to make "New York the crypto capital of the world."Trump: Tariffs on China will not rise back to 145%.Top Gainers:NEIRO → Up 30.6% to $0.00059612CHEEMS → Up 11.8% to $0.00000179KAITO → Up 11.3% to $1.97ATH → Up 8.3% to $0.04188902KSM → Up 4.6% to $21.03Top Losers:PI → Down 24.5% to $1.12BONK → Down 13.2% to $0.000002222MEW → Down 12.5% to $0.00379308CHEX → Down 11.9% to $0.2264459PYTH → Down 11.8% to $0.18108267Fear & Greed Index:Bitcoin: 70 (Greed)Ethereum: 51 (Neutral)Dominance:Bitcoin: 63.04% ▲ 0.67%Ethereum: 9.16% ▼ 0.87%Daily Total Net ETF Inflows:BTC ETFs: $5.20 MillionETH ETFs: -$17.60 MillionData to Watch TodayUSA – 15:30Core Consumer Price Index (CPI) (Monthly) (April)Expectation: 0.3% | Previous: 0.1%Consumer Price Index (CPI) (Monthly) (April)Expectation: 0.3% | Previous: -0.1%Consumer Price Index (CPI) (Annual) (April)Expectation: 2.4% | Previous: 2.4%Global MarketsFollowing recent talks between the USA and China, both countries have decided to reduce tariffs reciprocally. In this context, the USA will lower its 145% tariff on Chinese imports to 30% for 90 days, while China will reduce its 125% tariff on US goods to 10% for the same period. This development, indicating a softening in trade wars, has increased optimism in global markets and led to strong gains, especially in US stock markets. The S&P 500 index rose by 3.26%, the Dow Jones by 2.81%, and the tech-heavy Nasdaq index by 4.35%. The Nasdaq has entered a "bull market" again, recovering over 20% from recent declines. All major indexes closed above the technically significant 100 and 200-day moving averages, and trading volumes exceeded the 20-day average, supporting the uptrend. The group of large technology stocks known as the "Magnificent Seven" rose by 5.80%, adding $821 billion to their total market value.In the S&P 500 index, the infrastructure sector diverged negatively with a 0.68% decline, while the consumer discretionary sector rose by 5.66%, technology by 4.66%, telecommunications by 3.35%, and industrials by 3.06%, showing the best performance. Increased growth expectations led to sales in the bond market, while the dollar strengthened. The dollar index (DXY) rose by 1.35% to 101.8, while the Euro/dollar pair fell by 1.4% to 1.109, reaching its lowest level since April 9.Today, the global markets' agenda includes the US Consumer Price Index (CPI) data for April. Market expectations are for the headline CPI to increase by 0.3% monthly and 2.4% annually. This data will be closely watched for expectations regarding the Federal Reserve's interest rate policy. Ahead of the US CPI data, futures markets are showing a slightly bearish trend, while Asian markets are negative, and European markets are expected to start the day flat to slightly negative.Most Valuable Companies and Stock Prices:Microsoft (MSFT) → $3.34T market cap, $449.26 per share, up 2.40%Apple (AAPL) → $3.15T market cap, $210.79 per share, up 6.18%NVIDIA (NVDA) → $3T market cap, $123.00 per share, up 5.44%Amazon (AMZN) → $2.21T market cap, $208.64 per share, up 8.07%Alphabet (GOOG) → $1.93T market cap, $159.58 per share, up 3.37%Borsa IstanbulIn March, domestic retail sales volume contracted on a monthly basis for the first time in 9 months. Although the index increased by 9.2% annually, it declined by 1.4% monthly, signaling a weakening in domestic demand. Notably, the sales volume of non-food products decreased by 2%, indicating that the contraction was mainly due to this category.The total turnover index, covering the industry, construction, trade, and service sectors, increased by 4.2% monthly and 33.4% annually in March. Looking at the subcategories; the industry sector turnover increased by 25.1% annually, construction by 26.3%, trade by 37.8%, and services by 35.9%. However, the 4.6% monthly contraction in the construction sector's turnover drew attention, indicating weak performance in this sector.The construction cost index increased by 1.53% monthly and 23.23% annually in March. This shows that the annual cost increase rate has been slowing down continuously for 10 months. However, with the delayed effects of the exchange rate increase experienced in the March-April period, it is estimated that this slowdown in costs, especially in material prices, may pause in the coming months.Today, the Treasury will hold auctions for 4-year TLREF-indexed and 4-year CPI-indexed bonds. Additionally, balance of payments data and foreign trade indices for March will be announced. In February, a current account deficit of $4.4 billion was recorded, and the 12-month cumulative deficit rose from $11.8 billion to $12.8 billion. In March, the current account deficit is expected to be around $3.5 billion.Yesterday, Borsa Istanbul (BIST-100) saw a strong increase of nearly 4%. The biggest contributions to the index came from BIST-30 stocks, banking, and aviation sectors. In contrast, the decline in gold prices led to negative divergence in gold mining stocks. Global and regional geopolitical developments continue to be on the agenda, with the Russia-Ukraine ceasefire talks planned to be held in Istanbul on Thursday being closely monitored. Additionally, US President Trump's Middle East visit starting today stands out as an important agenda item for the markets. Today, the current account balance data for March will also be announced. Following yesterday's strong rise, the upward trend in BIST is expected to continue today.From a technical perspective, the BIST100 index closed yesterday at 9,747, showing a strong outlook. Surpassing the previously monitored transition zone of 9,475-9,580 indicates that the uptrend has gained momentum. As long as these levels are maintained, it is anticipated that the 9,740 resistance will be surpassed, targeting the 9,895 level. The 9,580-9,475 band is now considered a support zone, and as long as these levels are maintained, the expectation of an uptrend continues. Technically, support levels for BIST100 are 9,580, 9,475, 9,230, and 9,044; resistance levels are 9,740/50, 9,895, and 9,953.Most Valuable Companies in Borsa Istanbul:QNB Finansbank (QNBTR) → ₺887.75 billion market cap, ₺264.00 per share, down 0.38%Aselsan Elektronik Sanayi (ASELS) → ₺640.22 billion market cap, ₺137.8 per share, down 1.85%Türkiye Garanti Bankası (GARAN) → ₺446.88 billion market cap, ₺108.2 per share, up 1.69%ENKA İnşaat ve Sanayi (ENKAI) → ₺438.76 billion market cap, ₺71.60 per share, down 4.34%Türk Hava Yolları (THYAO) → ₺427.11 billion market cap, ₺305.50 per share, down 1.29%Precious Metals and Exchange Rates:Gold: ₺4,057Silver: ₺41.25Platinum: ₺1,242US Dollar (USD/TRY): ₺38.80Euro (EUR/TRY): ₺43.15We look forward to seeing you again tomorrow with the latest updates!

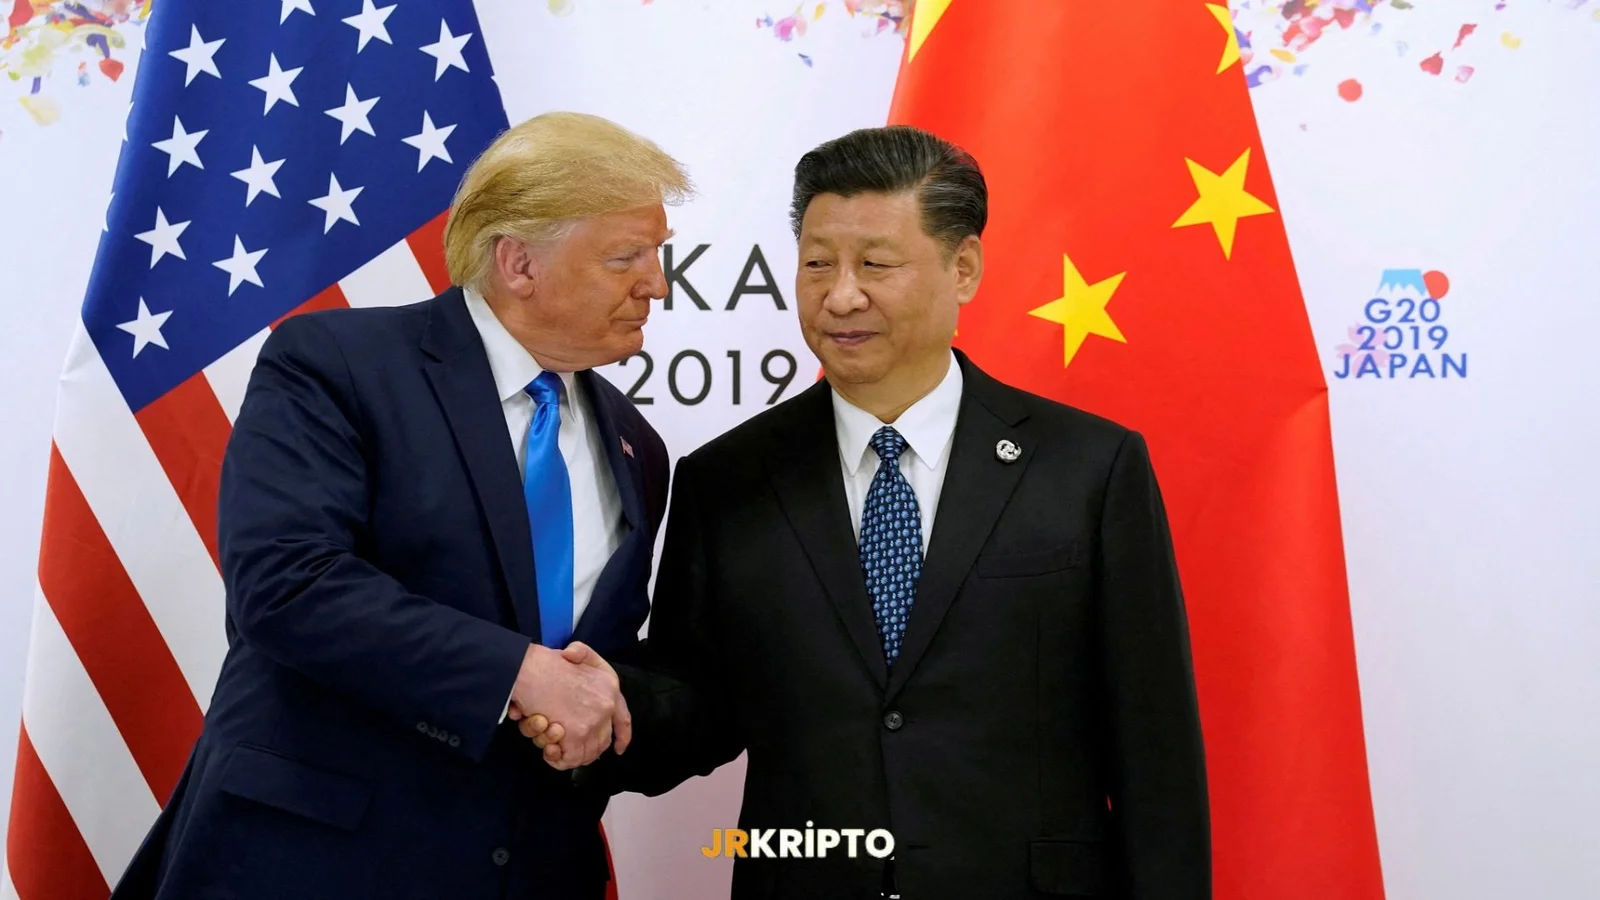
The Historic Decoupling between the US and China in the Trade Wars
A concrete agreement has finally been reached in the long-standing U.S.-China trade war. Following a critical meeting held in Geneva, both parties decided to significantly reduce high tariffs for a period of 90 days. The tone of the meeting and the messages conveyed suggest that this ceasefire could be a sign of permanent normalization rather than just a short-term pause.Sharp Tax Cuts: From 145% to 30%, From 125% to 10%According to the signed agreement:The U.S. reduced its 145% customs tariff on goods imported from China to 30%.China reduced its 125% tariff on American goods to 10%.These regulations will come into effect on May 14 and remain valid for 90 days. Automotive, steel, aluminum, and certain pharmaceutical products are excluded from this reduction.Trump: “Tariffs Will Not Go Back to 145%, This Is a Reset Process”U.S. President Donald Trump announced after the Geneva meeting that they have initiated a “complete reset process” in trade with China. He stated:“We had a very good meeting with China. We agreed on many issues. We want China to open up to American business.”Trump also emphasized that even if a new trade deal cannot be reached after this 90-day period, the tariffs will not be raised back to 145%.White House: New Agreements ComingAccording to White House sources, additional trade agreements with different countries could be announced later this week. The trade team is working on “groundbreaking” new deals with countries they are still negotiating with.Markets Reacted SwiftlyWith the announcement of the agreement, a wave of optimism spread through global financial markets. Stocks in U.S. markets surged rapidly. The Dow Jones index rose by over a thousand points, while the Nasdaq saw gains exceeding 4%, led by technology companies. Notably, shares of firms with strong supply ties to China, such as Apple, Amazon, and Dell, saw significant increases.A Turning Point for Inflation and Global TradeThe high tariffs imposed during the trade war period created significant pressure on production costs. This new agreement is expected not only to ease trade between the two countries but also to revitalize global supply chains. It is also anticipated to exert downward pressure on inflation.This agreement could have positive effects for open economies like Turkey as well. In particular, potential normalization in the prices of industrial inputs could reflect positively on producer and consumer price indices.Could the 90-Day Period Mark a New Chapter?Of course, this step is not a final agreement. But the shift in diplomatic tone, the mutual gestures, and both parties’ preference for “temporary flexibility over permanent damage” are noteworthy. If this atmosphere is maintained, the temporary implementation over three months could pave the way for a more comprehensive agreement.This contact in Geneva is not just a technical adjustment for the global economy, but also a psychological relief. It could signal a transition to a period where trade wars recede and cooperation takes precedence. If the parties can turn this ceasefire into a lasting agreement, not only their own economies but global markets as a whole could benefit from the process.
Daily Market Summary JrKripto May 2025
You can find today’s “Daily Market with JrKripto,” where we’ve compiled the most important developments in global and local markets, below. Let’s analyze the general market conditions together and take a look at the latest evaluations.Bitcoin (BTC) is currently trading at $104,300. Following a strong uptrend that started from the $75,930 level, BTC continued its rise by breaking through the $101,059 resistance and then the $104,000 level. If this upward move continues, the next potential targets are $108,000 and $109,850. However, in the event of short-term profit-taking, $101,059 should be monitored as the first support level. If BTC falls below this level, the $96,115 and $94,570 support zones could come into play. To maintain the strength of the trend, it is important for BTC to stay above $101,000.Ethereum (ETH), on the other hand, has risen to the $2,550 level. The strong rally that started from the $1,486 support has accelerated after surpassing the $2,453 resistance. If this uptrend continues, $2,595 and subsequently $2,981 could be the next resistance targets. In case of a potential correction, $2,453 has now become the first support level. If this level is breached, the $2,095 and $1,790 support levels may come back into focus. To sustain the positive outlook for ETH, holding above $2,453 is crucial.Crypto NewsTrump announced that he will sign an executive order to lower drug prices.China will reduce tariffs on U.S. goods from 125% to 10% for 90 days!The U.S. has reduced its tariffs on Chinese goods from 145% to 30%.Zelensky: I will wait for Putin in Turkey on Thursday.“I expect a full, permanent ceasefire starting tomorrow.”The White House stated that more trade deals might be announced this week.OpenAI is in talks with Microsoft for new funding and a potential future IPO.Top Gainers:MOODENG → Up 65.5% to $0.26478145PI → Up 56.8% to $1.54TOSHI → Up 36.8% to $0.00085043WIF → Up 36.5% to $1.22GOAT → Up 35.8% to $0.22228838Top Losers:SYRUP → Down 8.7% to $0.27339711DEXE → Down 5.5% to $13.23BORG → Down 5.0% to $0.24050204QGOLD → Down 3.2% to $3,221.53PAXG → Down 3.1% to $3,228.13Fear Index:Bitcoin: 70 (Greed)Ethereum: 60 (Greed)Dominance:Bitcoin: 62.93% ▼ 0.36%Ethereum: 9.22% ▼ 0.49%Daily Net ETF Inflows:BTC ETFs: $321.40 MillionETH ETFs: $17.60 MillionGlobal MarketsThis morning, global stock markets are trading positively amid optimism stemming from progress in U.S.-China trade negotiations and a ceasefire between Pakistan and India. Statements made after weekend talks between the U.S. and China indicate that the trade war, which has caused uncertainty in the markets since the beginning of the year, may be nearing resolution. U.S. President Donald Trump announced on social media that significant progress has been made between the two countries, which would benefit both sides. He also stated that drug prices would be reduced by between 30% and 80%.U.S. stock indices closed flat on the last trading day of the week (Friday), but futures are trading with strong buying interest this morning due to the positive tone of the talks. On the economic data front, the Consumer Price Index (CPI) for April, due on Tuesday, and the Producer Price Index (PPI), scheduled for Thursday, will be in focus. In corporate earnings, Cisco Systems on Wednesday and Walmart and Alibaba on Thursday will be watched closely. Geopolitically, the ceasefire between Pakistan and India has helped reduce regional risks. Asian markets have started the week positively, and European markets are also expected to open with strong gains. Overall, global markets are showing a positive trend this week thanks to growing trade optimism and easing geopolitical risks.Most Valuable Companies and Stock Prices:Microsoft (MSFT) → $3.26T market cap, $438.73 per share, up 0.13%Apple (AAPL) → $2.97T market cap, $198.53 per share, up 0.53%NVIDIA (NVDA) → $2.84T market cap, $116.65 per share, down 0.61%Amazon (AMZN) → $2.05T market cap, $193.06 per share, up 0.51%Alphabet (GOOG) → $1.86T market cap, $154.38 per share, down 0.88%Borsa IstanbulAccording to the Industrial Production Index (IPI) data released for March, seasonally and calendar-adjusted industrial production increased by 3.4% compared to the previous month. However, the unadjusted raw data showed a 2.7% year-on-year decline. The main reason for this decline is that March this year had 1.5 fewer working days compared to last year. Such calendar differences can lead to distortions in annual comparisons. In the calendar-adjusted annual data, industrial production increased by 2.5%, indicating notable monthly gains in some sectors, though this increase was not widespread across all sectors.Domestically, key data such as retail sales volume, turnover indices, and construction cost index will be announced today. Additionally, tomorrow, the Treasury will hold bond auctions indexed to TLREF (Turkish Lira Overnight Reference Rate) and CPI (Consumer Price Index), both with 4-year maturities. The current account balance, budget balance, and CBRT Market Participants Survey, which will be released this week, will also be closely monitored for insights into the economic outlook.The BIST-100 index ended last week with a 2.4% gain. As the new week begins, a positive outlook is forming, supported by diplomatic developments. In particular, the announcement of a meeting to be held in Istanbul on Thursday for Russia-Ukraine peace talks could positively impact Turkey's risk premium if the process proceeds well. On the economic front, Treasury and Finance Minister Mehmet Şimşek is expected to meet with domestic investors at an investment conference organized by Ak Yatırım following his contacts with international investors.From a technical perspective, the BIST-100 index received support at the 9232 level during Friday’s intraday pullback and closed at 9391. Technically, the 9044 level remains a strong support zone. If the recovery from this level continues, the next target could be the 9475–9580 resistance band. If this band is breached, the short-term positive outlook could strengthen further, possibly pushing the index toward the 9740–9895 range. On the downside, the 9044–8870 zone is a critical support area. A drop below this range could trigger a more pronounced decline toward 8725–8618 levels.In general, Borsa Istanbul is expected to start the week with a bullish tone in parallel with the positive global market sentiment. However, the course of economic data and diplomatic developments should be monitored closely.Most Valuable Companies on Borsa Istanbul:QNB Finansbank (QNBTR) → ₺883.56 Billion market cap, ₺269.25 per share, up 2.09%Aselsan Elektronik Sanayi (ASELS) → ₺680.35 Billion market cap, ₺141.2 per share, down 5.36%Türkiye Garanti Bankası (GARAN) → ₺425.04 Billion market cap, ₺104.4 per share, up 3.16%Turkish Airlines (THYAO) → ₺405.72 Billion market cap, ₺304.00 per share, up 3.40%ENKA İnşaat ve Sanayi (ENKAI) → ₺398.9 Billion market cap, ₺74.20 per share, up 9.04%Precious Metals and Exchange Rates:Gold: ₺4080Silver: ₺39.91Platinum: ₺1225USD: ₺38.74EUR: ₺43.55See you again tomorrow with the latest news!

A New Page in US-China Trade: Trump's "Complete Reset" Move
Donald Trump made a stunning statement after the US-China trade talks in Geneva, Switzerland: "We have launched a complete reset in US-China relations."Trump stated that the meeting with the Chinese delegation went "very well" and stressed that progress was made in many areas such as trade, technology and bilateral investments. "We have reached agreements with China on many issues," Trump said, adding that they also want China to provide greater access to the US business world.The negotiations were held in the shadow of the high tariffs imposed in recent years. It is the first time that both sides have put forward such a clear compromise to reduce trade restrictions. China's High-Level Representative He Lifeng described the talks as "a constructive dialogue taking place in the spirit of mutual respect and reconciliation."The First Concrete Steps have Been Taken in the Economic Opening Up with ChinaIn addition, the Japanese Prime Minister announced that they expect tariff reduction negotiations with the United States to be completed next July. This situation also demonstrates the Trump administration's effort to revive economic diplomacy in the Asia-Pacific region.Sunday Decrees that this development could be decisive not only for the trade balances between the two countries, but also for the cryptocurrency markets, commodity prices and global markets. The positive outcome of the negotiations can contribute to the relaxation of supply chains and the reduction of risk perception in the markets.Trump continued his optimism about economic prospects by saying that "Rate cuts would be a strong driving force for the markets."A new page is opening in the US-China talks. This step taken under Trump's leadership can also be read as an economy-centered diplomatic strategy in an election year. The new agreement expected with Japan in July and the ongoing Asian negotiations may redistribute the cards in global trade.

Daily Market Summary with JrKripto 9 May 2025
You can find today's "Daily Market with JrKripto," where we compile the most important developments in global and local markets, below. Let's analyze the general market conditions together and take a look at the latest evaluations.Bitcoin (BTC)Bitcoin (BTC) is currently trading at $103,436. The upward trend that started from the $75,930 level gained momentum up to $104,629 by surpassing the $101,059 resistance with strong volume support. Currently, pricing is observed around the $104,000 resistance. If this level is broken upwards, the $108,000 and $109,850 regions can be followed as the next targets. However, in a possible correction, the $101,059 level stands out as the first support. If this level is breached, the $96,115 and $94,570 levels will be followed as support regions, respectively. It is critically important for BTC to maintain permanence above $101,000 to preserve the strength of the trend.Ethereum (ETH)Ethereum (ETH) is currently trading at $2,346. The strong recovery process that started from the $1,486 region carried ETH up to $2,453 by surpassing critical resistances one after another. Currently, ETH is pricing just below this resistance. If the $2,453 level is broken, the $2,595 and $2,981 levels can be followed as targets, respectively. However, in possible profit-taking after the rise, the first support is located at the $2,095 level. Below this level, the $1,790 and $1,692 support levels will gain importance. It is critical for ETH to maintain permanence above the $2,095 level to preserve the upward momentum.Crypto NewsEthereum is experiencing its most significant number of up days since 2021.The SEC announced that a settlement has been reached in the ongoing lawsuit with Ripple and its executives.Trump's China tariffs may be reduced to 50%-54% next week.Treasury Secretary Bessent stated that cryptocurrency needs U.S. leadership to develop globally.Meta is considering supporting stablecoins.Donald Trump: "The stock market is really going to rally now."Donald Trump: "Now is exactly the time to buy stocks."A Standard Chartered analyst apologized for the $120,000 Bitcoin price prediction, stating that the estimate was 'too low.'CryptocurrenciesTop Gainers:PNUT → Up 61.7% to $0.28015996PEPE → Up 42.6% to $0.00001317EIGEN → Up 34.9% to $1.21BRETT → Up 29.6% to $0.08187294ZK → Up 26.5% to $0.06958545Top Losers:LAYER → Down 6.9% to $1.20SAFE → Down 6.1% to $0.52916763KAITO → Down 1.7% to $1.40VENOM → Down 1.4% to $0.11623603BCH → Down 1.0% to $413.40Fear Index:Bitcoin: 69 (Greed)Ethereum: 49 (Neutral)Dominance:Bitcoin: 64.27% ▼ 0.29%Ethereum: 8.54% ▲ 1.95%Daily Total Net ETF InflowsBTC ETFs: $117.40 MillionETH ETFs: -$16.10 MillionGlobal MarketsPositive expectations regarding the trade agreement signed between the U.S. and the UK and the upcoming U.S.-China talks over the weekend have increased optimism in global markets. U.S. President Donald Trump announced that they are close to more trade agreements and that it is an appropriate time to buy stocks. As a result of these developments, U.S. stock indices closed the day with gains. The S&P 500 index rose by 0.58%, the Dow Jones by 0.62%, and the Nasdaq by 1.07%. While most sectors in the S&P 500 index performed positively, discretionary consumer and industrial sectors rose by 1.35%, energy by 1.26%, and the raw materials sector by 1.20%. On the other hand, limited losses were observed in the health, infrastructure, real estate, and consumer staples sectors.According to the trade agreement between the U.S. and the UK, tariffs on UK-origin steel and aluminum products will be reduced to zero. In the automotive sector, the first 100,000 vehicles imported from the UK will be subject to a 10% customs duty. However, some previously announced tariffs, including the 10% tariffs that came into effect on April 2, will continue to be applied. Following this agreement, purchases in U.S. stock markets accelerated, and a slightly positive trend is observed in the futures markets this morning. The VIX volatility index has declined over the past two days, reaching 22.5.In Europe, following the approval of the agreement between the UK and the U.S. and the Bank of England's interest rate cut, the UK's FTSE 100 index closed the day down by 0.3%, while the EuroStoxx 600 index rose by 0.4%. European technology stocks gained 1.9%. In Asian markets, a mixed outlook is observed this morning, with generally flat to positive pricing prevailing.In the U.S. bond market, yields rose following the agreement news. The 10-year bond yield increased by 11 basis points to 4.38%, while the 2-year bond yield rose by 10 basis points to 3.87%. Thus, the difference between the 10-year and 2-year bond yields reached 50 basis points. The dollar index (DXY) rose by 1.0% daily to 100.6, while the Euro/Dollar pair fell by 0.6% to 1.123. In the cryptocurrency market, Bitcoin reached its highest level since the end of January, surpassing $100,000. In commodities, Brent crude oil rose by 2.8% to $62.8 per barrel due to optimistic expectations regarding U.S.-China trade talks. Gold prices, on the other hand, fell by 1.7% following the agreement news, ending the day at $3,306 per ounce.Most Valuable Companies and Stock PricesMicrosoft (MSFT) → $3.26T market cap, $438.17 per share, up 1.11%Apple (AAPL) → $2.95T market cap, $197.49 per share, up 0.63%NVIDIA (NVDA) → $2.86T market cap, $117.37 per share, up 0.26%Amazon (AMZN) → $2.04T market cap, $192.08 per share, up 1.79%Alphabet (GOOG) → $1.88T market cap, $155.75 per share, up 1.93%Borsa IstanbulDomestically, in April, the Treasury's cash balance posted a deficit of 183.5 billion TL, while the primary balance showed a surplus of 73.6 billion TL. In the same period last year, there was a deficit of 237.1 billion TL and a primary deficit of 132.1 billion TL. In April, budget revenues increased by 64.0% annually, while expenditures rose by 40.2%. Thus, the total cash deficit in the first four months of the year reached 1 trillion 85 billion TL.The Istanbul Chamber of Industry's Turkey Export Climate Index decreased by 0.7 points in April, reaching 50.8. The index has remained above the threshold level of 50 for 16 months. However, uncertainties in global trade and economic slowdowns in some export markets appear to have pressured the index. Today, domestic industrial production data for March will be announced. Preliminary indicators suggest that the weak trend in production continues.The BIST 100 index has been finding support above the 9,000 level for the past week and closed yesterday at 9,279 points, up over 2%. Notably, there was intense buying in the defense industry, petrochemical/refinery, aviation, and telecommunications sectors. The positive atmosphere in global stock markets also supported BIST. Today, it is expected that the buying trend in BIST will continue, but the pace of the increase may slow down. Next week, messages from Treasury and Finance Minister Mehmet Şimşek during investor meetings will be closely monitored.From a technical perspective, the BIST100 index rose strongly from the 9,033 level. The 9,044-8,870 range maintains its importance as a support zone. As long as it stays above this area, the upward reaction is expected to continue. However, if it falls below this zone, a pullback to the 8,618-8,500 levels may occur. On the upside, the 9,490-9,594 band is the first resistance area, and if these levels are surpassed, there is potential for a rise towards the 9,740-9,895 band.Most Valuable Companies in Borsa IstanbulQNB Finansbank (QNBTR) → 875.19 billion TL market cap, 263.75 TL per share, up 0.96%Aselsan Elektronik Sanayi (ASELS) → 702.7 billion TL market cap, 150.9 TL per share, down 2.08%Türkiye Garanti Bankası (GARAN) → 422.94 billion TL market cap, 99.7 TL per share, down 1.04%Türk Hava Yolları (THYAO) → 392.61 billion TL market cap, 288.50 TL per share, up 1.41%ENKA İnşaat ve Sanayi (ENKAI) → 381.32 billion TL market cap, 66.85 TL per share, up 2.77%Precious Metals and Exchange RatesGold: 4,126 TLSilver: 40.59 TLPlatinum: 1,235 TLDollar: 38.73 TLEuro: 43.50 TLLooking forward to meeting again tomorrow with the latest news!
