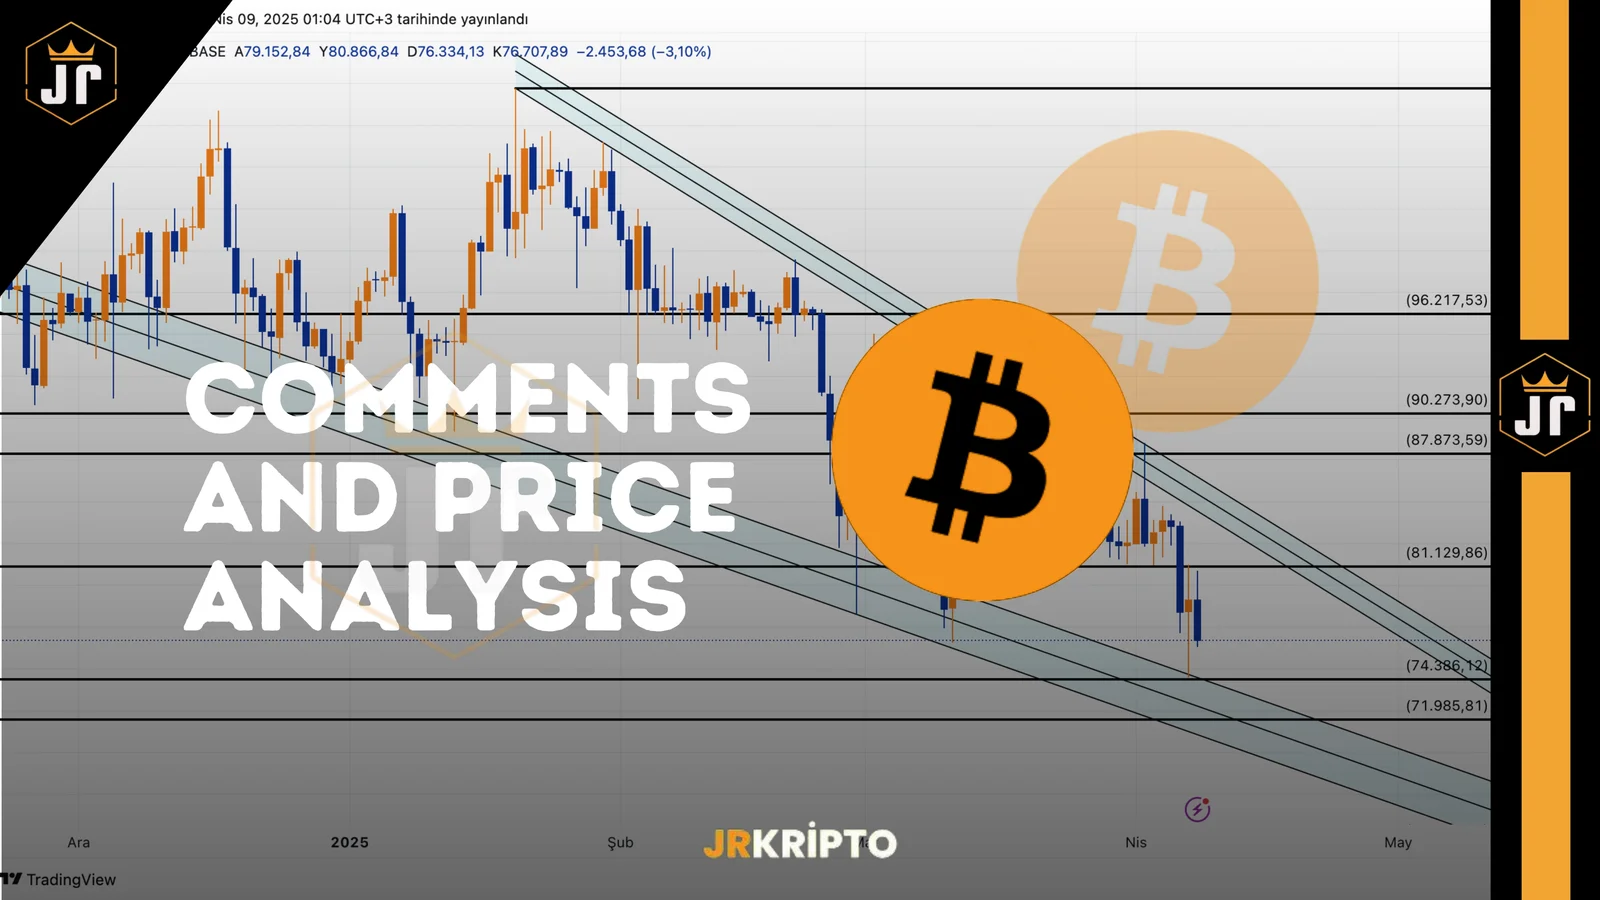
Bitcoin (BTC) and the Latest Crypto Market Outlook: Key Levels and Trend-Defining Indicators
As the cryptocurrency market continues to revolve around Bitcoin’s price action, all eyes are on the critical levels highlighted by technical analysis. As of April 2025, global economic volatility, signals from the U.S. Federal Reserve regarding monetary policy, and Bitcoin dominance are all pointing toward a potential major breakout.
In this analysis, we’ll dive into Bitcoin’s key support and resistance zones, the structure of USDT dominance, and how macroeconomic developments could impact the market.
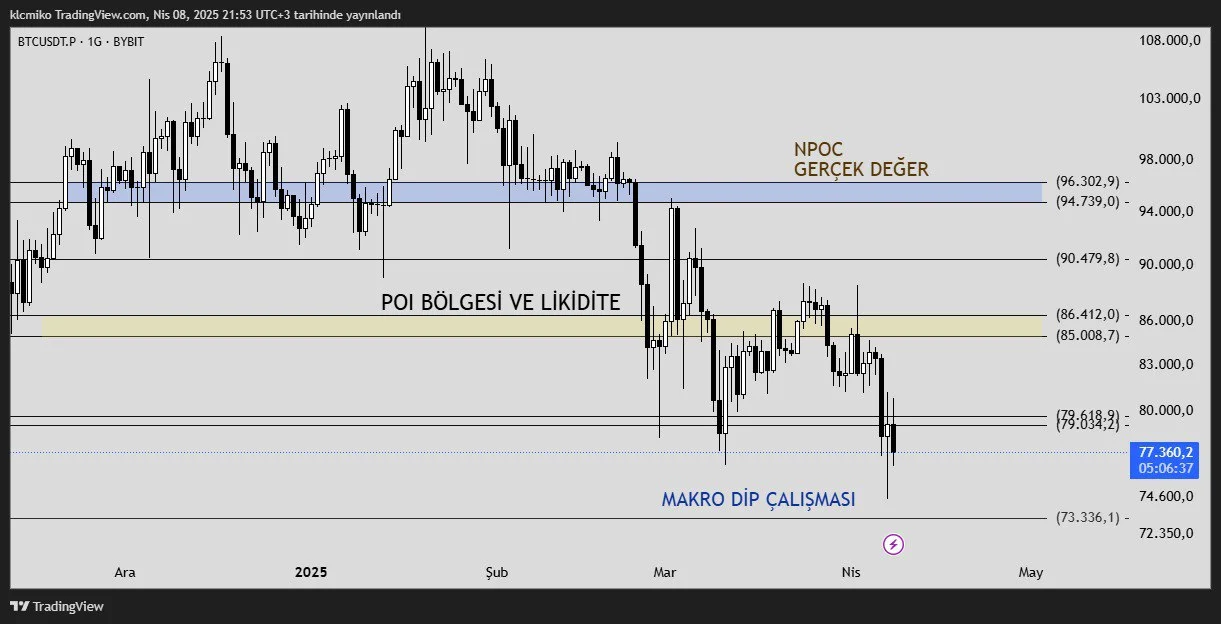
Key Technical Levels for Bitcoin
$73,336 – Historical Bottom Zone (Macro Support)Bitcoin previously marked this level as a major bottom before rallying 2.5x. It remains a psychologically and technically important area. If the price revisits this zone, strong buying pressure could re-emerge as it did in the past.
$79,618 – Daily Close LevelA confirmed daily close above this threshold could turn the short-term outlook bullish. This level signals buyers regaining control and may serve as a short-term trend indicator.
$85,000 - $86,400 – POI (Point of Interest)This zone is where buyers and sellers have historically clashed. A strong breakout here, backed by high volume, could be decisive for momentum. It may also act as a key profit-taking level.
$90,500 – Liquidity Cluster and ResistanceThis is a heavy resistance zone with accumulated stop-loss orders and pending trades from short-term players. A breakout here could trigger sharp movements due to liquidity release.
$94,700 - $96,900 – NPOC and Critical ResistanceThis range, known as a "Naked Point of Control" (NPOC), represents a high-volume area where past price action failed to find equilibrium. If Bitcoin breaks through with volume, it could clear the path toward the $100,000 milestone. This area may also be a spot where investors re-enter positions.
What Are the Macroeconomic Indicators Telling Us?
Global economic shifts are directly impacting the crypto markets. One of the most notable recent events is former President Donald Trump’s public plea to the Federal Reserve:
“Cut interest rates now!”
Markets quickly responded. Futures contracts began pricing in a total of 120 basis points in rate cuts by year-end. Rate cuts imply more liquidity entering the system, which could create a major opportunity for limited-supply assets like Bitcoin.
Overall Market Outlook
Technical indicators suggest Bitcoin is on the verge of a major breakout. The $73,336 level could serve as a strong accumulation zone for long strategies, while the upper resistance levels are the gateways to a potential bull market. A sustained move above $94,700 could bring a test of the $100,000 psychological barrier.
Meanwhile, the prospect of Fed rate cuts combined with signs of global monetary expansion strengthens the technical case for a bullish scenario in the second half of 2025.
USDT Dominance (USDT.D) Technical Analysis – Key Levels and Potential Scenarios
USDT Dominance (USDT.D) is one of the most important indicators for analyzing investor sentiment in crypto markets. Rising dominance suggests risk aversion, while declining dominance signals growing risk appetite.
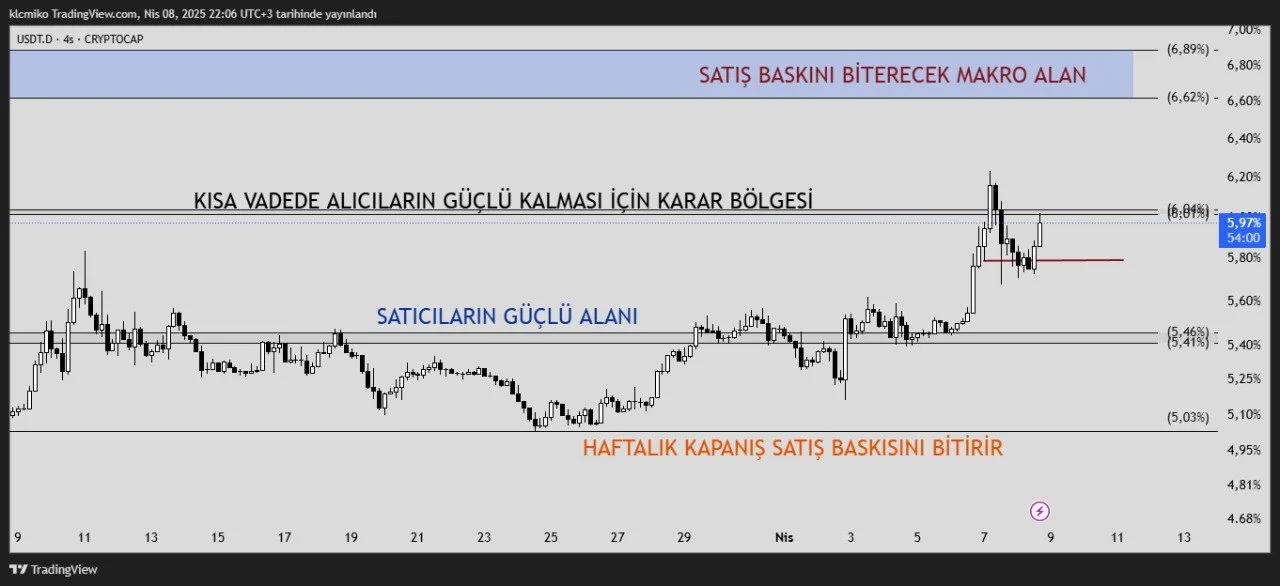
Below is a breakdown of the key technical levels and potential scenarios:
- 5.03% – Level That Could End Selling PressureThis has historically been a bottom zone where the market has rebounded and shifted toward risk assets. A weekly close below this level would suggest a move back into Bitcoin and altcoins. Dropping below this area could signal the start of an altcoin season.
- 5.41% – 5.46% Range: Strong Seller ZoneThis resistance zone has repeatedly triggered sell-offs and flows back into USDT. While currently broken, it's essential to watch if it will act as support on a retest.
- 6.20% – 6.89% Range: Macro Zone to End Selling PressureThis range marks one of the historically highest USDT dominance zones and often coincides with major market pullbacks. If dominance rises to this level again, market panic may increase, but this zone also frequently marks trend reversals. Approaching this area could present entry opportunities in altcoins.
Disclaimer: This analysis does not provide investment advice. It highlights support and resistance levels that could present potential short- to medium-term opportunities depending on market conditions. All trading decisions and risk management remain the responsibility of the individual. Stop-loss strategies are strongly recommended for all trades.