ONDO Technical Outlook
The notable development has been the ETF tokenization agreement with Franklin Templeton. With this partnership, traditional assets such as stocks, bonds, and gold are aimed to be traded on the blockchain, and an increase in total value locked has been observed in a short time. In addition, MetaMask integration and expansion to different networks allow these products to reach a wider user base. Alongside this, the continuation of institutional partnerships shows that ONDO holds a strong position, especially in the RWA space. Therefore, it is important to observe how increasing institutional interest and new products are reflected in the technical chart.
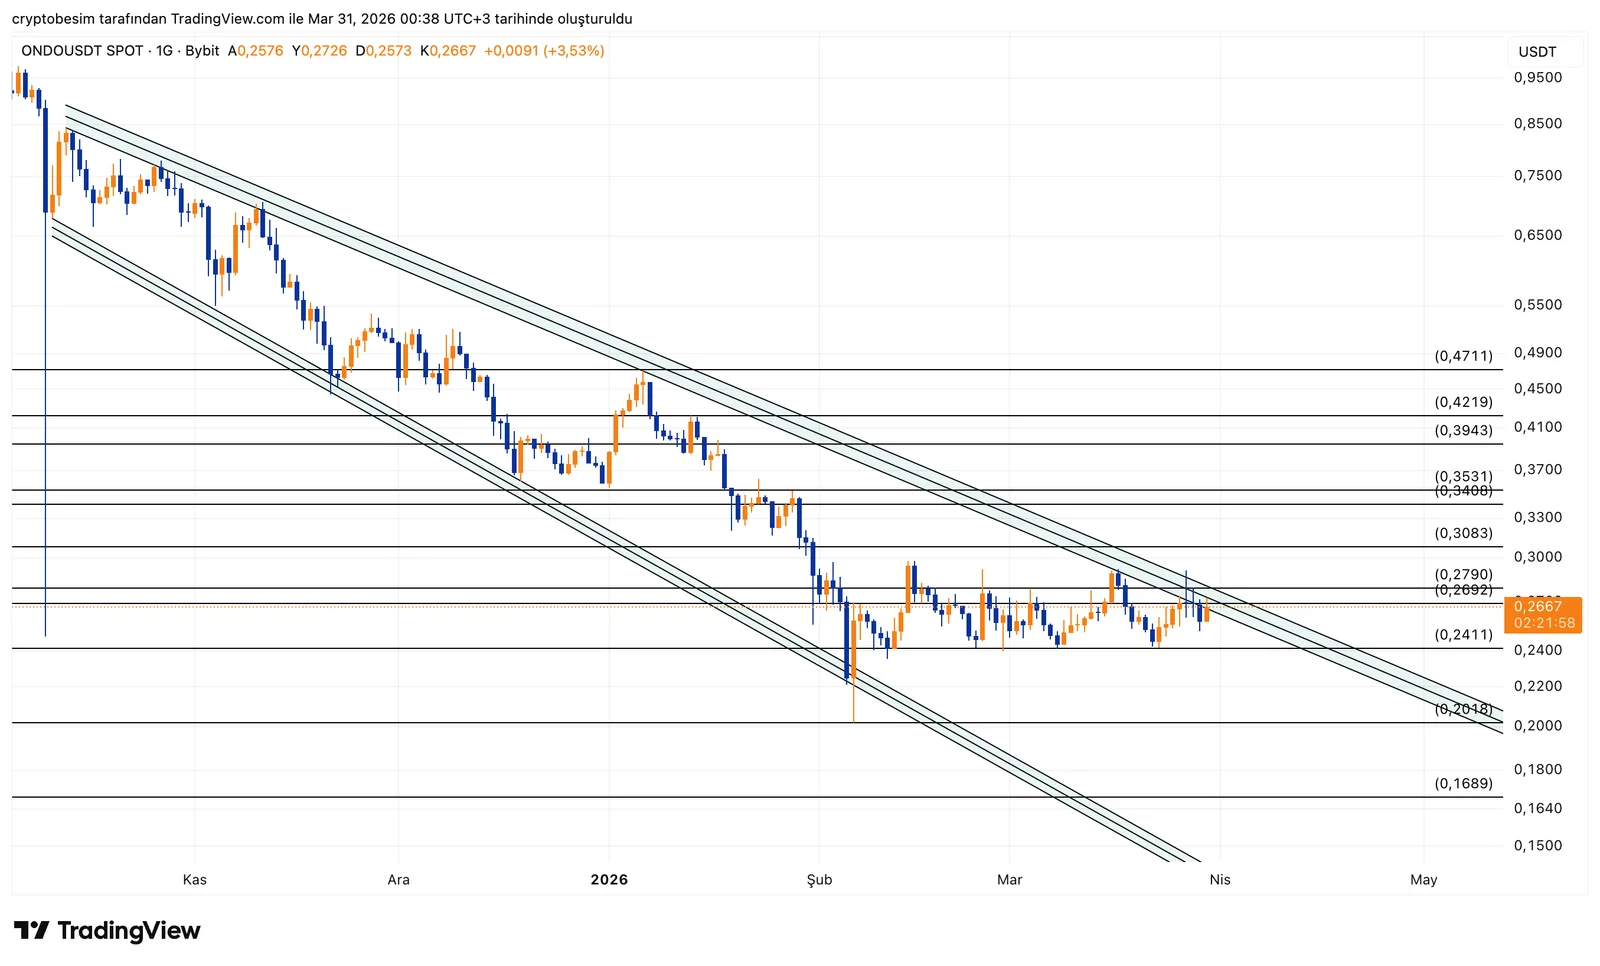
From a technical perspective, the long-standing descending channel structure is still intact. Price can be considered to have formed a range within this structure. Currently, it is priced at a horizontal resistance level based on Fibonacci.
At the moment, price is exactly touching the upper band of the channel. This means we are at one of the key decision points technically. At the same time, price is moving within the 0.24–0.29 range, where an accumulation phase appears to have formed.
In structures like this, two scenarios usually stand out. Either the upper band of the channel breaks and the sideways accumulation expands upward, or price gets rejected again and continues to move within the range.
- The 0.24–0.29 range is the main short-term trading zone
- If the channel upper band breaks, the structure turns positive
- Above 0.29, upward momentum increases
- If rejection occurs from the channel, price pulls back into the range
- If 0.24 breaks downward, selling pressure strengthens again
These analyses do not provide investment advice and focus on support and resistance levels that are considered to offer short- and medium-term trading opportunities depending on market conditions. However, responsibility for execution and risk management lies entirely with the user. In addition, the use of stop loss is strongly recommended.


