
AR/USDT Technical Analysis
When we analyze the AR chart, we can see a falling wedge pattern, similar to the 1INCH chart. Though the price has been moving downward within the wedge for some time, the recent bounce from the lower band has pushed it back toward the upper band. This increases the chances of a bullish breakout.AR is currently trading around $6.52. In the short term, the $6.67 – $6.78 range stands as the first major resistance. A breakout above this zone could pave the way toward $7.08 and then $7.39 – $7.50. If the price can break above $7.50 with strong volume, the $8.50 region becomes the main target.On the downside, the first short-term support is at $6.36. A breakdown below this level may lead to a retest of $6.11. However, due to the wedge structure, buyers are more likely to step in around these areas.
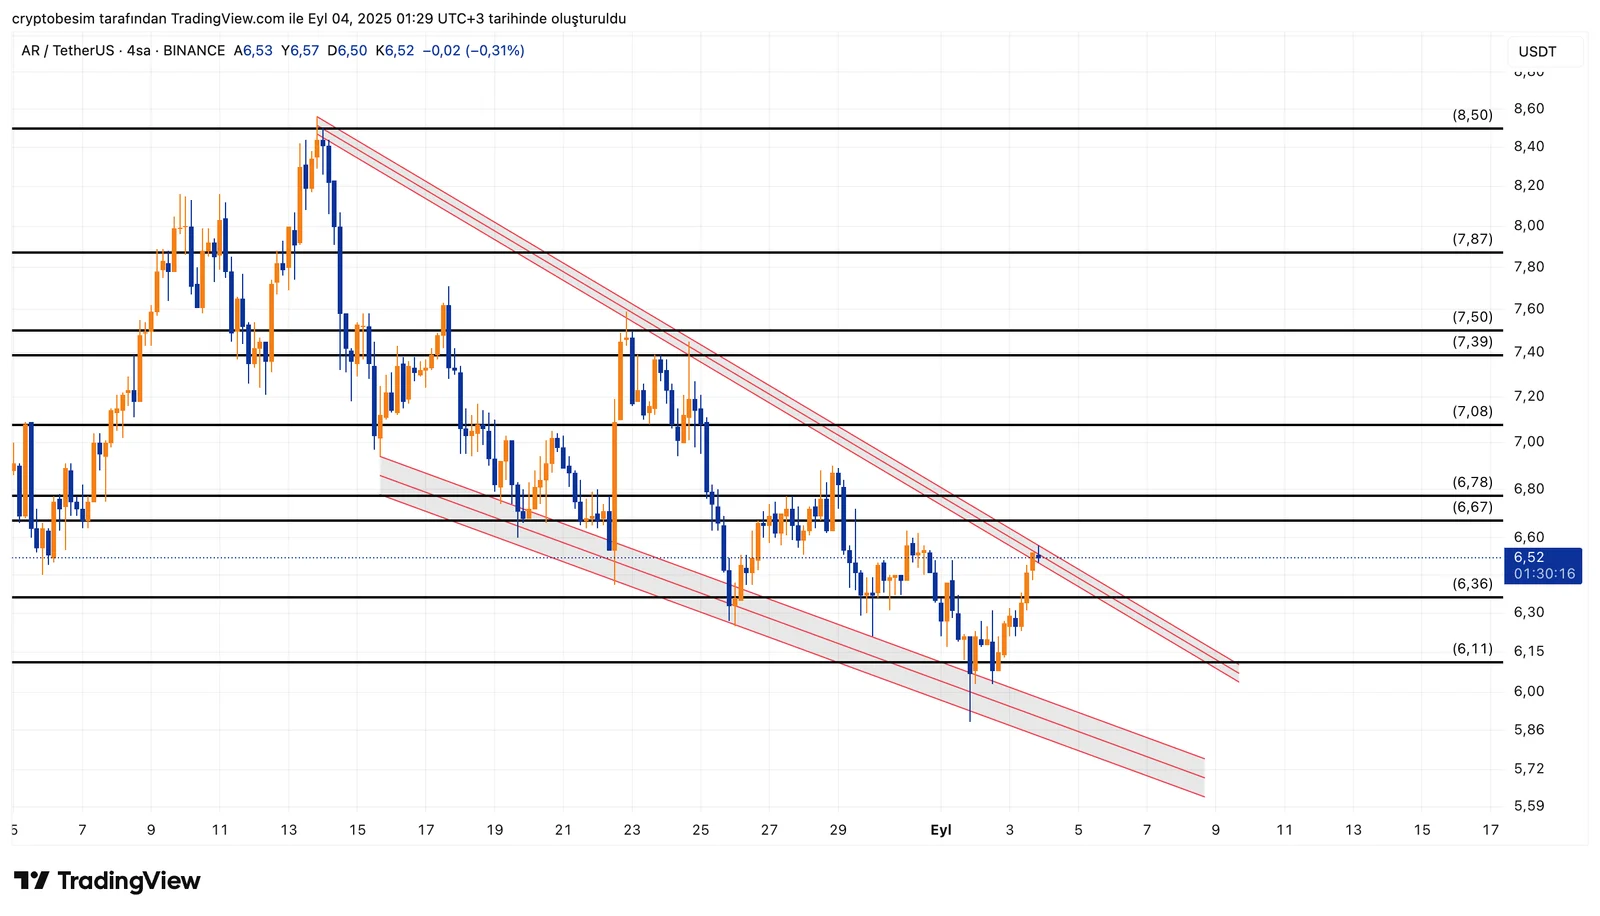
Summary:
- Falling wedge structure remains active.
- Key resistance: $6.67 – $6.78, then $7.08 and $7.39 – $7.50.
- Main breakout target: $8.50 if $7.50 gets broken with volume.
- Supports: $6.36 and $6.11.
Technical outlook remains bullish as long as the wedge holds.
(This analysis does not provide financial advice. Risk management and stop-loss strategies are strongly recommended.)


