
1INCH/USDT Technical Analysis
Analyzing the 1INCH chart, we can see a clear falling wedge pattern. The price of the coin has stuck between the upper and lower trendlines of the wedge for a long time. Such patterns usually end with an upside breakout, with a technical target equal to the height of the wedge.1INCH is currently trading around $0.25. Key short-term levels to follow are:
- $0.245 → first support level.
- $0.258 → aligns with the wedge’s upper trendline, acting as the nearest resistance.
- $0.275 and $0.297 → key resistance zones above.
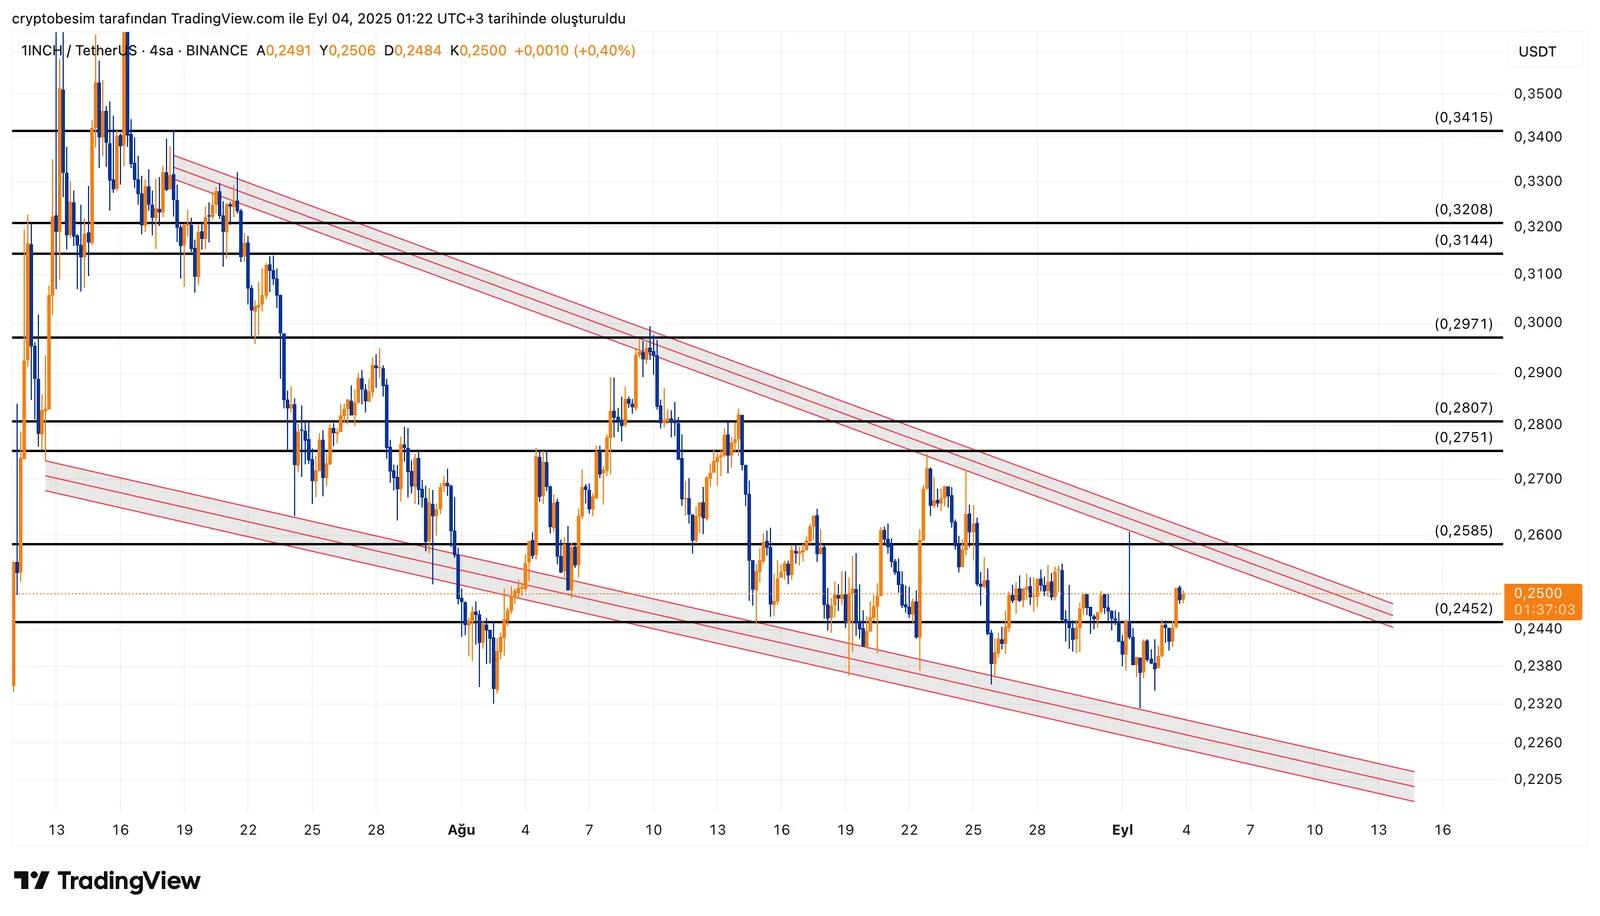
If an upward breakout happens according to a bullish scenario, the target—based on wedge height—points to the $0.34 area. Before reaching that level, the price must break above the intermediate resistances at $0.28 and $0.31.
If the $0.245 support is lost according to a bearish scenario, the price may pull back to $0.23 and then $0.22. However, such retracements would not invalidate the wedge structure, and in fact could make the potential for an upward breakout even stronger.
Overall, the pattern remains valid, and the $0.34 region stands out as the main technical target if the wedge breaks upward.
(This analysis does not provide financial advice. Risk management and stop-loss strategies are strongly recommended.)


