
ALT Technical Analysis
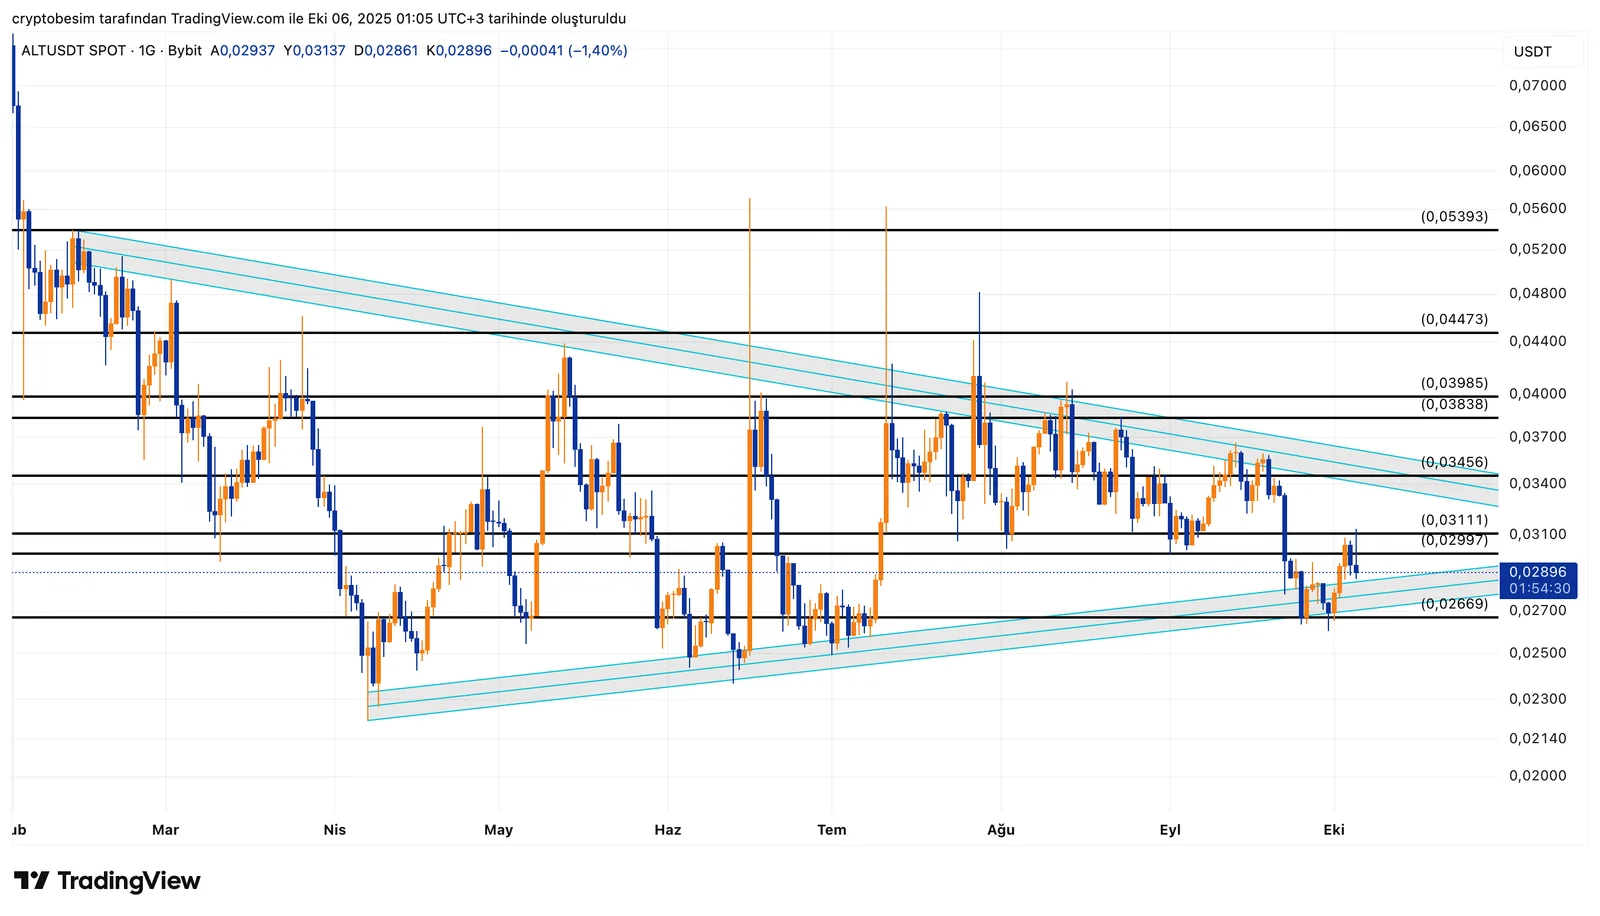
Analyzing the ALT chart, we see that the coin is still forming a symmetrical triangle pattern, with the price currently trading near the lower boundary of the structure. This area can be considered the final phase of the formation, where a breakout in either direction typically occurs with strong momentum.
ALT is currently trading around $0.0289, and the lower border of the triangle at $0.0266 is acting as a critical support level. The overall technical outlook remains positive as long as the price holds above this zone. The first resistance to monitor is $0.0311; above this, a move toward $0.0345 could be triggered with a daily close. The technical target area, in case of a bullish breakout, lies between $0.039 and $0.045. However, if the price closes below $0.0266, the pattern may be invalidated, and a drop toward $0.024 could occur.
Summary:
- Support level: $0.0266 (key level to hold)
- Resistance levels: $0.0311 → $0.0345
- Bullish target (if breakout occurs): $0.039 – $0.045
- Bearish risk: Below $0.0266 → potential move to $0.024
The chart is in its final consolidation phase, and a decisive breakout will likely define the next major directional move.


