
ZRO Technical Analysis
When we analyze the ZRO chart, we can see a clear symmetrical triangle formation occurring. The price is trading between the downtrend line from above and the ascending trendline from below, and it is almost at the end of the formation currently. This pattern has great potential to see a breakout in the coming days.
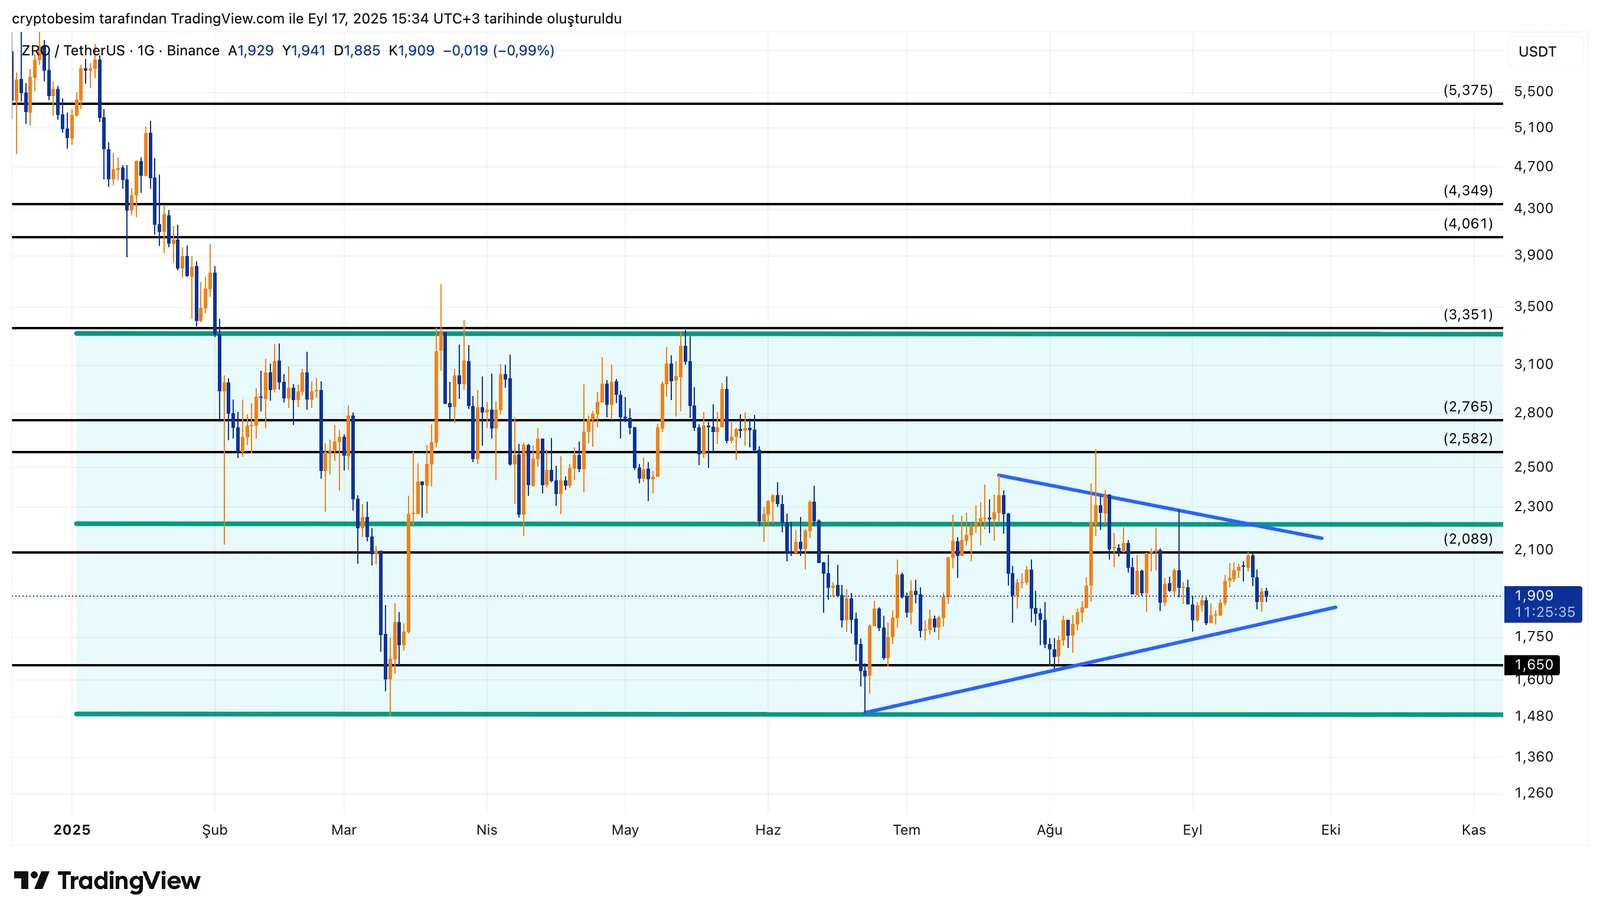
ZRO is currently trading around the level $1.90, close to the mid-border of the triangle pattern. Here, the level at $1.75 stands as a crucial support. Below this support, ZRO might retreat to the level at $1.65, and it is possible to test the range between the levels $1.48 and $1.60 in case of a deeper correction.
According to a bullish scenario, the most important resistance ahead is the level $2.08. Holding above it, ZRO could surge to the levels $2.58 and $2.75. Also, we can talk about a technical target — $3.35 — if the triangle gets broken above.
Summary:
- The price is around $1.90, trading at the mid-border of the triangle.
- Holding above $2.08 would open the way for $2.58 and $2.76.
- Trading below $1.75 has potential risk for the levels $1.65 and $1.48.
These analyses, not offering any kind of investment advice, focus on support and resistance levels considered to offer trading opportunities in the short and medium term according to the market conditions. However, traders are responsible for their own actions and risk management. Moreover, it is highly recommended to use stop loss (SL) during trades.


