
WLFI/USDT Technical Analysis
On the WLFI side, the main driver behind recent price action has been increasing political narrative and the upcoming crypto ball. This structure, associated with Trump, has accelerated expectation-driven buying ahead of the event. Although various claims and potential partnerships are circulating on social media, there has been no clear and confirmed statement from the project side yet. This shows that current market interest is largely driven by narrative and expectations. How the agenda becomes clearer in the coming days will also determine the direction on the price side.
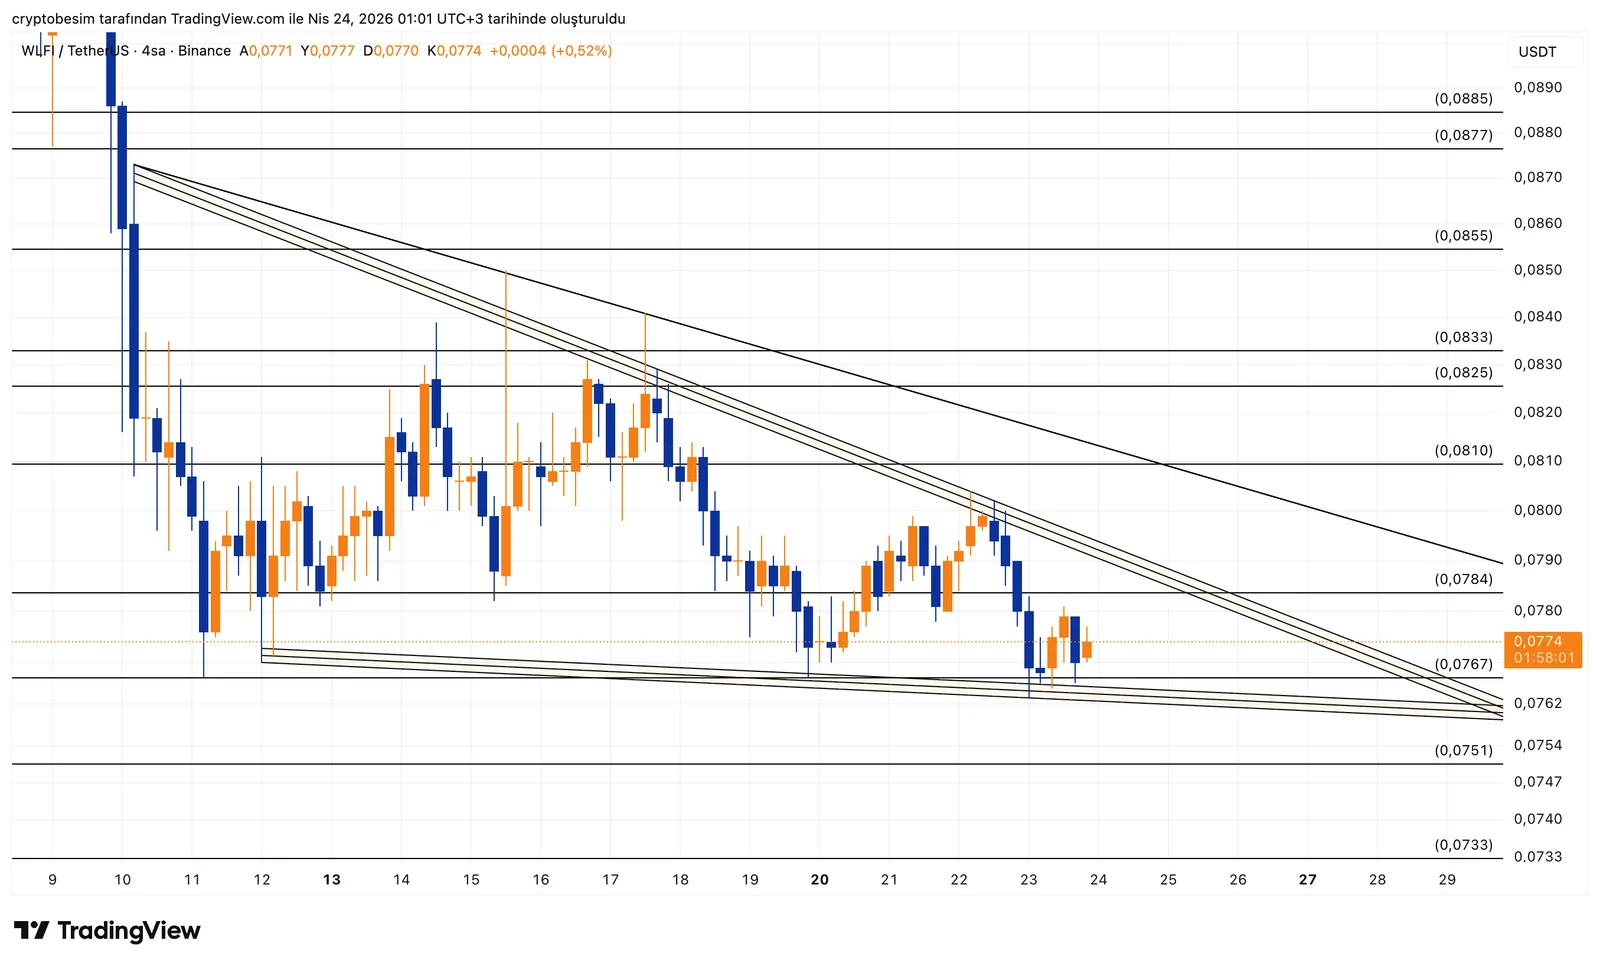
From a technical perspective, WLFI is moving close to a descending triangle formation. The descending trendline is working consistently, while a horizontal support line is forming below, and price is currently sitting at the intersection of these two structures.
The 0.078 – 0.080 range is acting as resistance. Each test has been met with selling, so without breaking this level, continuation to the upside remains difficult.
On the downside, the 0.0767 – 0.0760 range acts as the base of the triangle. Price is currently trying to hold this area. If this level is lost, the structure completes to the downside.
Upside scenario:
- Close above 0.080 → upward breakout
- 0.0810 first resistance
- 0.0833 next target zone
Downside scenario:
- Close below 0.076 → structure resolves downward
- 0.0751 first support
- 0.0733 lower support zone
Overall, price is trying to hold above support, but resistance pressure continues. Therefore, it is healthier to act based on the breakout direction.
These analyses do not provide investment advice and focus on support and resistance levels that are considered to offer short- and medium-term trading opportunities depending on market conditions. However, responsibility for execution and risk management lies entirely with the user. In addition, the use of stop loss is strongly recommended.