
WLD Technical Analysis
On the Worldcoin side, recent headlines have focused on the project’s global expansion efforts. In particular, new registration programs launched in different countries for the World ID identity verification system and the growing number of users have drawn attention. The project aims to expand its model built around human verification in the age of digital identity and artificial intelligence. With these developments, WLD has returned to the market’s radar. For that reason, it is important to observe how this increase in users and expansion news is reflected in price action on the technical chart.
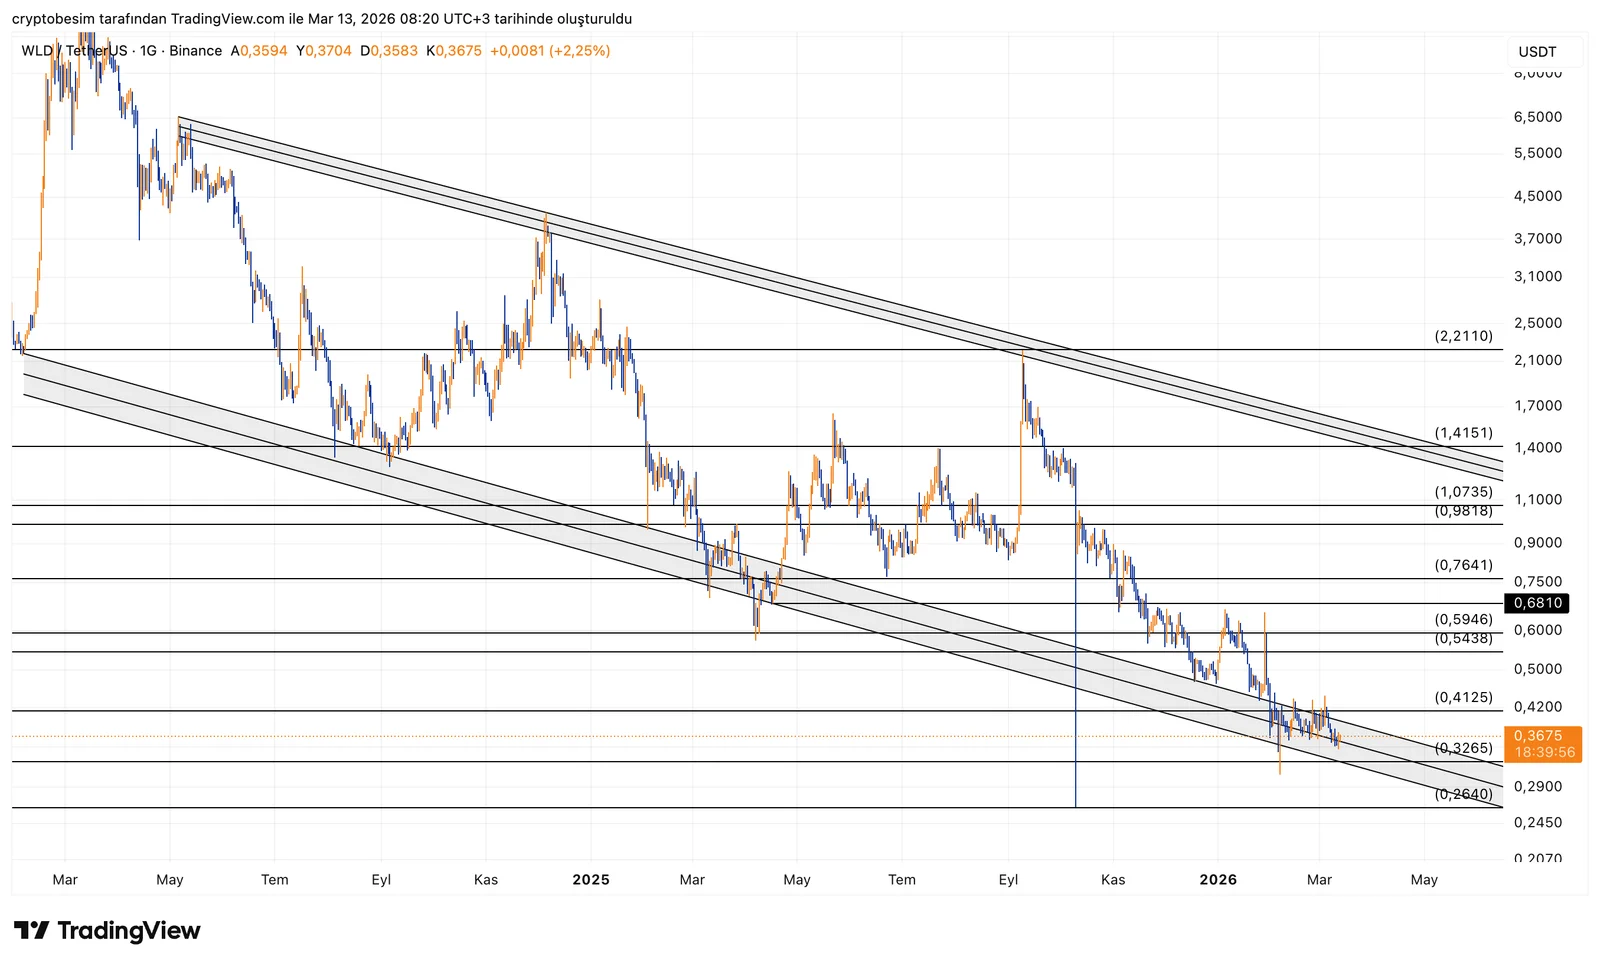
Looking at the chart from a broader perspective, a long-term falling wedge structure becomes visible on WLD. Price has been moving within this narrowing formation for quite some time, forming lower highs and lower lows. However, one notable detail is that during each pullback, price has reacted from the lower trendline. In other words, even though the downtrend continues, this support line is still carrying the price for now.
Price is currently trading around 0.36–0.37 dollars, once again very close to the lower trendline. This area has been tested several times, and buyers stepped in each time. As long as this support line continues to hold in the short term, it would not be surprising to see price attempt another upward relief move.
On the upside, the first key zone to watch is the 0.41 – 0.42 dollar range. This area represents a nearby resistance and a level where price has struggled repeatedly after the recent decline. If price manages to move above this region, the next potential upside range opens toward 0.54 – 0.59 dollars. Further above, 0.76 dollars stands out as a stronger resistance level on the chart.
On the downside, the most critical reference remains the lower trendline of the wedge. This line currently aligns with the 0.32 – 0.33 dollar area. If this support breaks to the downside, the structure would weaken and a pullback toward the larger support zone near 0.26 dollars could come into focus.
Looking at the broader picture, WLD has been in a long-lasting compression phase. Although the downtrend persists, the trading range is gradually narrowing. Structures like this often result in a sharp move once a breakout occurs. For that reason, the upper wedge boundary and the lower trendline support will remain the two key areas determining direction in the coming period.
These analyses do not provide investment advice and focus on support and resistance levels that are considered to offer short- and medium-term trading opportunities depending on market conditions. However, responsibility for execution and risk management lies entirely with the user. In addition, the use of stop loss is strongly recommended.


