
WLD Technical Outlook
Analyzing the WLD chart, we see that the price of the coin has recently broken out upward from a long-standing falling wedge pattern, triggering a sharp rally up to $2.13. Following this strong move, WLD entered a correction phase, stabilizing within the $1.12–$1.22 range. This consolidation, which aligns well with Fibonacci retracement levels, indicates a healthy pause within the trend.WLD is currently trading around $1.25. The bullish pattern remains intact as long as the price holds above the $1.12–$1.22 support zone. The key resistance levels to watch above are $1.55 and $1.96. A strong breakout above these areas could pave the way for a move toward $2.13 again and, in the medium term, potentially $2.75.
The main support area lies between $1.12 and $1.22. If the price closes below this zone, WLD might drop to $0.91.
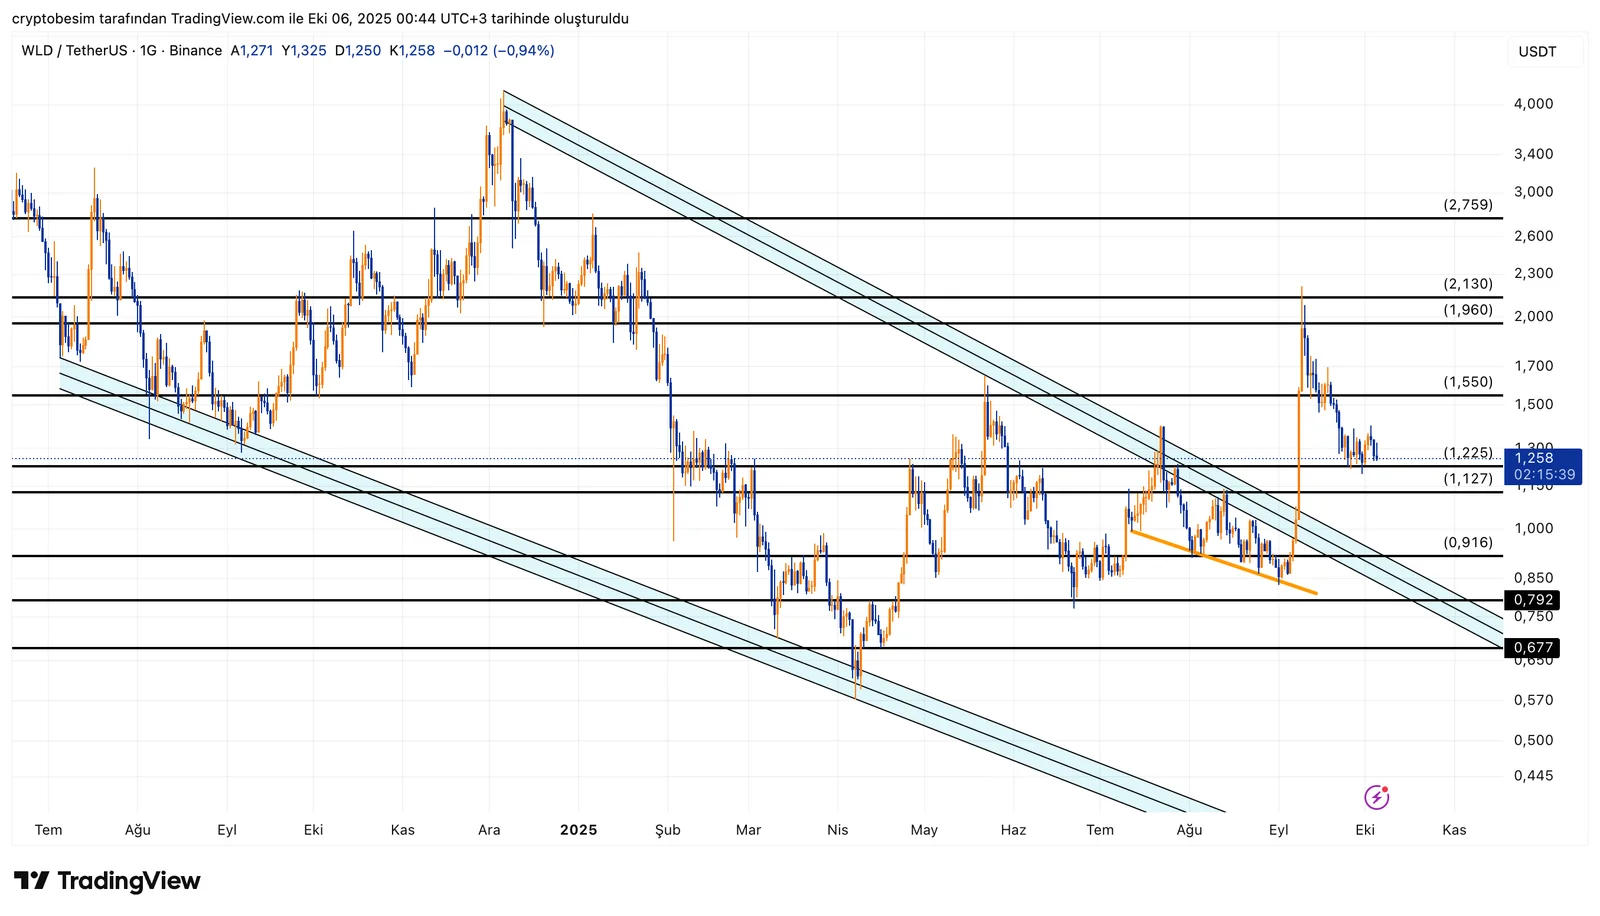
To summarize, the breakout from the falling wedge is still valid, and the trend bias remains positive as long as the $1.12–$1.22 area holds. Sustained strength above this zone keeps the door open for a move back toward $2 and beyond.
These analyses, not offering any kind of investment advice, focus on support and resistance levels considered to offer trading opportunities in the short and medium term according to the market conditions. However, traders are responsible for their own actions and risk management. Moreover, it is highly recommended to use stop loss (SL) during trades.


