
UNI/USDT Technical Analysis
Uniswap has been quite active lately. The new v4 update gives developers more flexibility and lower costs, while investors are discussing ideas like revenue sharing for the UNI token. These updates make both on-chain activity and the UNI price structure more important than ever.
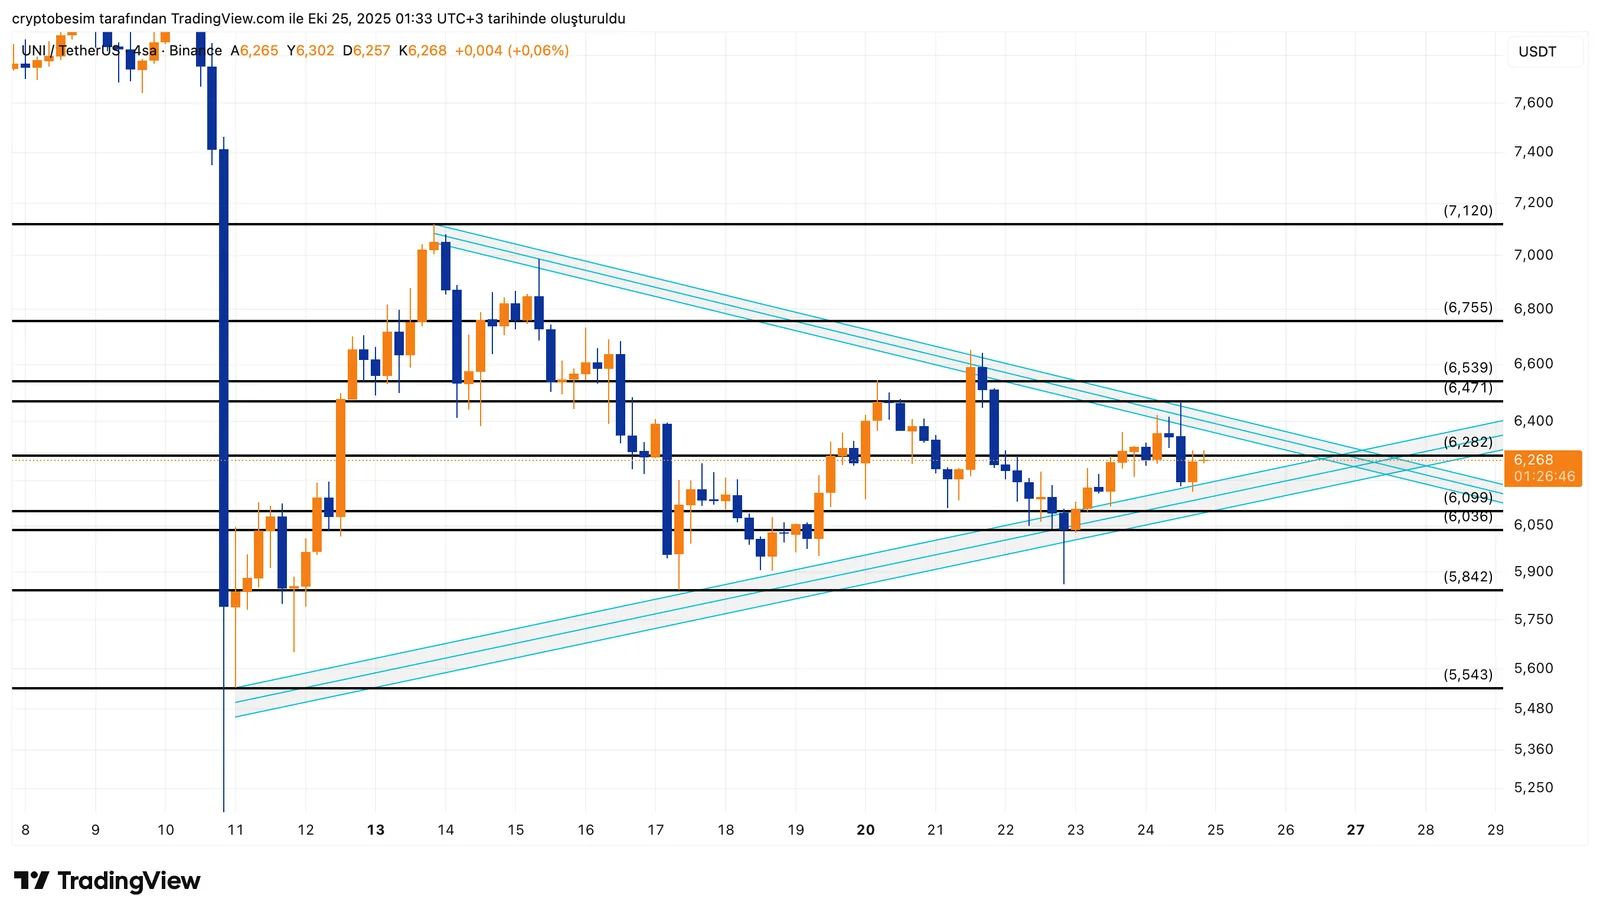
Analyzing the chart, we see that UNI is still trading inside a symmetrical triangle pattern. The price is now very close to the breakout point, meaning a big move could be coming soon. Although trading volume is still low, the pattern is reaching its final stage, which often leads to a strong breakout.
Currently, UNI has strong support between $6.03–$6.09, while the upper resistance of the triangle is around $6.28–$6.35. The price is moving between these two levels, showing that the market is undecided for now. However, the chart suggests that an upward breakout is more likely.
If the price closes above $6.35, it could start a new bullish move.If it drops below $6.00, that would be a warning for a possible downward move.
- Support Levels: $6.09 → $6.03 → $5.84 → $5.54
- Resistance Levels: $6.28 → $6.35 → $6.47 → $6.53 → $6.75 → $7.12
In summary:
- UNI is near the breakout point of a triangle pattern.
- A close above $6.35 confirms a bullish breakout.
- The target for the move is around $7.00 and higher.
- A drop below $6.00 increases downside risk.
- Strong and volatile price action can follow the breakout direction.
These analyses, not offering any kind of investment advice, focus on support and resistance levels considered to offer trading opportunities in the short and medium term according to the market conditions. However, traders are responsible for their own actions and risk management. Moreover, it is highly recommended to use stop loss (SL) during trades.


